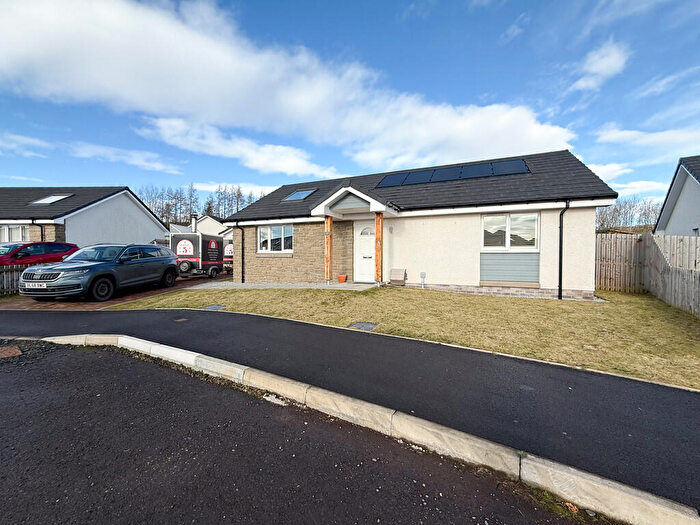
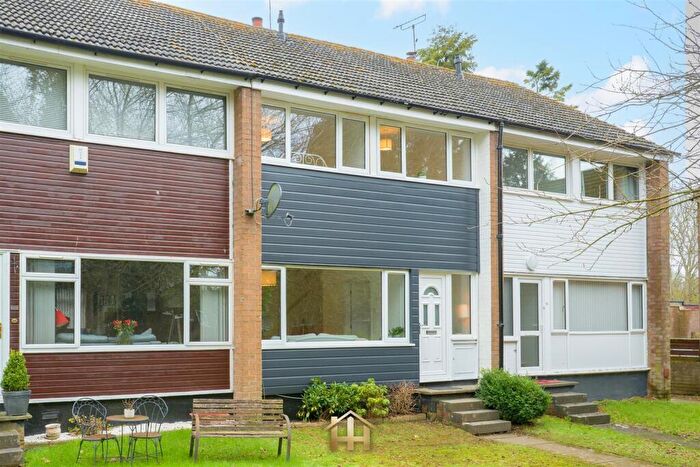
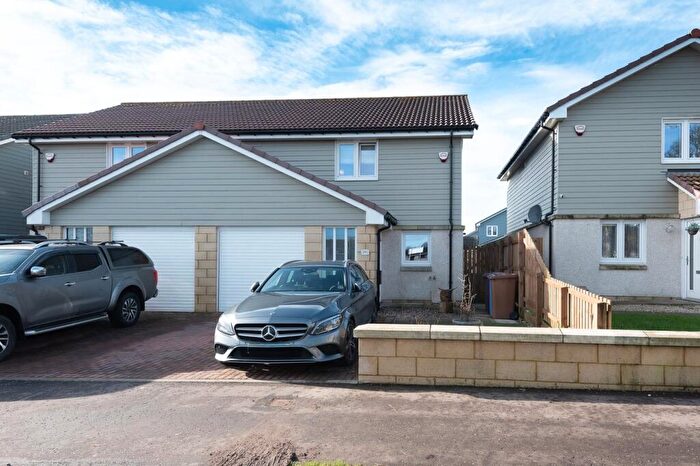
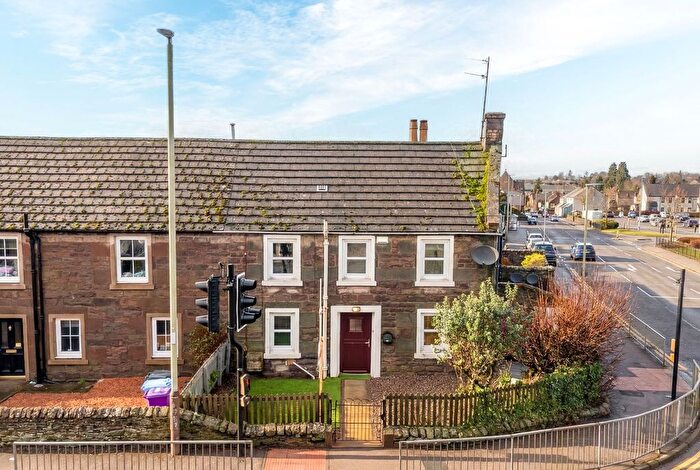
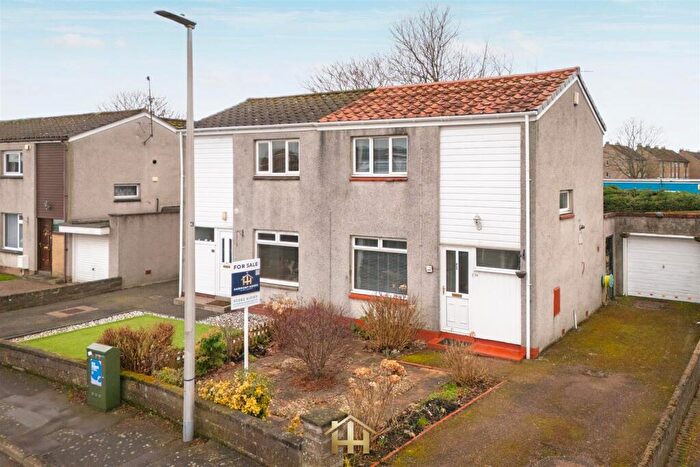
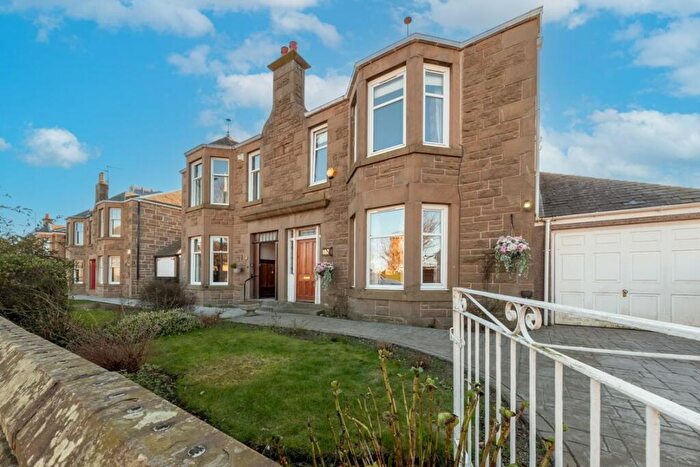
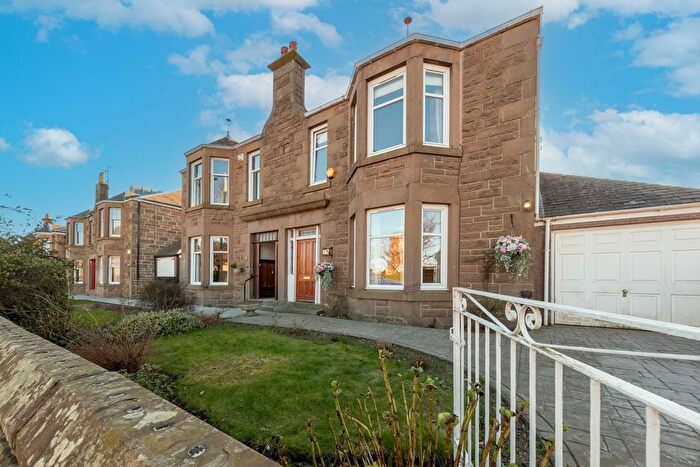
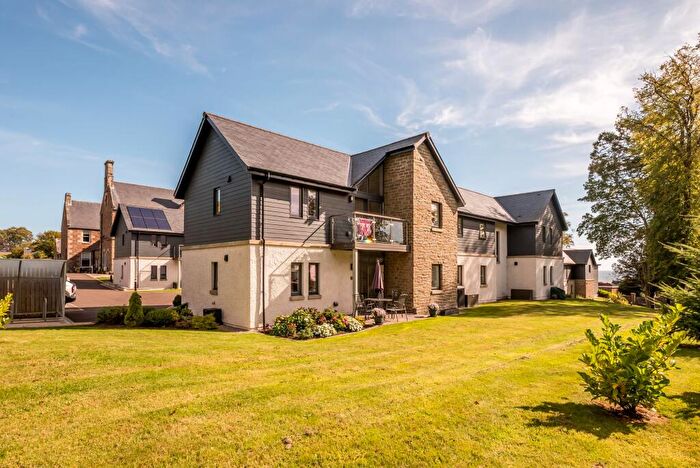
Houses for sale & to rent in Forfar, Angus
House Prices in Forfar
Properties in Forfar have an average house price of £157,910.00 and had 609 Property Transactions within the last 3 years.¹
Forfar is an area in Angus with 12,987 households², where the most expensive property was sold for £495,000.00.
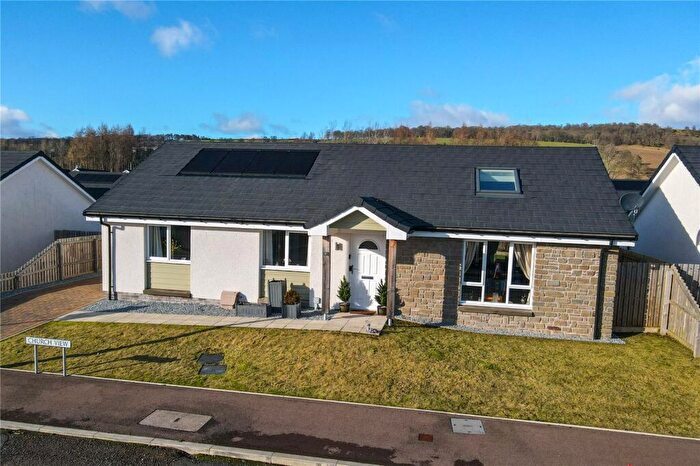
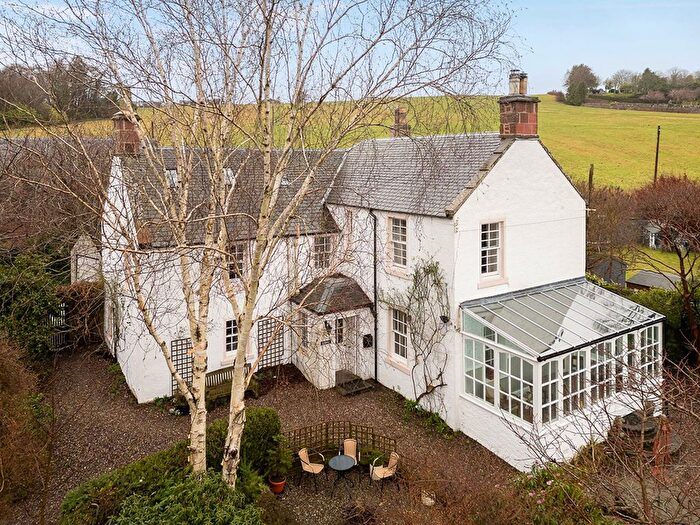
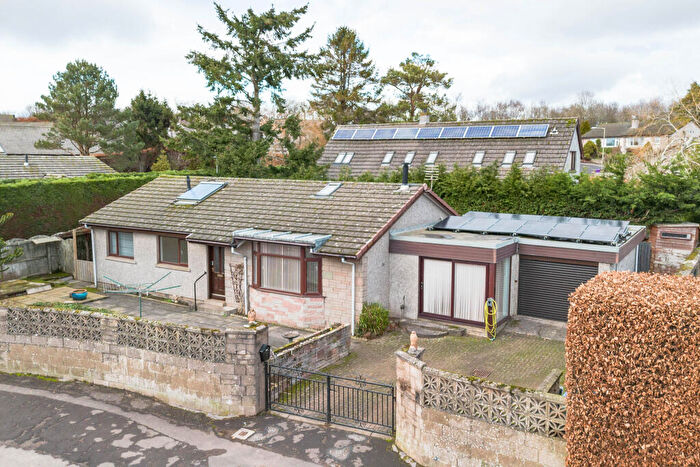
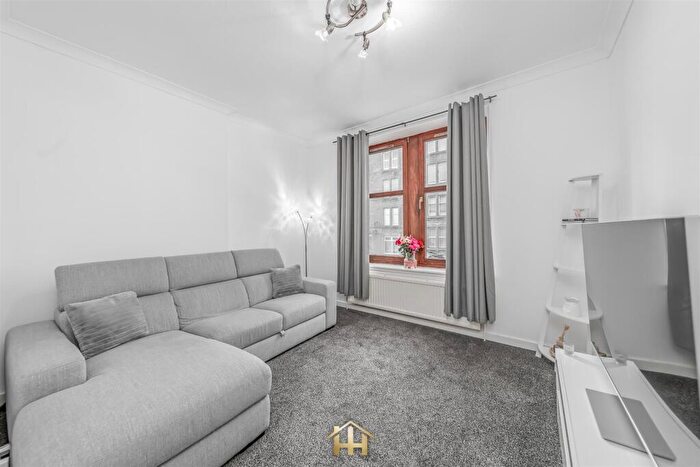
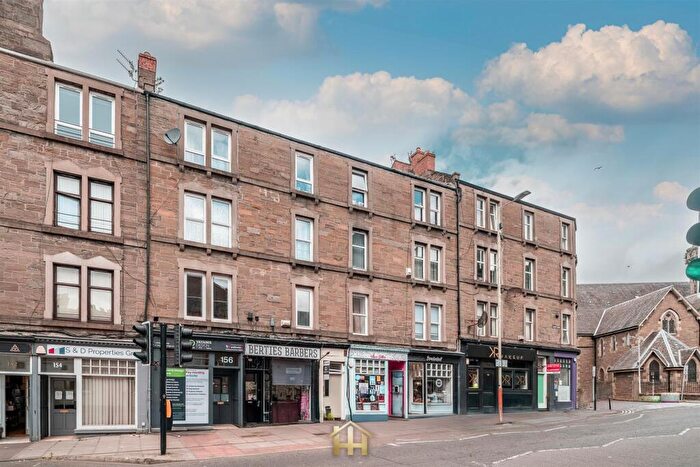
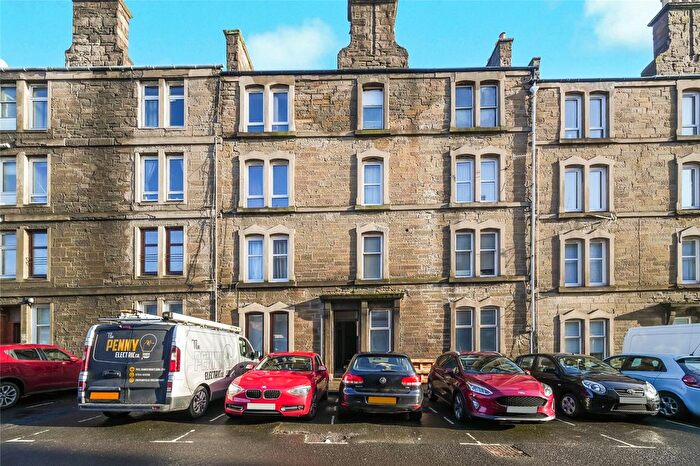
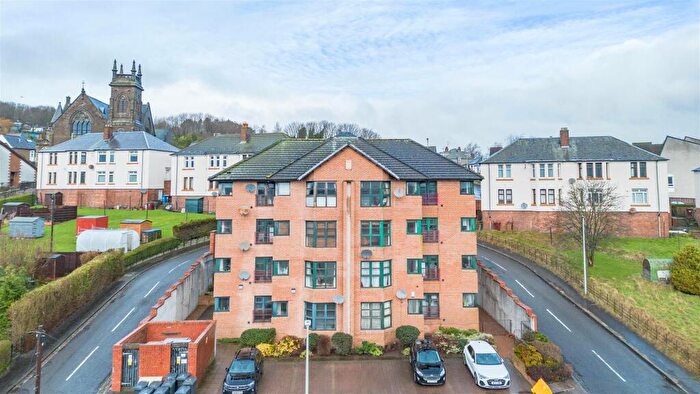
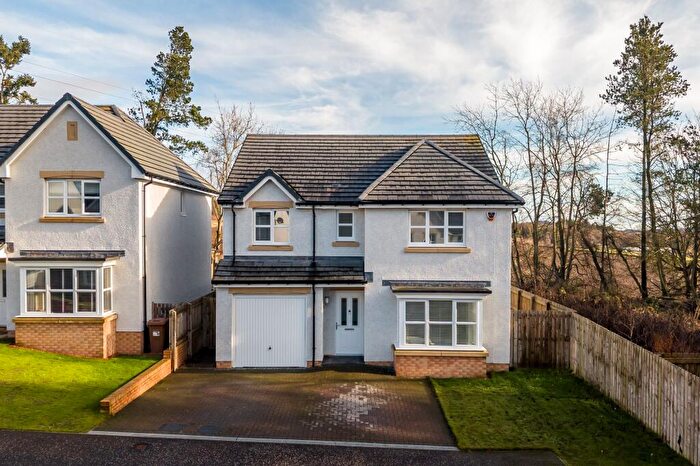
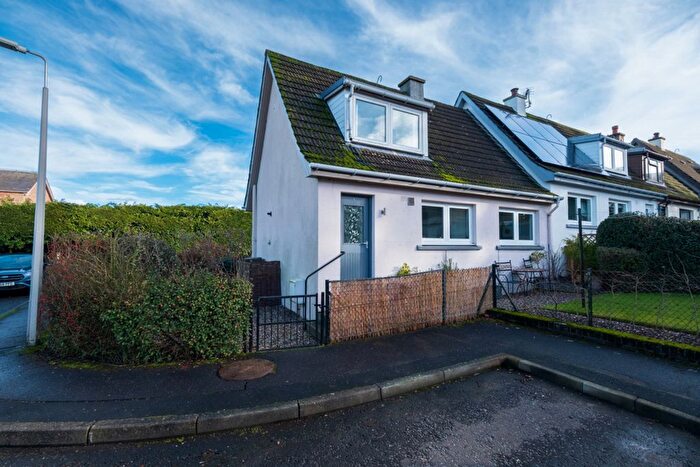
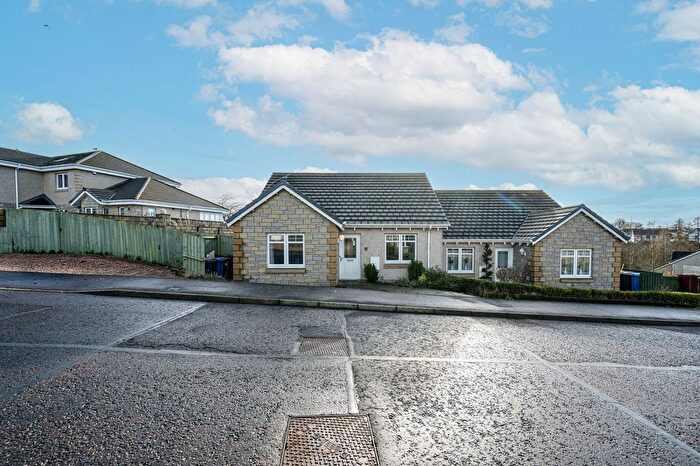
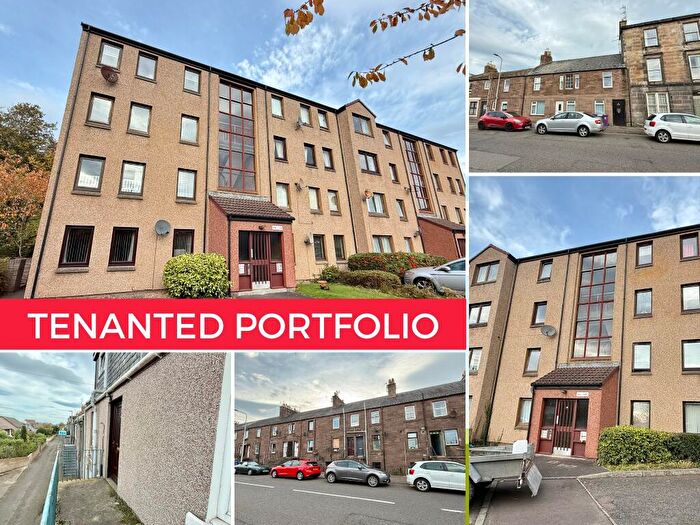
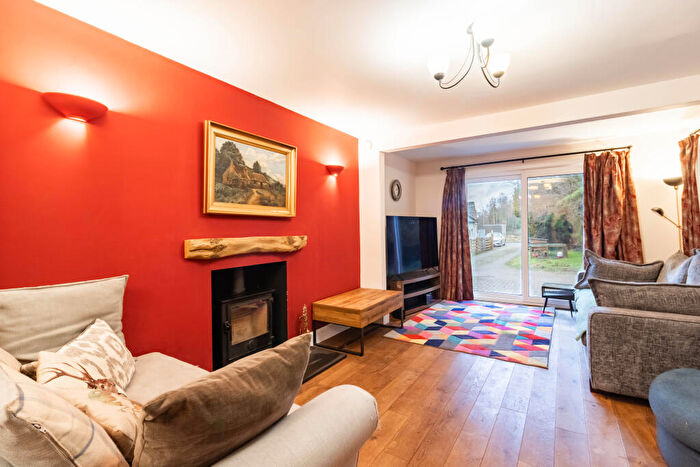
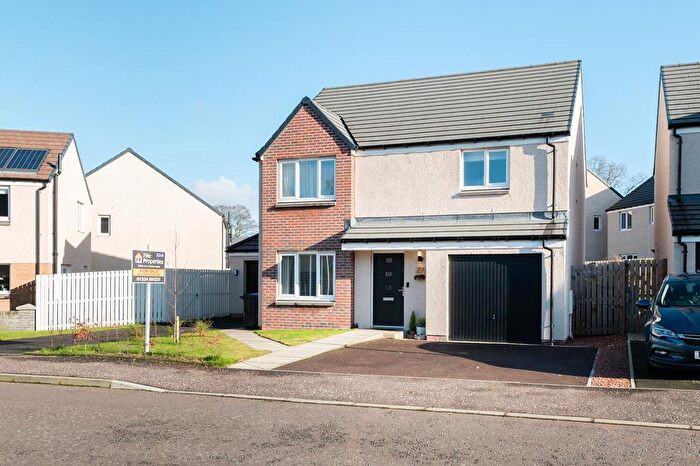
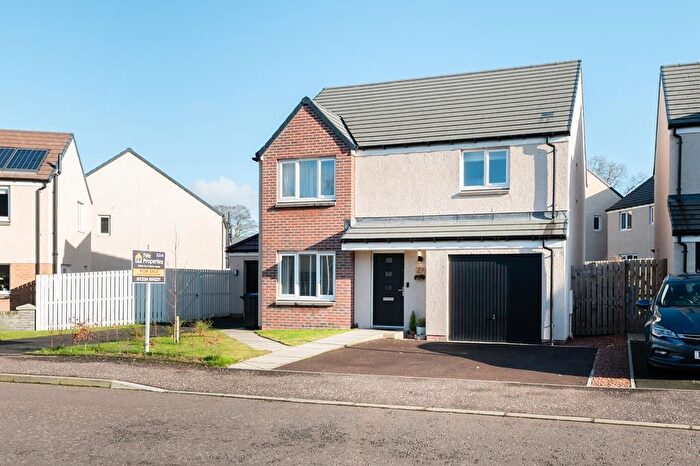
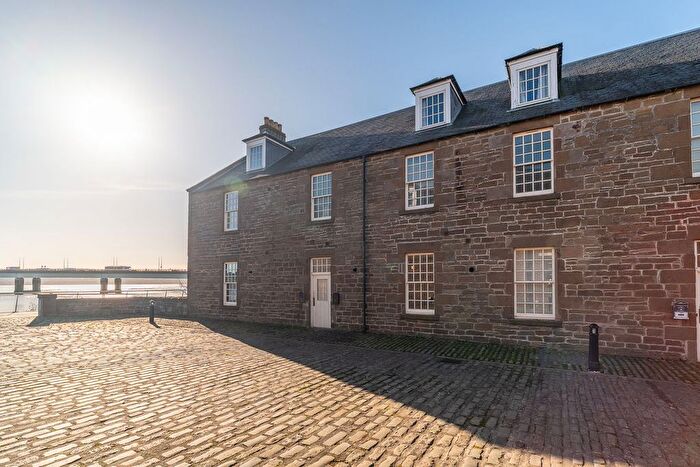
Properties for sale in Forfar
Neighbourhoods in Forfar
Navigate through our locations to find the location of your next house in Forfar, Angus for sale or to rent.
Transport in Forfar
Please see below transportation links in this area:
-
Monifieth Station
-
Balmossie Station
-
Barry Links Station
-
Broughty Ferry Station
-
Golf Street Station
-
Carnoustie Station
-
Dundee Station
-
Arbroath Station
-
Invergowrie Station
- FAQ
- Price Paid By Year
Frequently asked questions about Forfar
What is the average price for a property for sale in Forfar?
The average price for a property for sale in Forfar is £157,910. This amount is 8% lower than the average price in Angus. There are 5,991 property listings for sale in Forfar.
What locations have the most expensive properties for sale in Forfar?
The locations with the most expensive properties for sale in Forfar are Arbroath West, Letham and Friockheim at an average of £230,613 and Brechin and Edzell at an average of £197,222.
What locations have the most affordable properties for sale in Forfar?
The locations with the most affordable properties for sale in Forfar are Forfar and District at an average of £144,360 and Kirriemuir and Dean at an average of £159,819.
Which train stations are available in or near Forfar?
Some of the train stations available in or near Forfar are Monifieth, Balmossie and Barry Links.
Property Price Paid in Forfar by Year
The average sold property price by year was:
| Year | Average Sold Price | Price Change |
Sold Properties
|
|---|---|---|---|
| 2025 | £155,266 | -1% |
163 Properties |
| 2024 | £156,125 | -3% |
196 Properties |
| 2023 | £161,033 | -14% |
250 Properties |
| 2022 | £183,184 | 1% |
528 Properties |
| 2021 | £181,913 | 6% |
666 Properties |
| 2020 | £170,464 | 6% |
468 Properties |
| 2019 | £160,363 | 7% |
425 Properties |
| 2018 | £148,996 | - |
413 Properties |
| 2017 | £148,986 | -3% |
441 Properties |
| 2016 | £152,847 | -0,4% |
541 Properties |
| 2015 | £153,490 | -2% |
528 Properties |
| 2014 | £156,458 | 12% |
488 Properties |
| 2013 | £137,139 | -12% |
413 Properties |
| 2012 | £153,942 | 8% |
364 Properties |
| 2011 | £141,377 | -19% |
284 Properties |
| 2010 | £168,024 | 16% |
353 Properties |
| 2009 | £141,552 | -4% |
369 Properties |
| 2008 | £146,787 | 9% |
441 Properties |
| 2007 | £133,410 | 4% |
580 Properties |
| 2006 | £128,520 | 23% |
602 Properties |
| 2005 | £98,916 | 15% |
600 Properties |
| 2004 | £84,472 | 4% |
658 Properties |
| 2003 | £80,871 | 17% |
664 Properties |
| 2002 | £67,032 | -6% |
741 Properties |
| 2001 | £70,863 | - |
52 Properties |

