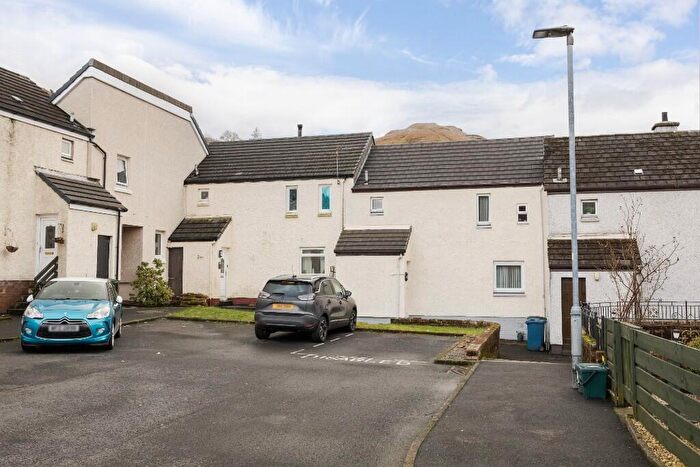
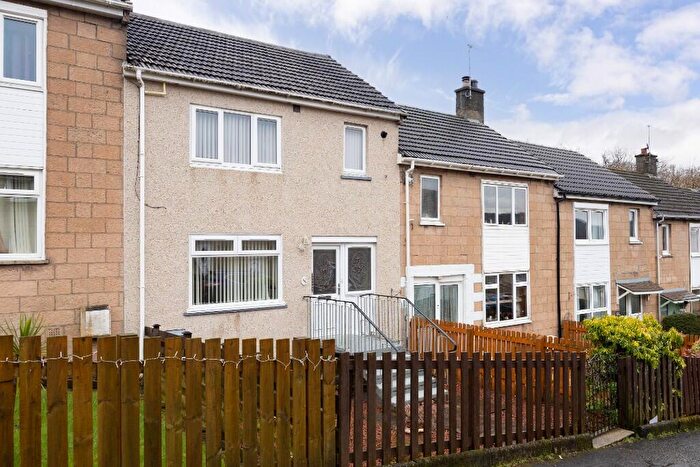
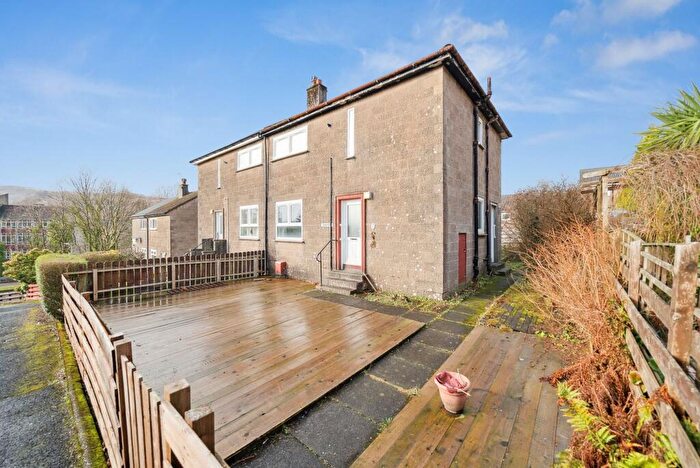
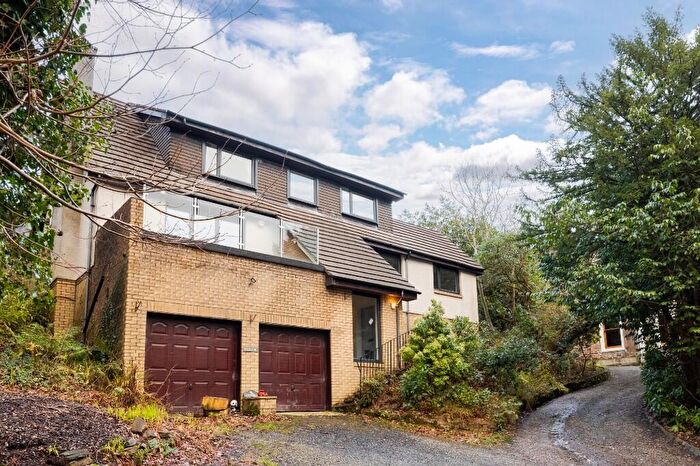
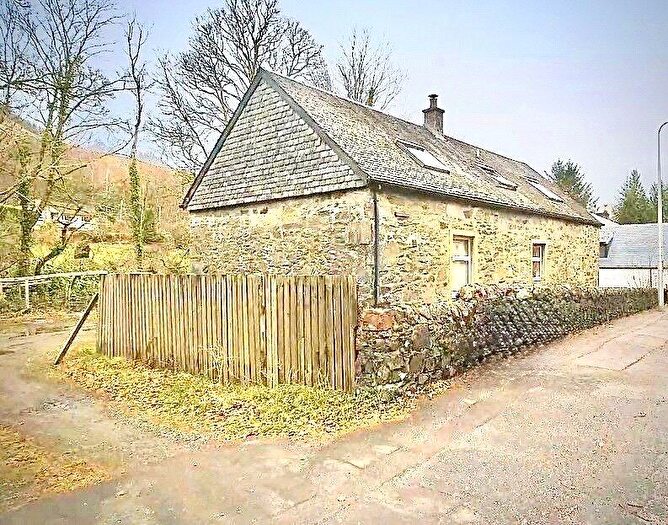
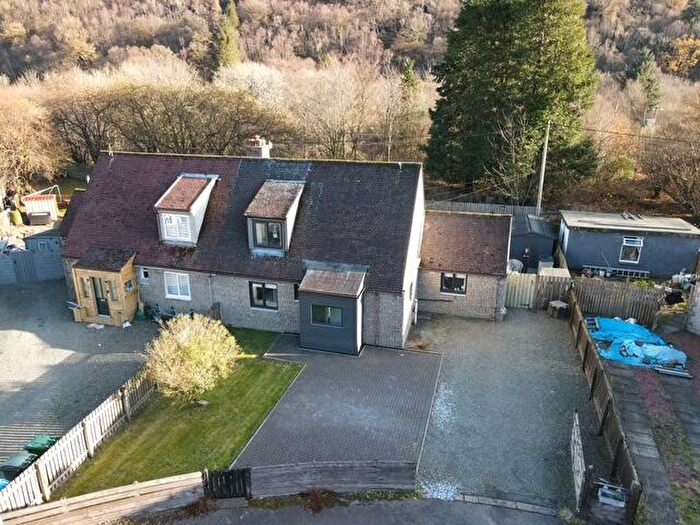
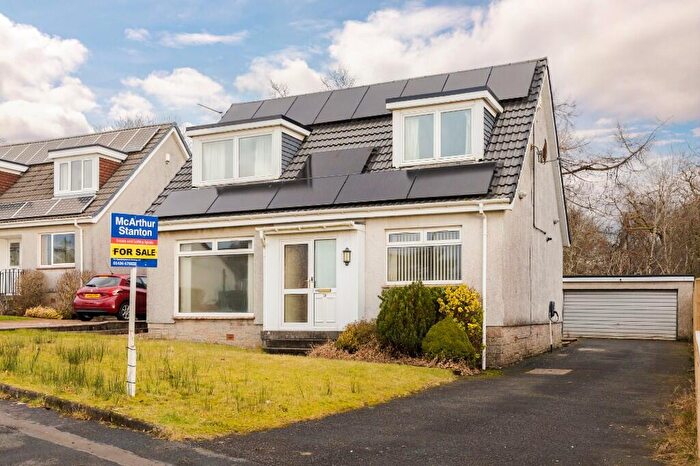
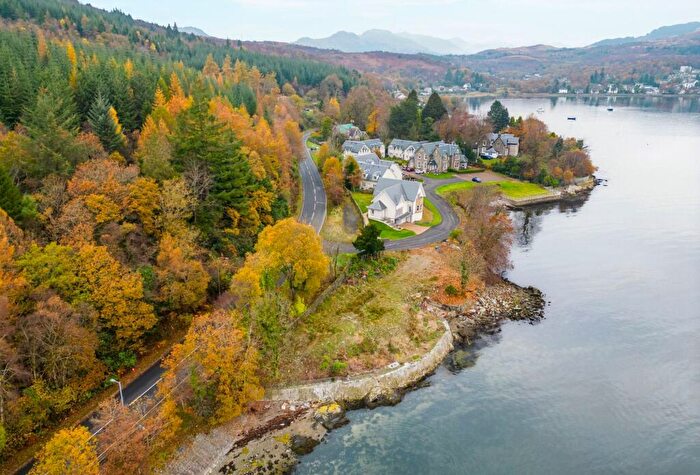
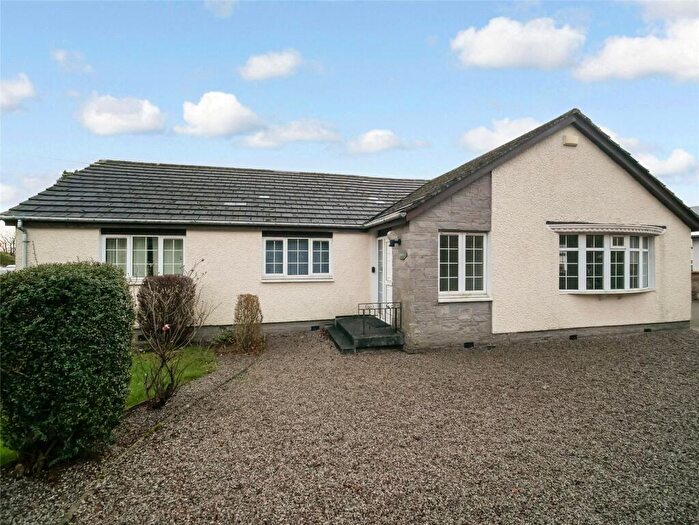
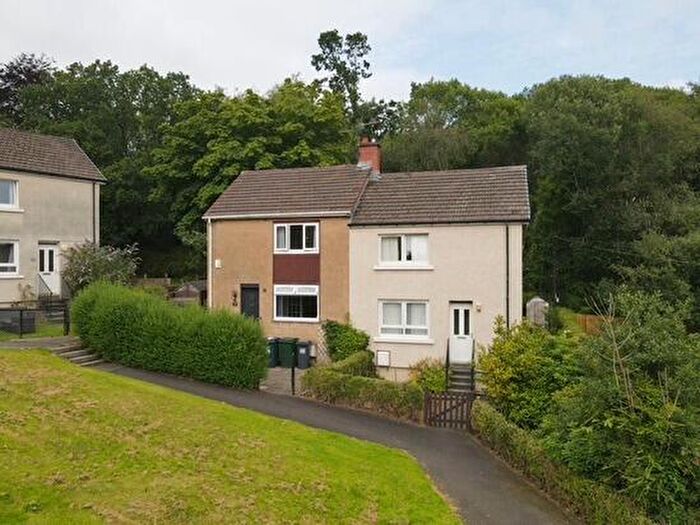
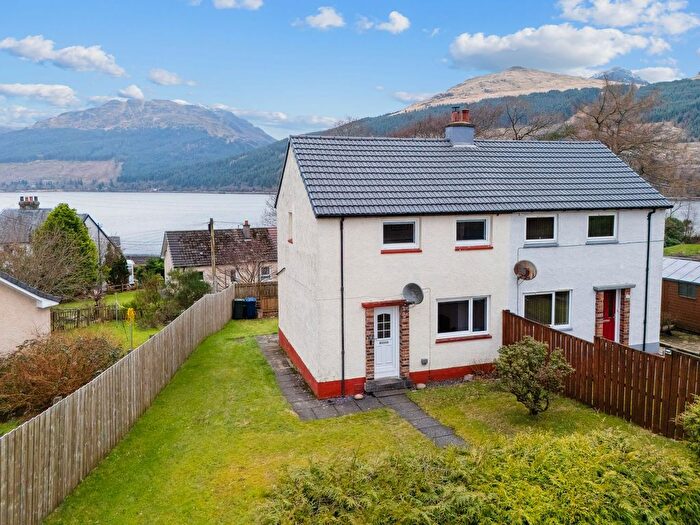
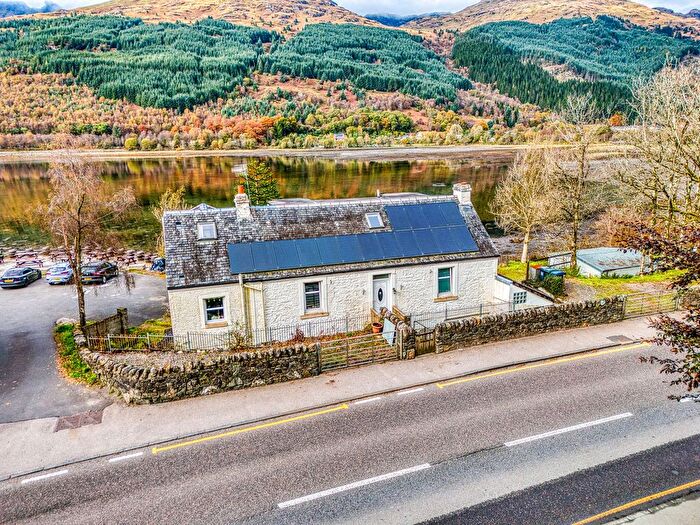
Houses for sale & to rent in Lomond North, Alexandria
House Prices in Lomond North
Properties in Lomond North have an average house price of £213,312.00 and had 16 Property Transactions within the last 3 years¹.
Lomond North is an area in Alexandria, Argyll and Bute with 475 households², where the most expensive property was sold for £300,000.00.
Properties for sale in Lomond North
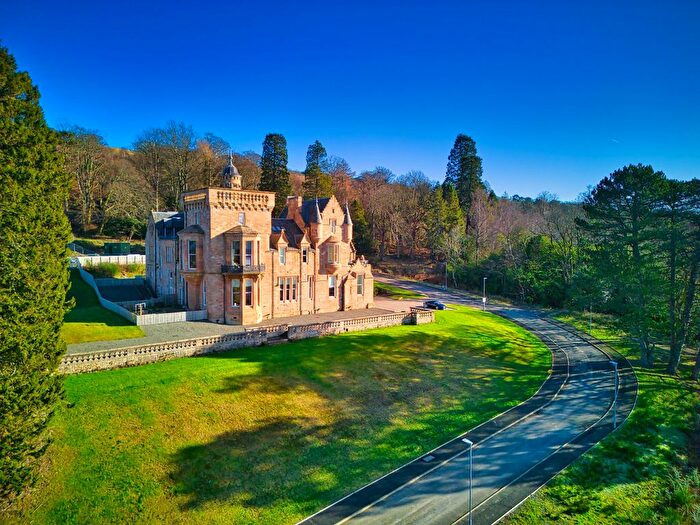
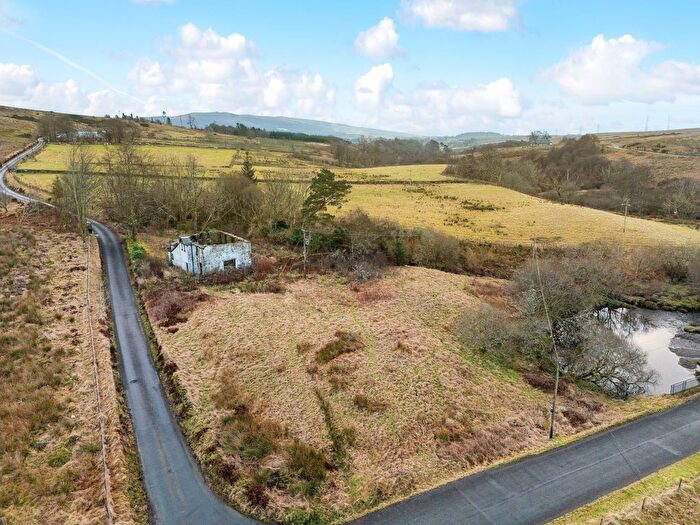
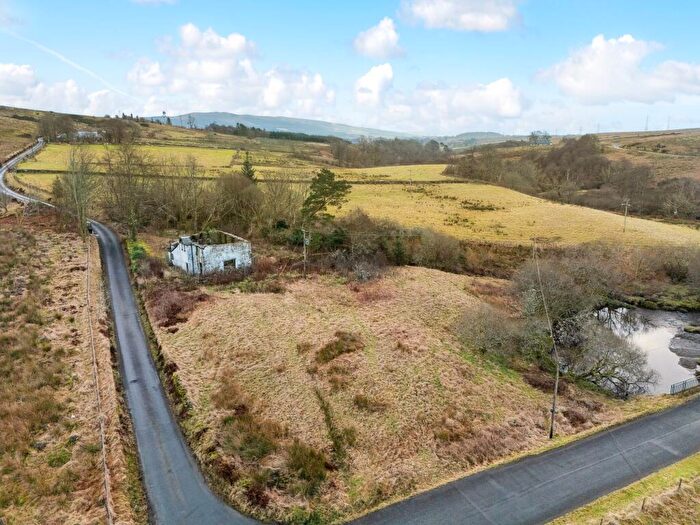
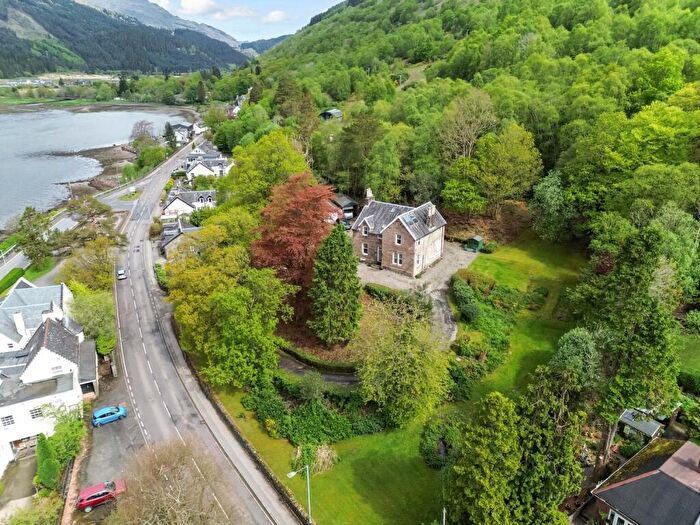
Previously listed properties in Lomond North
Roads and Postcodes in Lomond North
Navigate through our locations to find the location of your next house in Lomond North, Alexandria for sale or to rent.
| Streets | Postcodes |
|---|---|
| Church Road | G83 7BE |
| Admiralty Cottages | G83 7AQ |
| Ballyhennan Crescent | G83 7DB |
| Beinn Dubh View | G83 8FB |
| Bemersyde Road | G83 7DF |
| Cobbler View | G83 7AD |
| Forestry Houses | G83 7AW |
| Glen Douglas Road | G83 7AZ |
| Glen Loin Crescent | G83 7AN |
| Glenburn Court | G83 8TU |
| Kirkfield Place | G83 7AE |
| Macfarlane Place | G83 7BG |
| Mackenzie Avenue | G83 7AF |
| Mcfarlane Drive | G83 7BD |
| Murray Place | G83 8PG |
| The Orchard | G83 7AY |
| G83 7AA G83 7AB G83 7AG G83 7AH G83 7AJ G83 7AL G83 7AP G83 7AR G83 7AS G83 7AU G83 7AX G83 7BB G83 7BF G83 7DA G83 7DD G83 7DE G83 7DG G83 7DH G83 7DL G83 7DN G83 7DP G83 7DQ G83 7DS G83 7DT G83 7DW G83 7EB G83 7ED G83 8NN G83 8NT G83 8NU G83 8NX G83 8NY G83 8NZ G83 8PA G83 8PB G83 8PD G83 8PF G83 8RH |
Transport near Lomond North
- FAQ
- Price Paid By Year
Frequently asked questions about Lomond North
What is the average price for a property for sale in Lomond North?
The average price for a property for sale in Lomond North is £213,312. This amount is 0.28% higher than the average price in Alexandria. There are 675 property listings for sale in Lomond North.
What streets have the most expensive properties for sale in Lomond North?
The streets with the most expensive properties for sale in Lomond North are Murray Place at an average of £237,500, Bemersyde Road at an average of £233,000 and Glen Loin Crescent at an average of £191,000.
What streets have the most affordable properties for sale in Lomond North?
The streets with the most affordable properties for sale in Lomond North are Kirkfield Place at an average of £120,500 and Cobbler View at an average of £188,500.
Which train stations are available in or near Lomond North?
Some of the train stations available in or near Lomond North are Arrochar and Tarbet, Ardlui and Garelochhead.
Property Price Paid in Lomond North by Year
The average sold property price by year was:
| Year | Average Sold Price | Price Change |
Sold Properties
|
|---|---|---|---|
| 2025 | £165,250 | -42% |
4 Properties |
| 2024 | £234,000 | 3% |
5 Properties |
| 2023 | £226,000 | -28% |
7 Properties |
| 2022 | £290,255 | 10% |
26 Properties |
| 2021 | £260,159 | 33% |
22 Properties |
| 2020 | £173,118 | -79% |
19 Properties |
| 2019 | £309,100 | 34% |
15 Properties |
| 2018 | £202,916 | 8% |
24 Properties |
| 2017 | £187,125 | -116% |
24 Properties |
| 2016 | £403,620 | 56% |
11 Properties |
| 2015 | £178,245 | -25% |
26 Properties |
| 2014 | £223,005 | 23% |
15 Properties |
| 2013 | £172,211 | 4% |
18 Properties |
| 2012 | £164,537 | -64% |
18 Properties |
| 2011 | £269,306 | -5% |
15 Properties |
| 2010 | £283,531 | 55% |
16 Properties |
| 2009 | £127,828 | -21% |
16 Properties |
| 2008 | £155,200 | -52% |
21 Properties |
| 2007 | £236,270 | 13% |
27 Properties |
| 2006 | £205,294 | 44% |
32 Properties |
| 2005 | £113,955 | -29% |
42 Properties |
| 2004 | £146,742 | 43% |
20 Properties |
| 2003 | £83,894 | -39% |
19 Properties |
| 2002 | £116,640 | 70% |
36 Properties |
| 2001 | £34,500 | - |
2 Properties |

