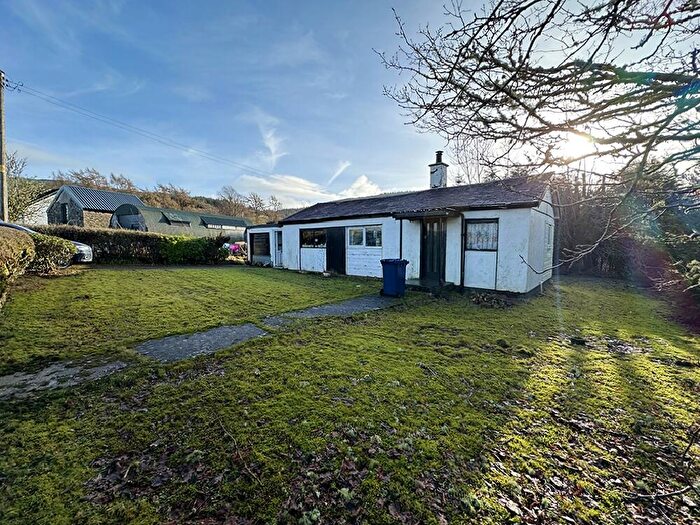
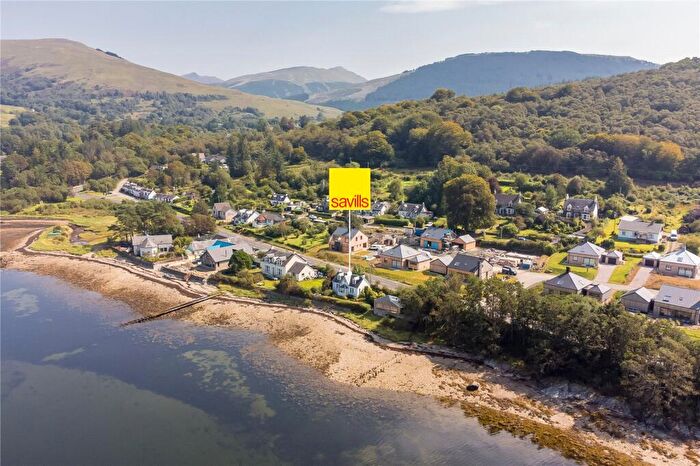
Houses for sale & to rent in Cowal, Cairndow
House Prices in Cowal
Properties in Cowal have an average house price of £243,833.00 and had 21 Property Transactions within the last 3 years¹.
Cowal is an area in Cairndow, Argyll and Bute with 639 households², where the most expensive property was sold for £499,000.00.
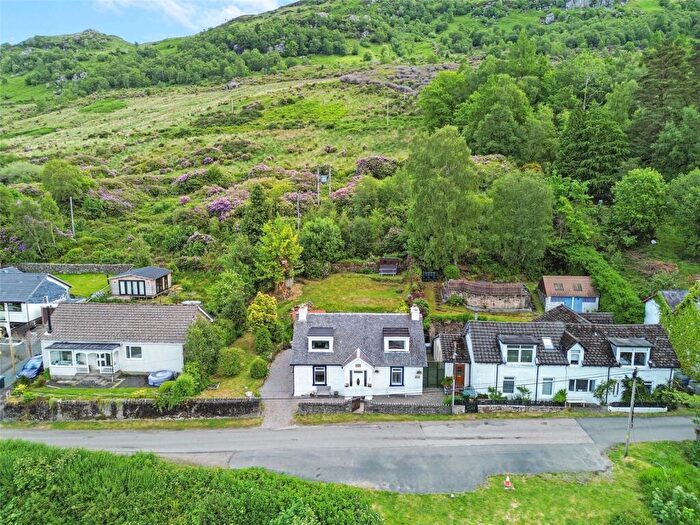
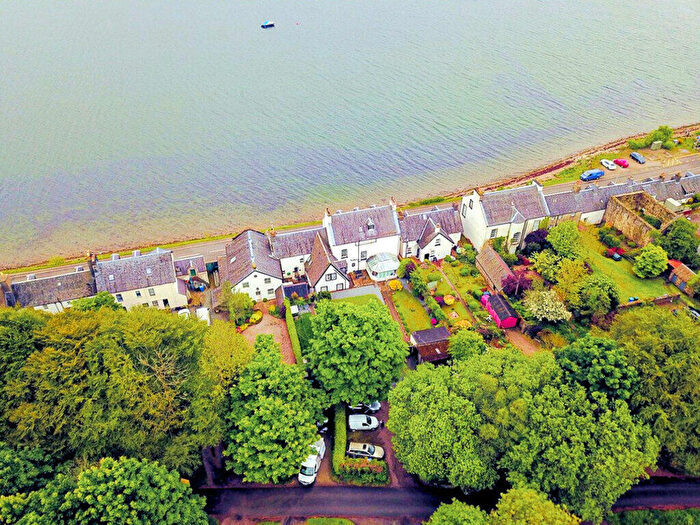
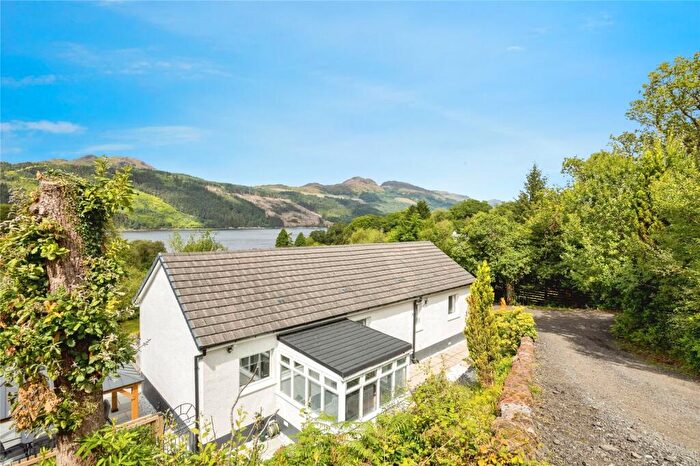
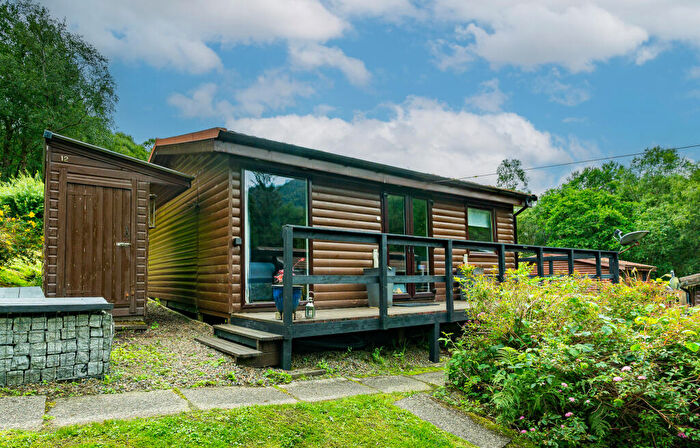
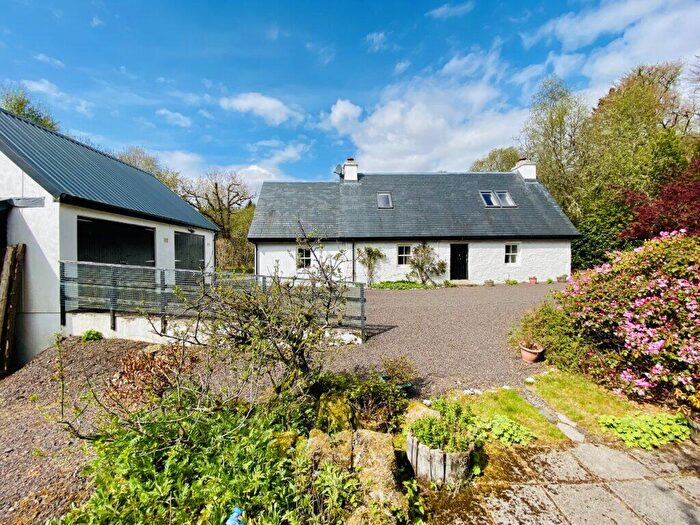
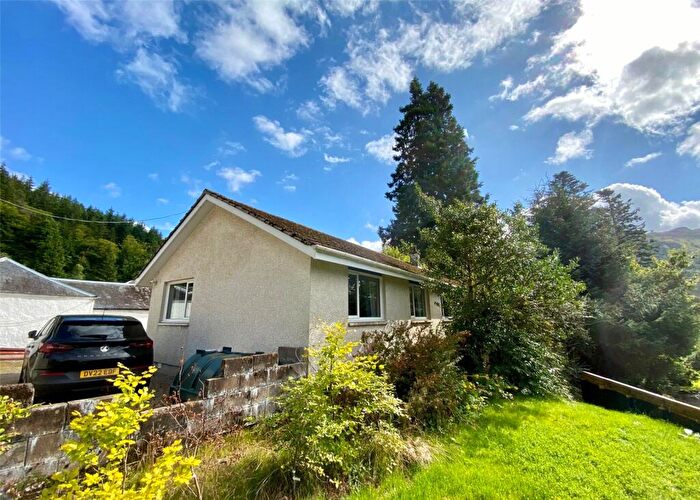
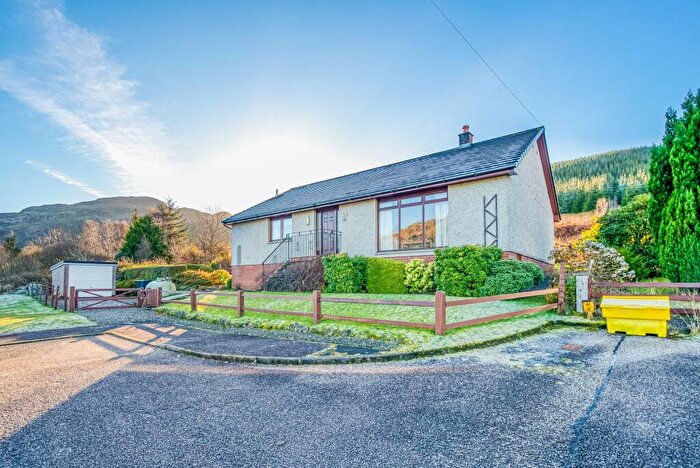
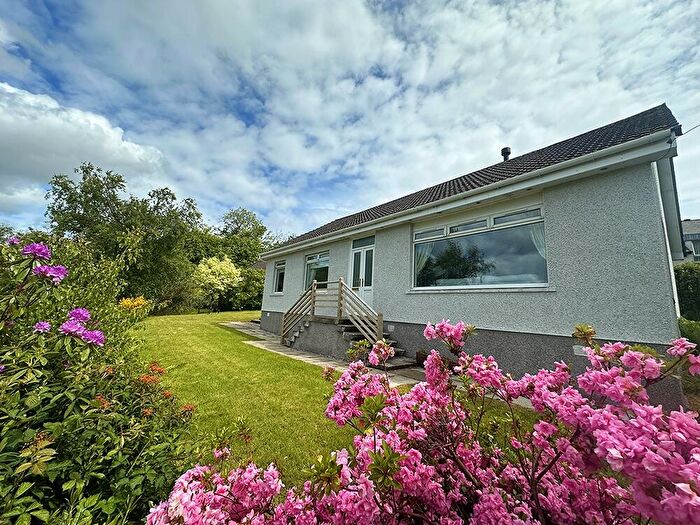
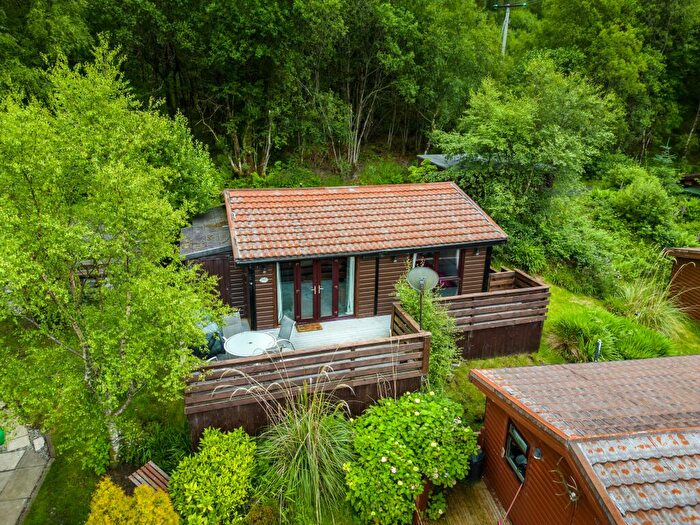
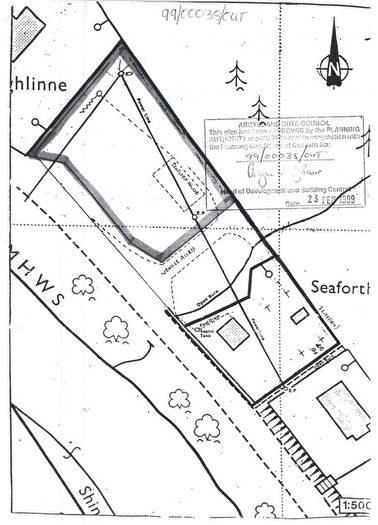
Properties for sale in Cowal
Previously listed properties in Cowal
Roads and Postcodes in Cowal
Navigate through our locations to find the location of your next house in Cowal, Cairndow for sale or to rent.
| Streets | Postcodes |
|---|---|
| Baycrofts | PA27 8BW |
| Birlinn Brae | PA27 8DT |
| Carrick Castle | PA24 8AF PA24 8AG PA24 8AS |
| Cobbler View | PA24 8AR |
| Donich Park | PA24 8AB |
| Donich View | PA24 8AP |
| Forest View | PA27 8DQ |
| Highland Drive | PA24 8AU |
| Letters Way | PA27 8DP |
| Manse Gardens | PA27 8DS |
| Manson View | PA26 8AB |
| March Brae | PA27 8BA |
| Montgomery Place | PA27 8DR |
| PA24 8AA PA24 8AD PA24 8AE PA24 8AH PA24 8AJ PA24 8AL PA24 8AN PA24 8AQ PA25 8AZ PA25 8BA PA25 8BB PA26 8BA PA26 8BE PA26 8BG PA26 8BH PA26 8BJ PA26 8BL PA26 8BN PA26 8BQ PA27 8AD PA27 8BU PA27 8BX PA27 8BY PA27 8BZ PA27 8DA PA27 8DB PA27 8DD PA27 8DE PA27 8DF PA27 8DG PA27 8DH PA27 8DJ PA27 8DL PA27 8DN PA27 8DW |
Transport near Cowal
- FAQ
- Price Paid By Year
Frequently asked questions about Cowal
What is the average price for a property for sale in Cowal?
The average price for a property for sale in Cowal is £243,833. There are 1,283 property listings for sale in Cowal.
What streets have the most expensive properties for sale in Cowal?
The streets with the most expensive properties for sale in Cowal are Carrick Castle at an average of £425,750 and Forest View at an average of £139,333.
What streets have the most affordable properties for sale in Cowal?
The street with the most affordable properties for sale in Cowal is Donich Park at an average of £127,000.
Which train stations are available in or near Cowal?
Some of the train stations available in or near Cowal are Garelochhead, Arrochar and Tarbet and Ardlui.
Property Price Paid in Cowal by Year
The average sold property price by year was:
| Year | Average Sold Price | Price Change |
Sold Properties
|
|---|---|---|---|
| 2025 | £254,500 | 0,3% |
4 Properties |
| 2024 | £253,700 | 7% |
5 Properties |
| 2023 | £236,166 | -21% |
12 Properties |
| 2022 | £284,785 | 14% |
28 Properties |
| 2021 | £243,602 | 21% |
42 Properties |
| 2020 | £191,477 | -10% |
31 Properties |
| 2019 | £210,225 | 17% |
46 Properties |
| 2018 | £174,128 | 6% |
30 Properties |
| 2017 | £163,577 | -13% |
35 Properties |
| 2016 | £185,498 | 17% |
36 Properties |
| 2015 | £153,948 | -5% |
34 Properties |
| 2014 | £161,684 | 2% |
28 Properties |
| 2013 | £158,980 | -19% |
23 Properties |
| 2012 | £188,576 | 18% |
24 Properties |
| 2011 | £155,009 | -32% |
16 Properties |
| 2010 | £205,184 | 21% |
21 Properties |
| 2009 | £161,763 | -46% |
22 Properties |
| 2008 | £236,672 | 29% |
25 Properties |
| 2007 | £167,189 | 10% |
33 Properties |
| 2006 | £150,820 | -2% |
39 Properties |
| 2005 | £153,760 | 13% |
47 Properties |
| 2004 | £134,370 | 31% |
46 Properties |
| 2003 | £92,865 | 2% |
48 Properties |
| 2002 | £90,582 | 80% |
35 Properties |
| 2001 | £18,000 | - |
1 Property |

