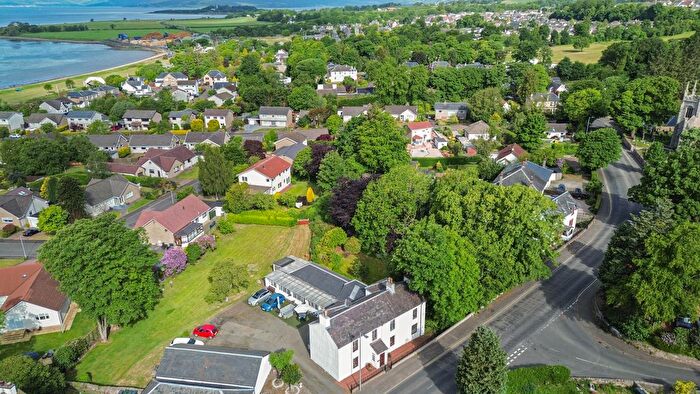
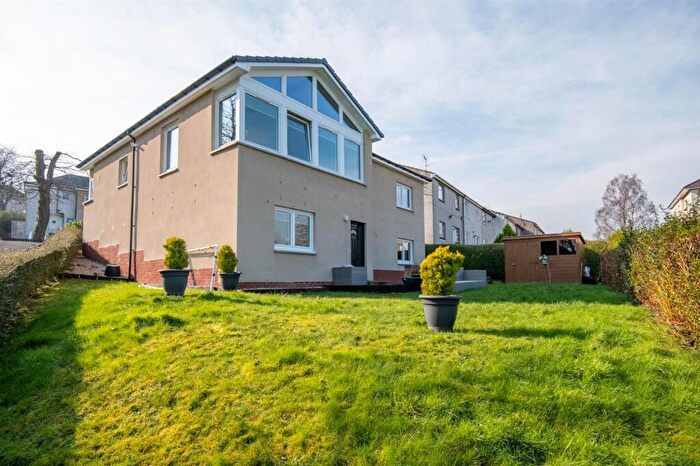
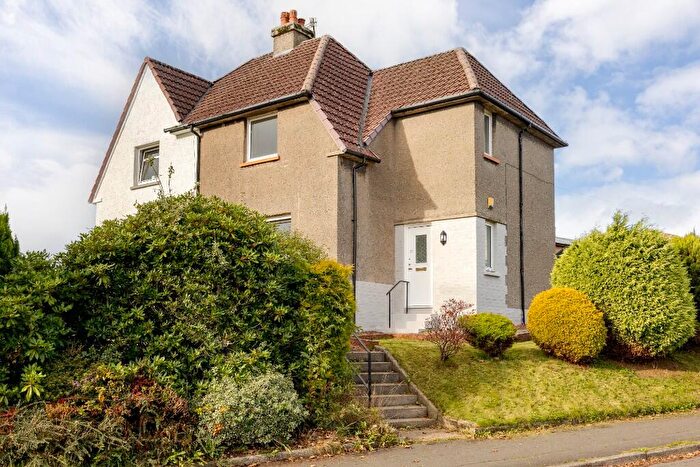
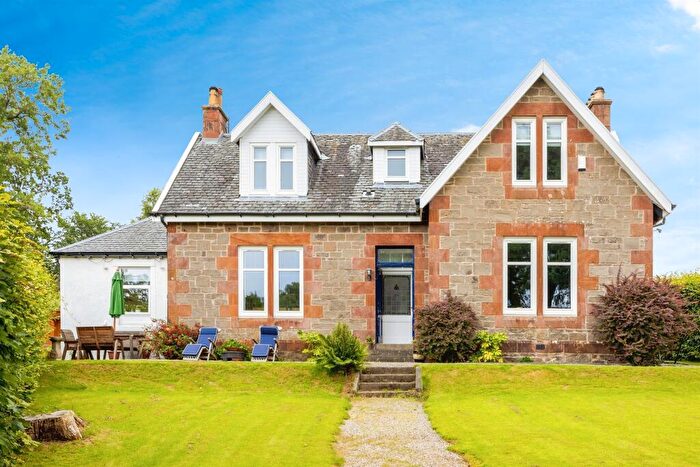
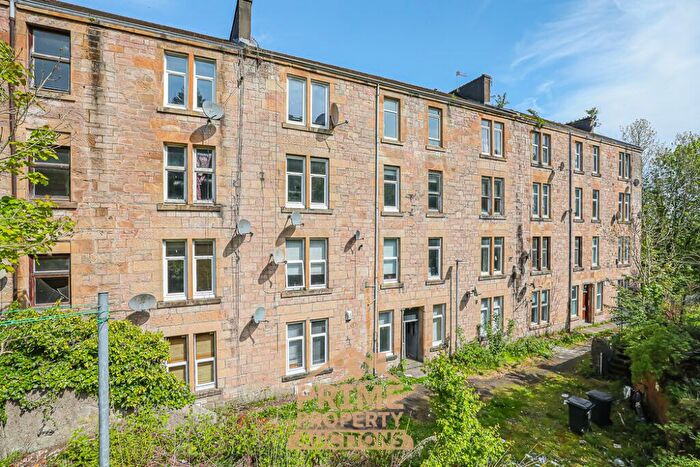
Houses for sale & to rent in Helensburgh and Lomond South, Dumbarton
House Prices in Helensburgh and Lomond South
Properties in Helensburgh and Lomond South have an average house price of £260,387.00 and had 54 Property Transactions within the last 3 years¹.
Helensburgh and Lomond South is an area in Dumbarton, Argyll and Bute with 1,079 households², where the most expensive property was sold for £602,100.00.
Properties for sale in Helensburgh and Lomond South
Previously listed properties in Helensburgh and Lomond South
Roads and Postcodes in Helensburgh and Lomond South
Navigate through our locations to find the location of your next house in Helensburgh and Lomond South, Dumbarton for sale or to rent.
| Streets | Postcodes |
|---|---|
| Bainfield Road | G82 5JQ |
| Barrs Court | G82 5PP |
| Barrs Crescent | G82 5PB |
| Barrs Road | G82 5PR G82 5PS G82 5PT G82 5PW |
| Barrs Terrace | G82 5PE G82 5PF |
| Braid Avenue | G82 5QF |
| Braid Drive | G82 5QD |
| Bruce Court | G82 5QN |
| Burnfoot | G82 5NB |
| Cardross Park Mansion | G82 5QH |
| Cardross Shore | G82 5NR |
| Carman Road | G82 5ER G82 5JZ G82 5LA |
| Cedar Grove | G82 5JW |
| Church Avenue | G82 5NS |
| Colgrain Steading | G82 5JL |
| Darleith Road | G82 5EZ G82 5PG |
| Dick Quadrant | G82 5PZ |
| Fairway | G82 5LP |
| Fernie Gardens | G82 5QJ |
| Ferry Road | G82 5JU |
| Geilston Court | G82 5QE |
| Geilston Park | G82 5ND |
| Graham Crescent | G82 5JH |
| Hillside Road | G82 5LH G82 5LR G82 5LS G82 5LU G82 5LW G82 5LX |
| Hope Terrace | G82 5NZ |
| Kilmahew Avenue | G82 5NG |
| Kilmahew Court | G82 5NJ |
| Kilmahew Drive | G82 5NA |
| Kilmahew Grove | G82 5QL |
| Kirkton Crescent | G82 5PH |
| Kirkton Road | G82 5PJ G82 5PL G82 5PN |
| Main Road | G82 5BT G82 5JX G82 5JY G82 5LB G82 5LE G82 5NY G82 5PA G82 5PD G82 5PU G82 5PX G82 5PY |
| Mill Road | G82 5PQ |
| Mitchell Drive | G82 5JJ |
| Muirend Road | G82 5LF G82 5LG G82 5LQ |
| Napier Avenue | G82 5LY |
| Napier Court | G82 5HW |
| Park Grove | G82 5QG |
| Park Terrace | G82 5QA G82 5QB |
| Peel Street | G82 5LD |
| Reay Avenue | G82 5NT |
| Ritchie Avenue | G82 5LJ G82 5LL G82 5LN |
| Riverview Crescent | G82 5LT |
| Scott Gardens | G82 5BU |
| Smithy Road | G82 5NU |
| Station Road | G82 5NL G82 5NW |
| G82 5EP G82 5ES G82 5ET G82 5EW G82 5EY G82 5HB G82 5HD G82 5HE G82 5HF G82 5HG G82 5HH G82 5HL G82 5HN G82 5HQ G82 5NP |
Transport near Helensburgh and Lomond South
-
Cardross Station
-
Woodhall Station
-
Port Glasgow Station
-
Renton Station
-
Bogston Station
-
Craigendoran Station
- FAQ
- Price Paid By Year
Frequently asked questions about Helensburgh and Lomond South
What is the average price for a property for sale in Helensburgh and Lomond South?
The average price for a property for sale in Helensburgh and Lomond South is £260,387. There are 395 property listings for sale in Helensburgh and Lomond South.
Which train stations are available in or near Helensburgh and Lomond South?
Some of the train stations available in or near Helensburgh and Lomond South are Cardross, Woodhall and Port Glasgow.
Property Price Paid in Helensburgh and Lomond South by Year
The average sold property price by year was:
| Year | Average Sold Price | Price Change |
Sold Properties
|
|---|---|---|---|
| 2023 | £259,621 | -0,4% |
9 Properties |
| 2022 | £260,541 | 11% |
45 Properties |
| 2021 | £233,108 | 14% |
63 Properties |
| 2020 | £201,433 | -12% |
41 Properties |
| 2019 | £225,192 | -3% |
46 Properties |
| 2018 | £231,006 | 25% |
38 Properties |
| 2017 | £172,853 | -14% |
54 Properties |
| 2016 | £196,369 | -16% |
58 Properties |
| 2015 | £228,638 | 15% |
33 Properties |
| 2014 | £194,434 | 2% |
53 Properties |
| 2013 | £190,676 | 1% |
41 Properties |
| 2012 | £188,753 | -26% |
30 Properties |
| 2011 | £236,942 | 26% |
35 Properties |
| 2010 | £174,950 | -3% |
45 Properties |
| 2009 | £180,047 | -4% |
39 Properties |
| 2008 | £187,834 | -27% |
36 Properties |
| 2007 | £238,114 | 21% |
40 Properties |
| 2006 | £188,087 | 16% |
53 Properties |
| 2005 | £158,718 | -13% |
93 Properties |
| 2004 | £180,115 | 14% |
93 Properties |
| 2003 | £155,708 | 43% |
77 Properties |
| 2002 | £89,012 | -3% |
63 Properties |
| 2001 | £91,392 | - |
2 Properties |

