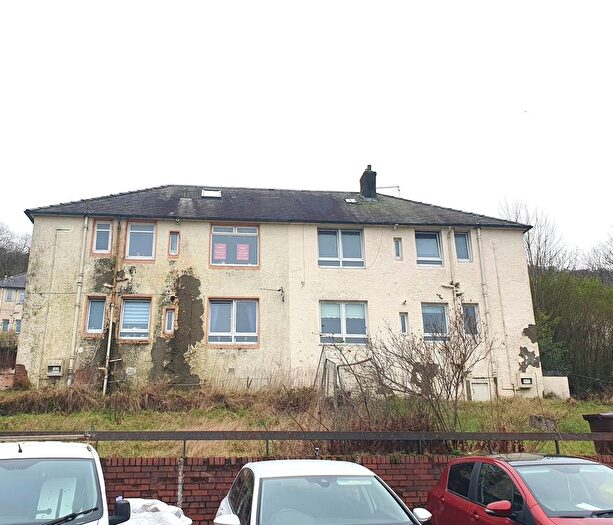
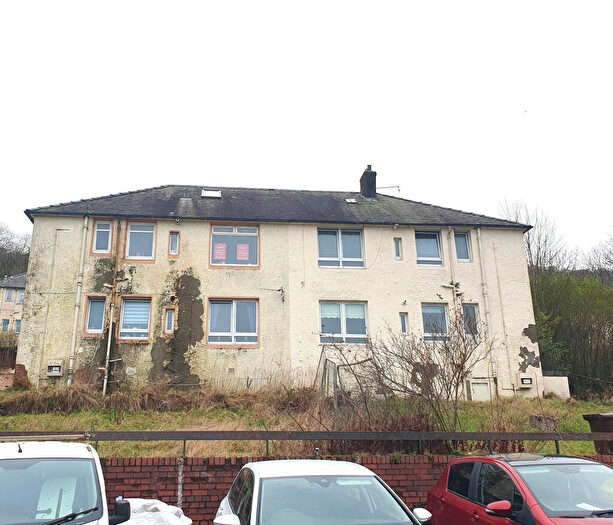
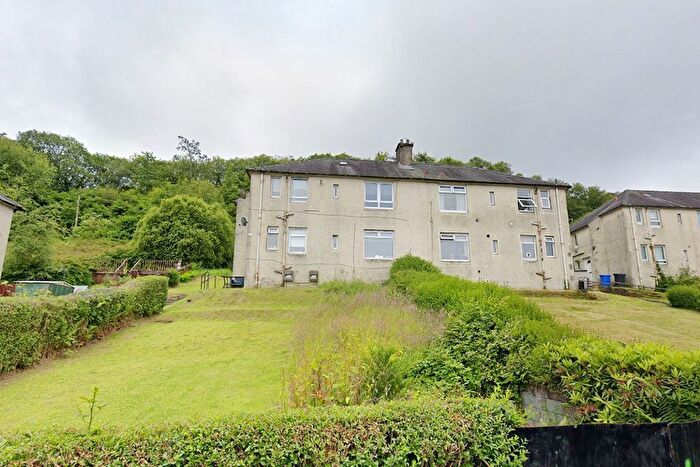
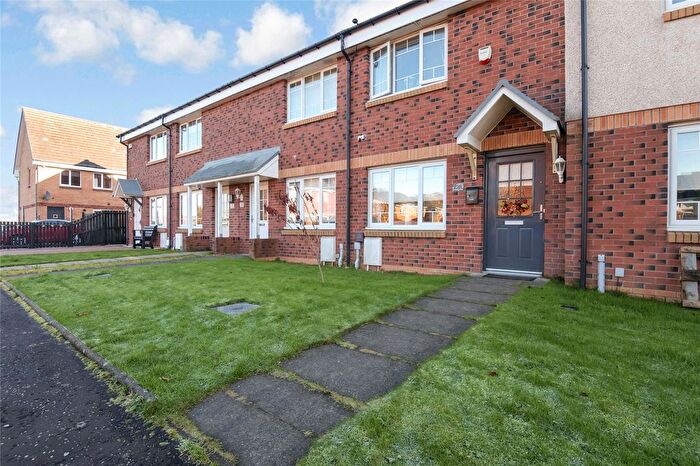
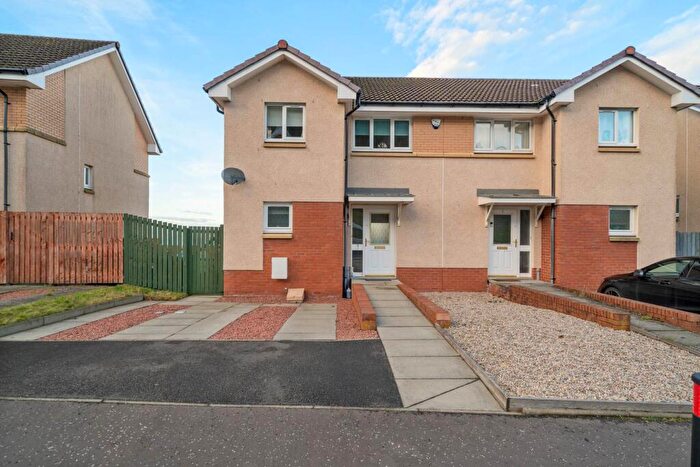
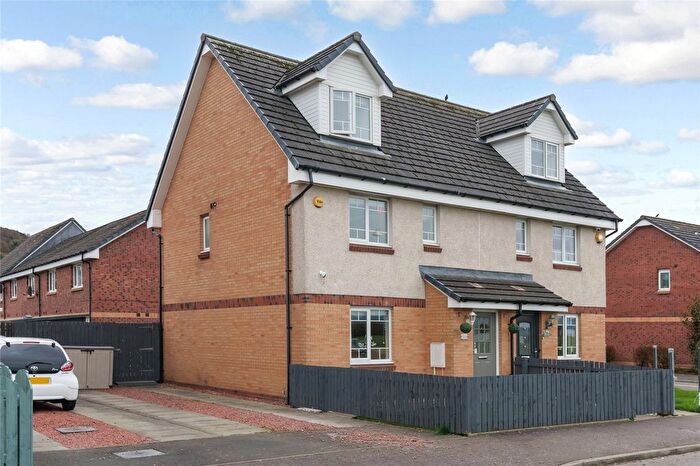
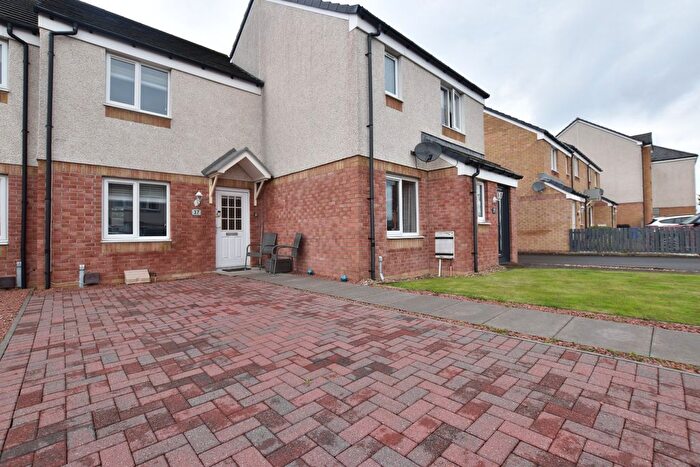
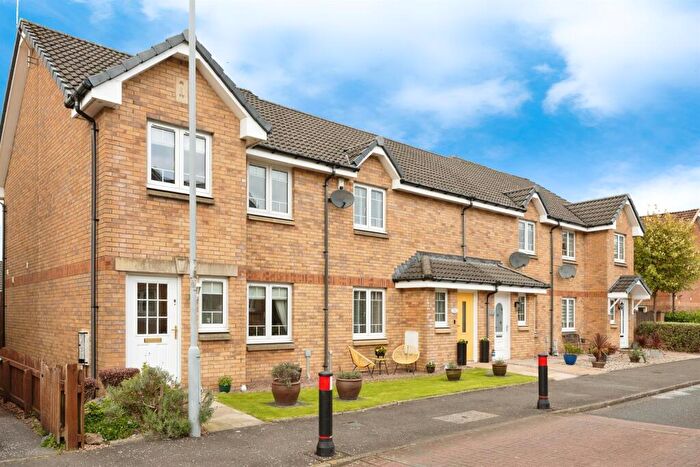
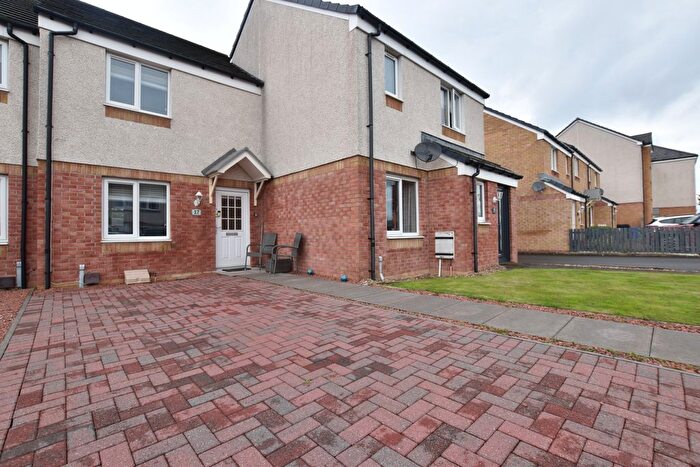
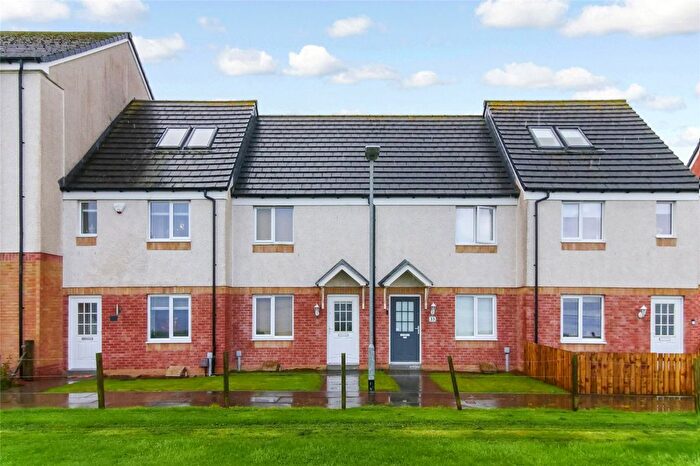
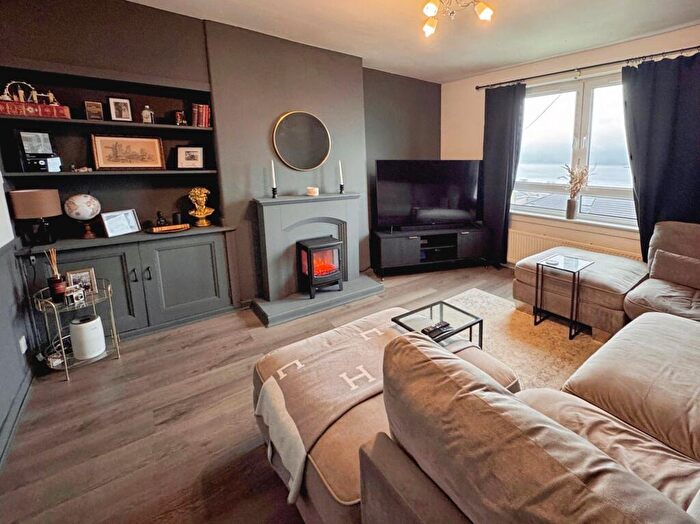
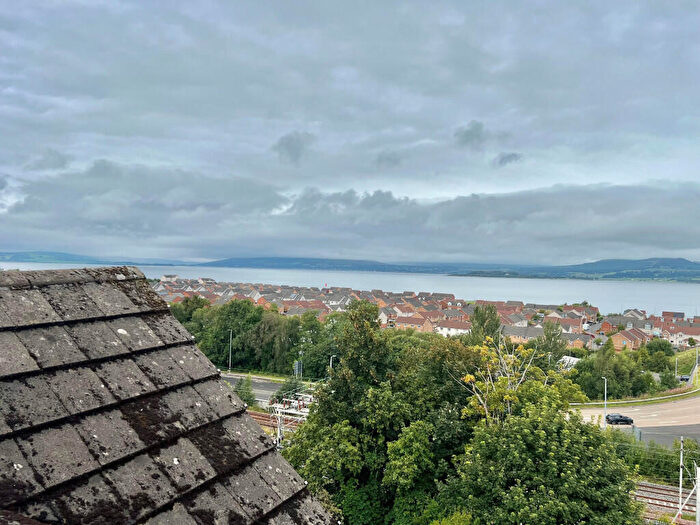
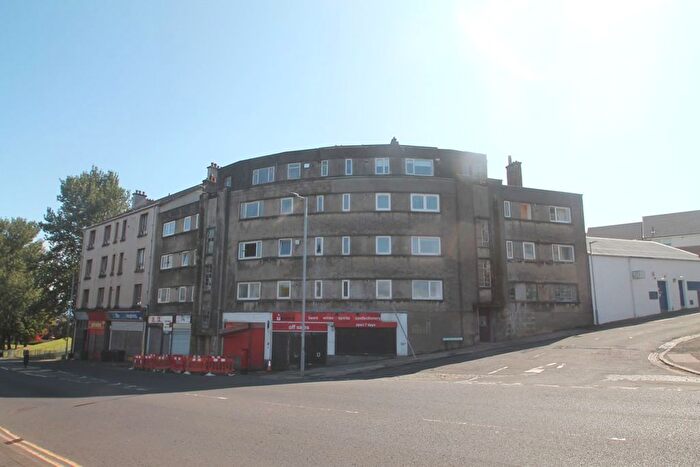
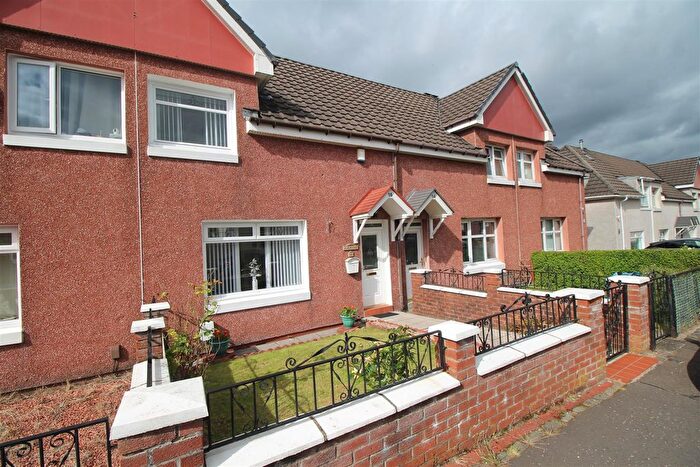
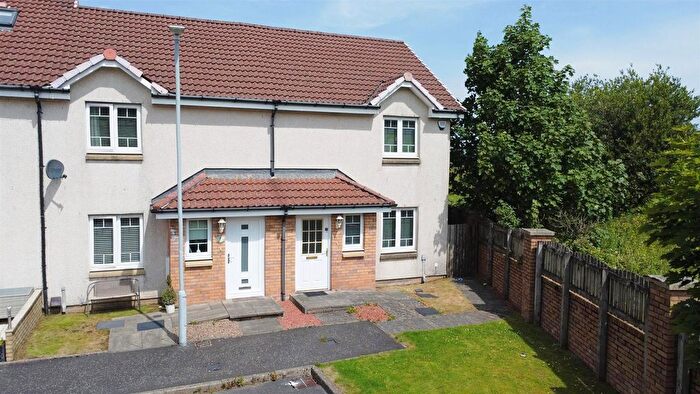
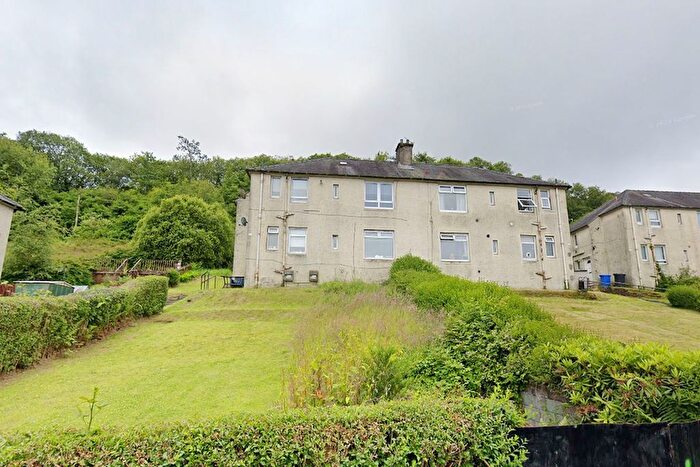
Houses for sale & to rent in Inverclyde East Central, Greenock
House Prices in Inverclyde East Central
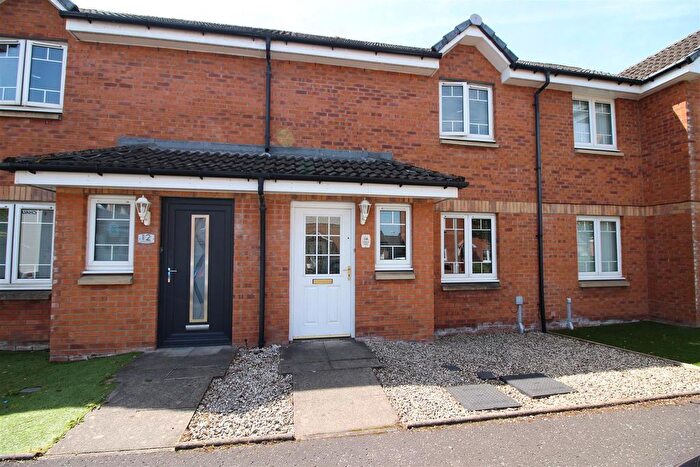
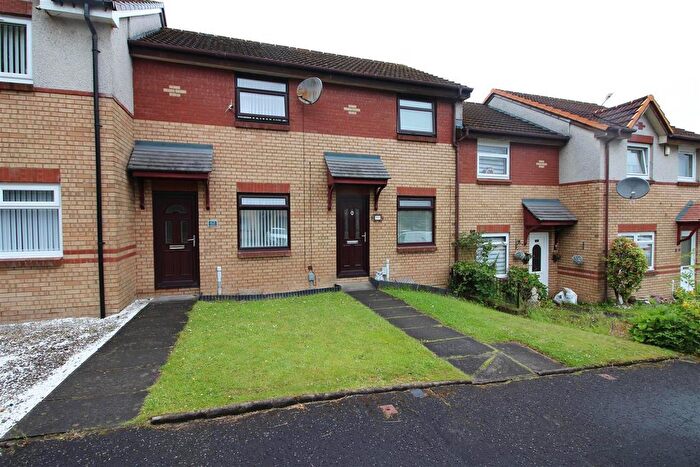
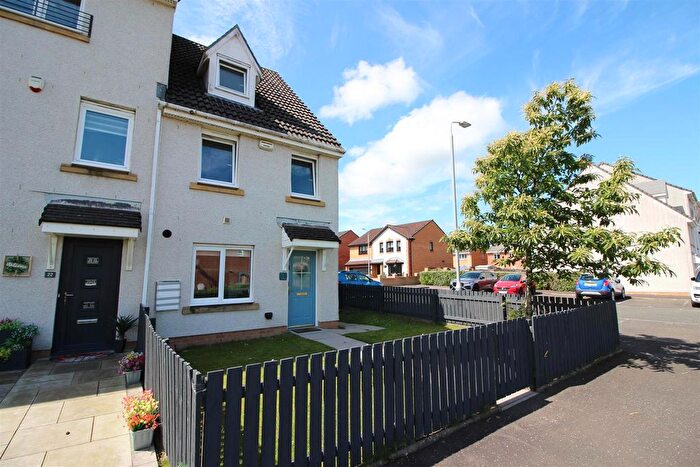
Properties in Inverclyde East Central have an average house price of £145,166.00 and had 42 Property Transactions within the last 3 years¹.
Inverclyde East Central is an area in Greenock, Inverclyde with 596 households², where the most expensive property was sold for £311,300.00.
Properties for sale in Inverclyde East Central
Previously listed properties in Inverclyde East Central
Roads and Postcodes in Inverclyde East Central
Navigate through our locations to find the location of your next house in Inverclyde East Central, Greenock for sale or to rent.
| Streets | Postcodes |
|---|---|
| Bell Street | PA15 2NY |
| Bogston Lane | PA15 2AX |
| Caledonia Drive | PA15 2WF |
| Cedar Crescent | PA15 2PA |
| Chalmers Lane | PA15 2WB |
| Cobham Street | PA15 2PD |
| Crunes Way | PA15 2WH PA15 2WL PA15 2WN |
| Dalmally Street | PA15 2RD |
| Douglas Rae Road | PA15 2AB |
| East Hamilton Street | PA15 2TD PA15 2TQ PA15 2UA PA15 2UT |
| East Street | PA15 2RL |
| Fir Street | PA15 2PB |
| Flax Way | PA15 2WJ |
| Gibshill Road | PA15 2UP |
| Gibson Street | PA15 2NT |
| Great Harbour Way | PA15 2AS |
| Helen Gardens | PA15 2WD |
| Inch Way | PA15 2WG |
| Inchgreen Gardens | PA15 2WE |
| Irwin Street | PA15 2NP |
| Jackson Place | PA15 2AU |
| James Watt Dock | PA15 2AJ |
| James Watt Way | PA15 2AD PA15 2AN |
| Laburnum Place | PA15 2RS |
| Laburnum Street | PA15 2RR |
| Lansbury Street | PA15 2NR PA15 2NS PA15 2NZ |
| Macdougall Street | PA15 2TG |
| Mackenzie Street | PA15 2TW |
| Mitchell Street | PA15 2QX |
| Poplar Street | PA15 2RA PA15 2RB |
| Port Glasgow Road | PA15 2UD PA15 2UL |
| Pottery Street | PA15 2ER PA15 2UH PA15 2UZ |
| Ratho Street | PA15 2BU |
| Scott Way | PA15 2WA |
| Shankland Grove | PA15 2PE |
| Shankland Road | PA15 2NE PA15 2QP PA15 2QR PA15 2QS |
| Sinclair Street | PA15 2TU |
| Smillie Street | PA15 2NH |
| Thomas Muir Lane | PA15 2RN |
| Thomas Muir Street | PA15 2RF |
| Whitelees Road | PA15 2RG |
| PA15 2AR |
Transport near Inverclyde East Central
-
Bogston Station
-
Cartsdyke Station
-
Port Glasgow Station
-
Whinhill Station
-
Greenock Central Station
-
Greenock West Station
-
Drumfrochar Station
-
Woodhall Station
-
Cardross Station
- FAQ
- Price Paid By Year
Frequently asked questions about Inverclyde East Central
What is the average price for a property for sale in Inverclyde East Central?
The average price for a property for sale in Inverclyde East Central is £145,166. This amount is 32% higher than the average price in Greenock. There are 142 property listings for sale in Inverclyde East Central.
Which train stations are available in or near Inverclyde East Central?
Some of the train stations available in or near Inverclyde East Central are Bogston, Cartsdyke and Port Glasgow.
Property Price Paid in Inverclyde East Central by Year
The average sold property price by year was:
| Year | Average Sold Price | Price Change |
Sold Properties
|
|---|---|---|---|
| 2023 | £150,642 | 4% |
7 Properties |
| 2022 | £144,071 | 12% |
35 Properties |
| 2021 | £126,529 | -8% |
40 Properties |
| 2020 | £136,822 | 5% |
31 Properties |
| 2019 | £129,448 | -14% |
23 Properties |
| 2018 | £148,187 | 6% |
27 Properties |
| 2017 | £139,874 | -4% |
60 Properties |
| 2016 | £145,267 | -11% |
55 Properties |
| 2015 | £161,055 | 11% |
78 Properties |
| 2014 | £143,859 | 6% |
40 Properties |
| 2013 | £135,629 | -5% |
52 Properties |
| 2012 | £142,705 | 1% |
37 Properties |
| 2011 | £140,725 | 13% |
33 Properties |
| 2010 | £122,366 | -0,3% |
15 Properties |
| 2009 | £122,722 | -63% |
72 Properties |
| 2008 | £200,359 | -4% |
62 Properties |
| 2007 | £209,312 | 45% |
53 Properties |
| 2006 | £114,844 | -185% |
71 Properties |
| 2005 | £327,672 | 77% |
16 Properties |
| 2004 | £74,036 | -216% |
17 Properties |
| 2003 | £234,236 | 87% |
10 Properties |
| 2002 | £31,137 | -3% |
27 Properties |
| 2001 | £32,000 | - |
1 Property |

