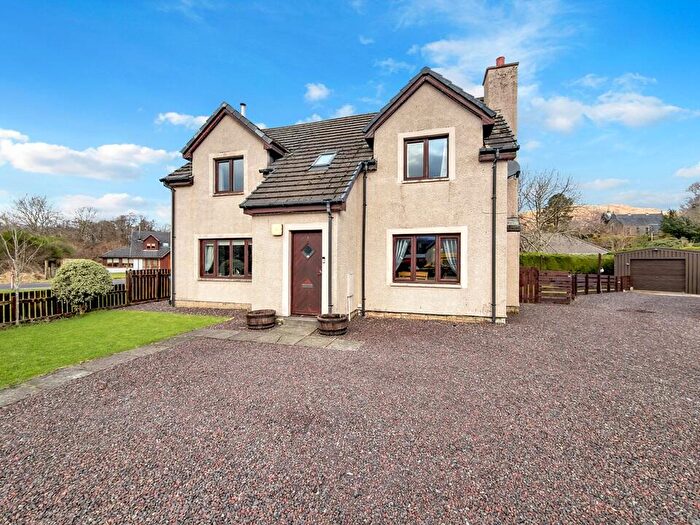
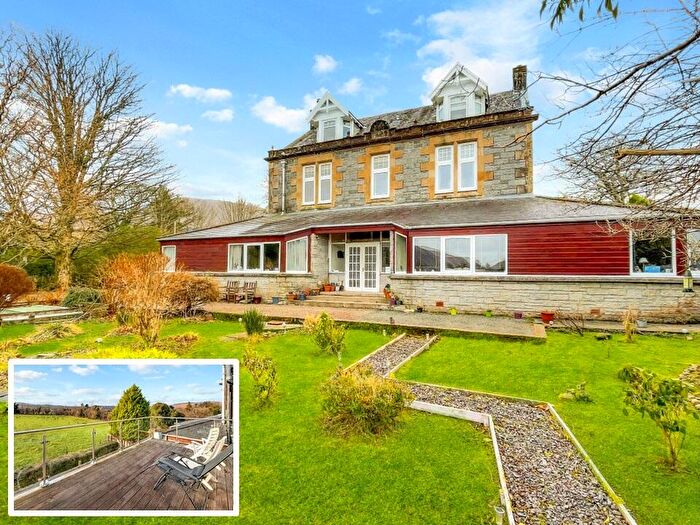
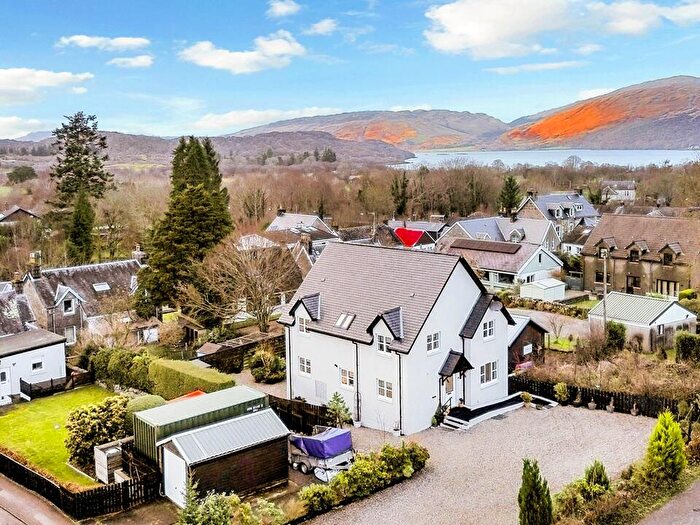
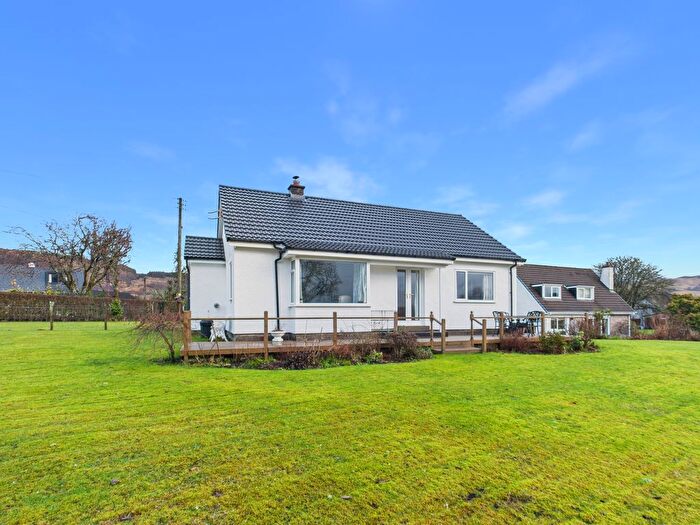
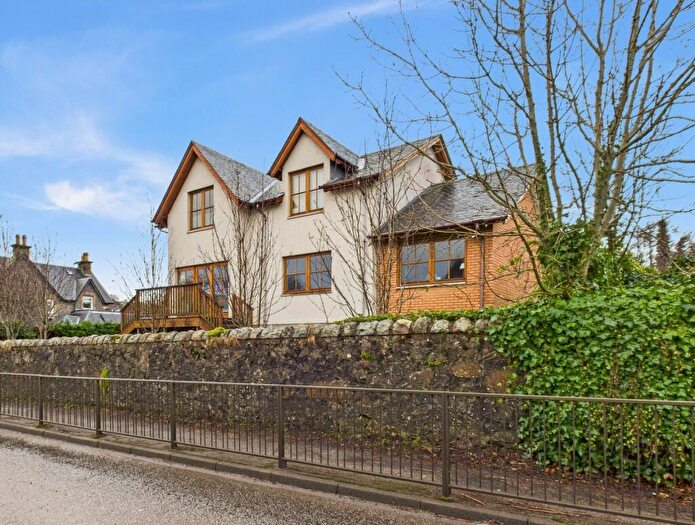
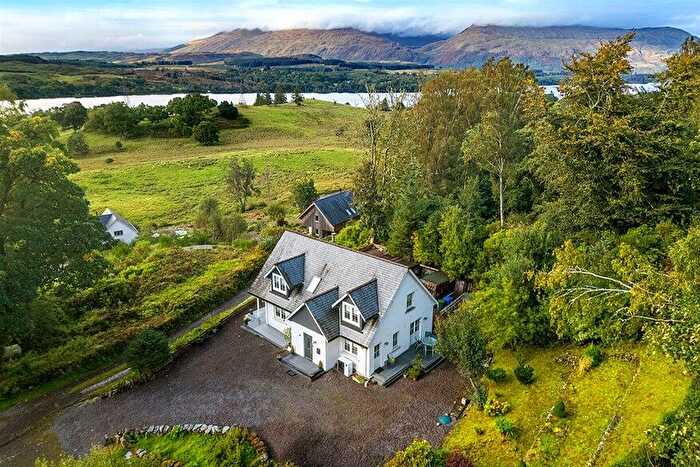
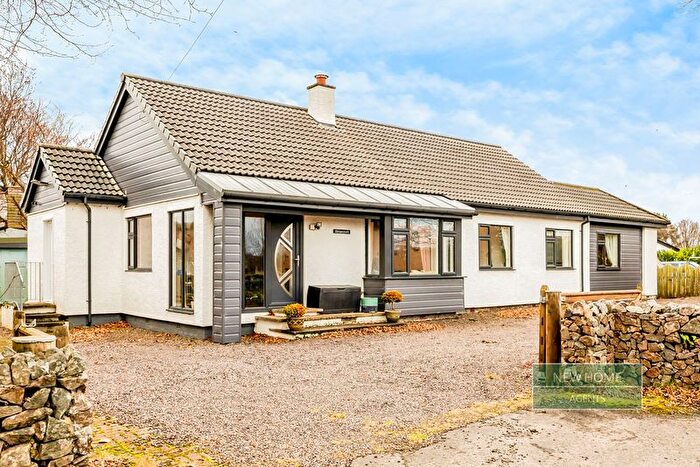
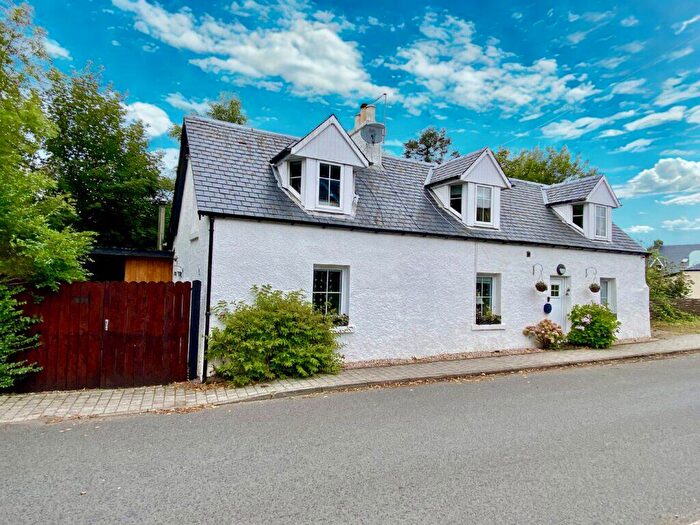
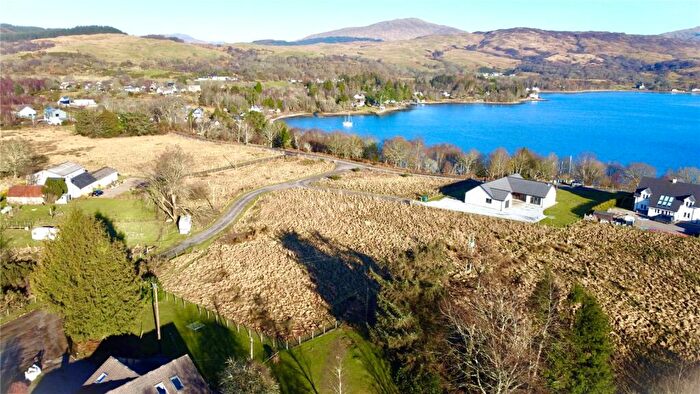
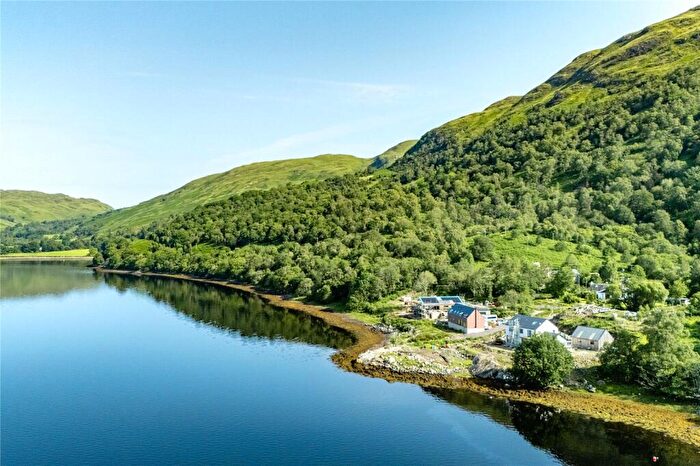
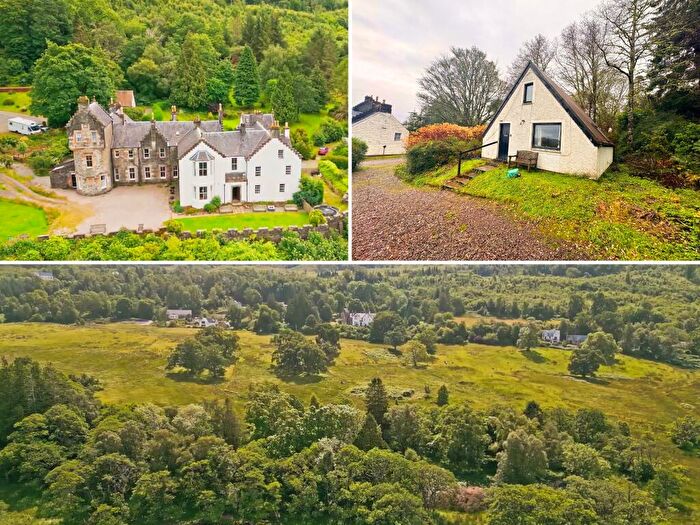
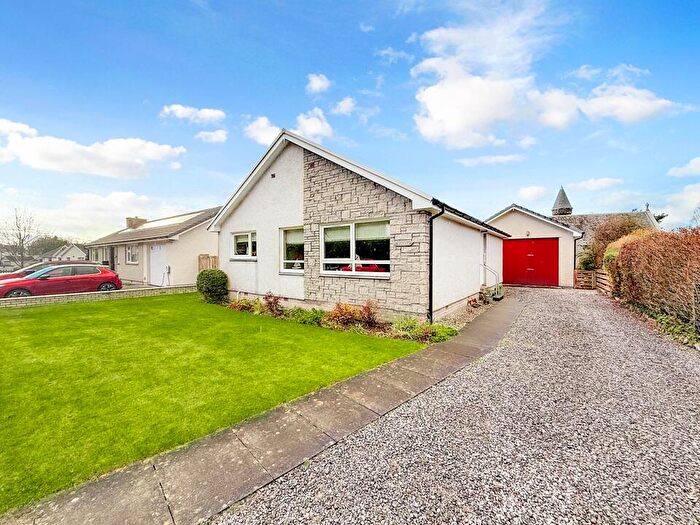
Houses for sale & to rent in Oban North and Lorn, Taynuilt
House Prices in Oban North and Lorn
Properties in Oban North and Lorn have an average house price of £256,875.00 and had 8 Property Transactions within the last 3 years¹.
Oban North and Lorn is an area in Taynuilt, Argyll and Bute with 574 households², where the most expensive property was sold for £400,000.00.
Properties for sale in Oban North and Lorn
Roads and Postcodes in Oban North and Lorn
Navigate through our locations to find the location of your next house in Oban North and Lorn, Taynuilt for sale or to rent.
| Streets | Postcodes |
|---|---|
| Airds Bay | PA35 1JR |
| Chestnut Court | PA35 1JZ |
| Cruachan Cottages | PA35 1JG |
| Cruachan Terrace | PA35 1JX |
| Nant Park | PA35 1LA |
| Strathview | PA35 1JF |
| PA35 1AG PA35 1HD PA35 1HE PA35 1HF PA35 1HG PA35 1HH PA35 1HJ PA35 1HL PA35 1HN PA35 1HP PA35 1HQ PA35 1HR PA35 1HS PA35 1HT PA35 1HU PA35 1HW PA35 1HY PA35 1HZ PA35 1JA PA35 1JB PA35 1JD PA35 1JE PA35 1JH PA35 1JJ PA35 1JL PA35 1JN PA35 1JP PA35 1JQ PA35 1JS PA35 1JT PA35 1JU PA35 1JW PA35 1JY PA35 1YD |
Transport near Oban North and Lorn
-
Taynuilt Station
-
Falls Of Cruachan Station
-
Connel Ferry Station
-
Loch Awe Station
-
Dalmally Station
-
Oban Station
- FAQ
- Price Paid By Year
Frequently asked questions about Oban North and Lorn
What is the average price for a property for sale in Oban North and Lorn?
The average price for a property for sale in Oban North and Lorn is £256,875. There are 734 property listings for sale in Oban North and Lorn.
Which train stations are available in or near Oban North and Lorn?
Some of the train stations available in or near Oban North and Lorn are Taynuilt, Falls Of Cruachan and Connel Ferry.
Property Price Paid in Oban North and Lorn by Year
The average sold property price by year was:
| Year | Average Sold Price | Price Change |
Sold Properties
|
|---|---|---|---|
| 2023 | £256,875 | -8% |
8 Properties |
| 2022 | £277,105 | 16% |
27 Properties |
| 2021 | £232,679 | 22% |
48 Properties |
| 2020 | £180,793 | 7% |
19 Properties |
| 2019 | £167,391 | -16% |
27 Properties |
| 2018 | £193,479 | 18% |
37 Properties |
| 2017 | £158,699 | -22% |
27 Properties |
| 2016 | £192,852 | 12% |
43 Properties |
| 2015 | £168,937 | 3% |
24 Properties |
| 2014 | £163,476 | 21% |
28 Properties |
| 2013 | £129,835 | -6% |
17 Properties |
| 2012 | £137,206 | -64% |
29 Properties |
| 2011 | £224,642 | 11% |
14 Properties |
| 2010 | £199,314 | 56% |
25 Properties |
| 2009 | £87,912 | -40% |
16 Properties |
| 2008 | £123,252 | -25% |
21 Properties |
| 2007 | £154,194 | 7% |
41 Properties |
| 2006 | £143,171 | -6% |
35 Properties |
| 2005 | £151,448 | 56% |
20 Properties |
| 2004 | £66,856 | -31% |
24 Properties |
| 2003 | £87,593 | -5% |
21 Properties |
| 2002 | £91,930 | 76% |
26 Properties |
| 2001 | £21,900 | - |
1 Property |

