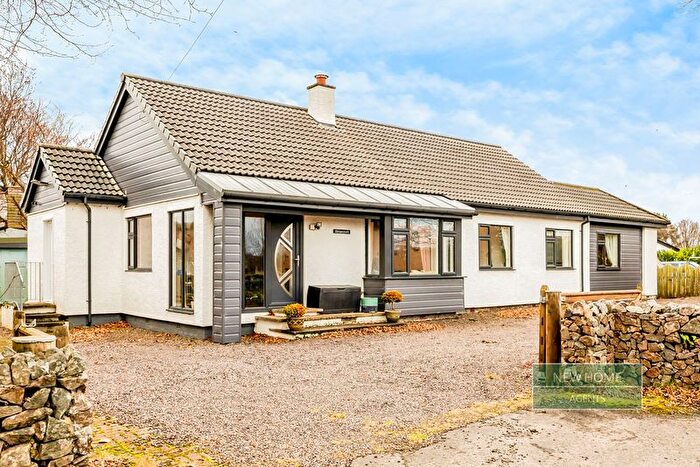
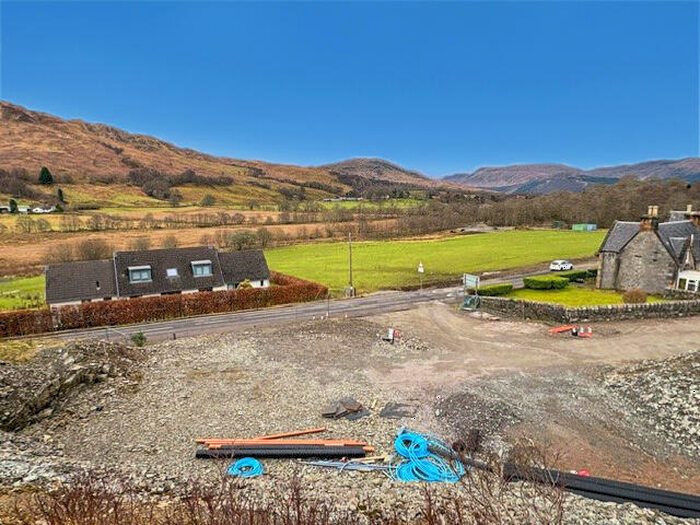
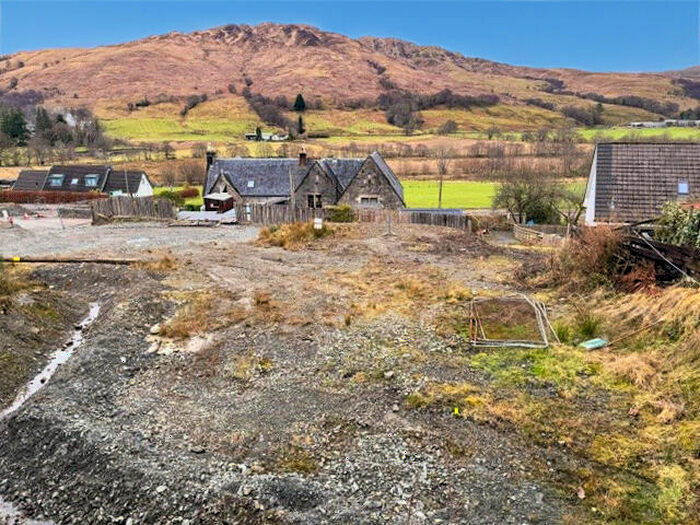
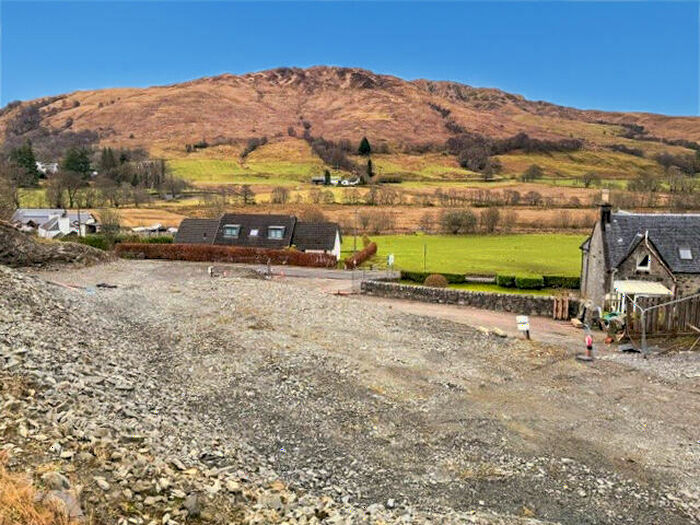
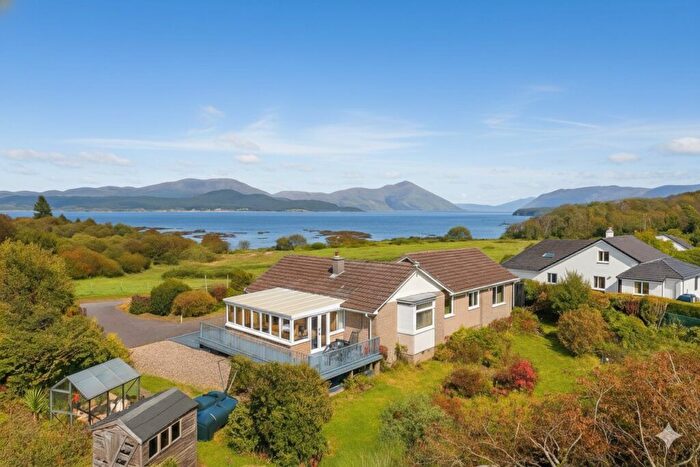
Houses for sale & to rent in Oban North and Lorn, Appin
House Prices in Oban North and Lorn
Properties in Oban North and Lorn have an average house price of £488,451.00 and had 6 Property Transactions within the last 3 years¹.
Oban North and Lorn is an area in Appin, Argyll and Bute with 206 households², where the most expensive property was sold for £550,000.00.
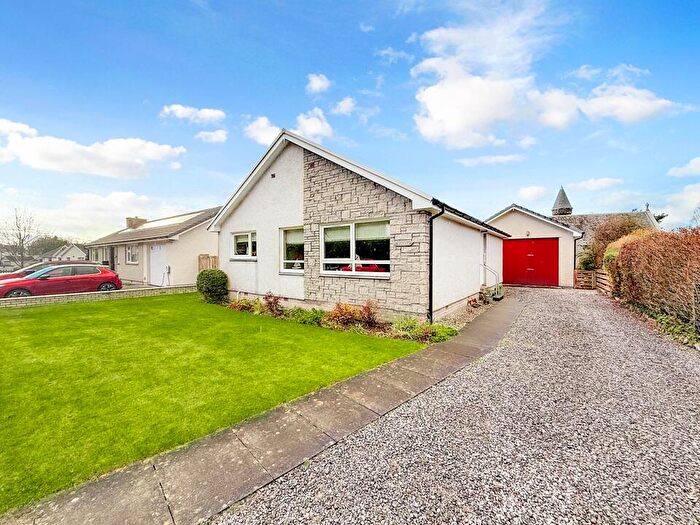
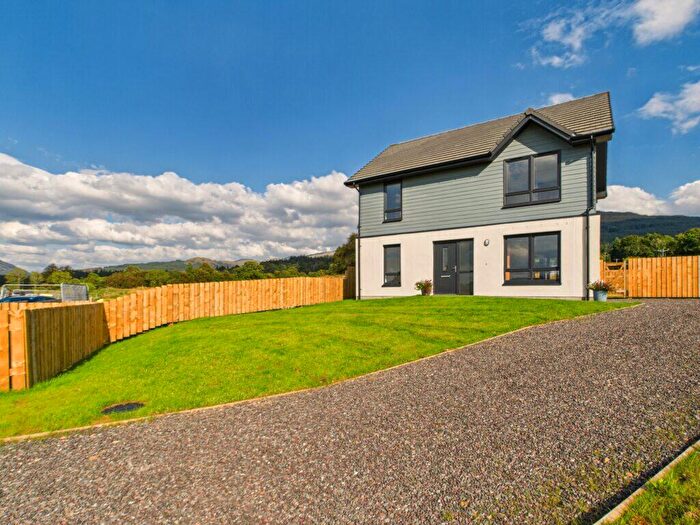
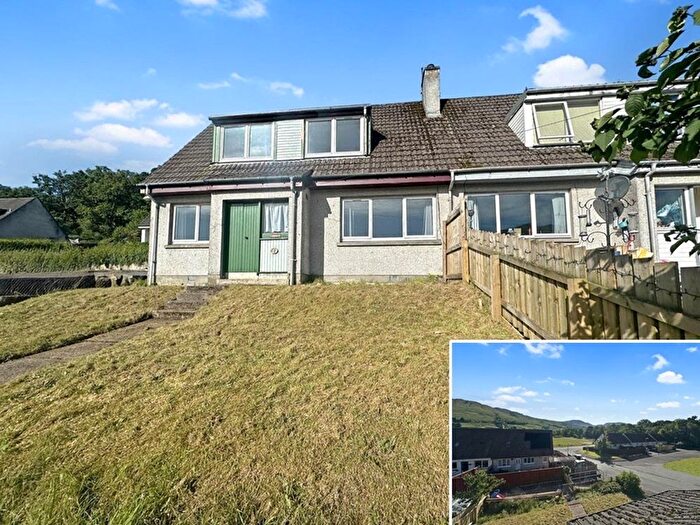
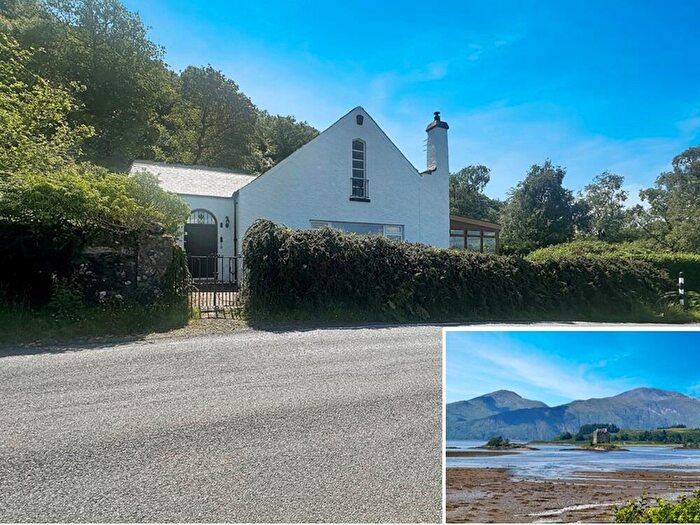
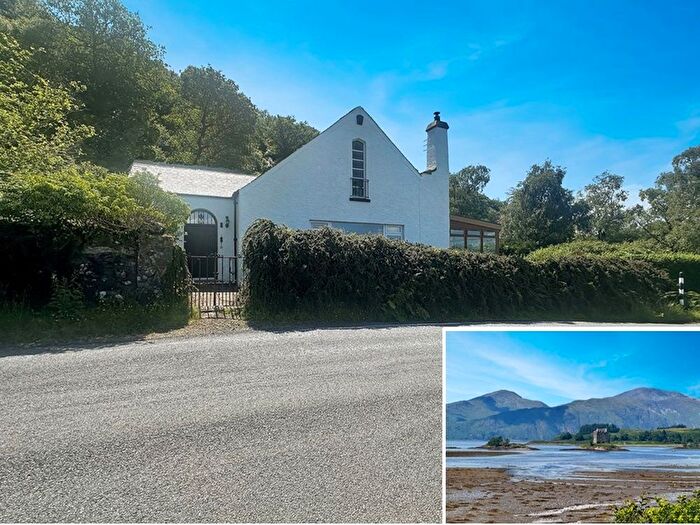
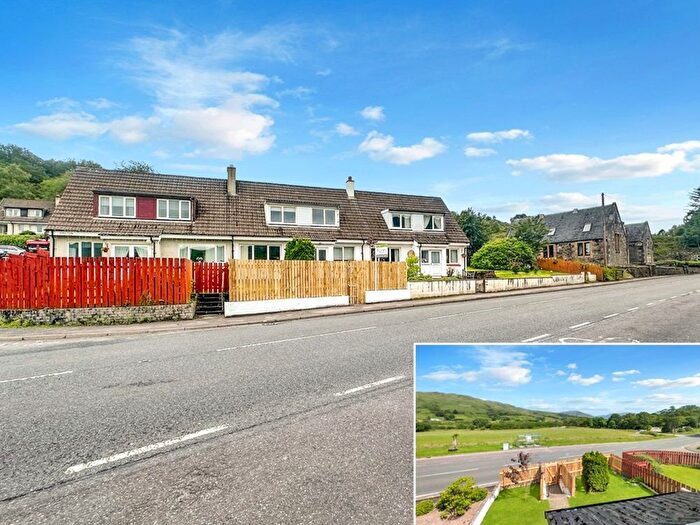
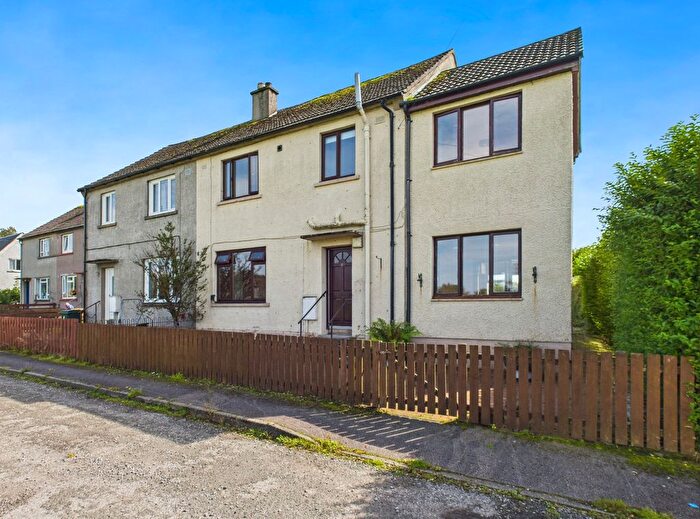
Properties for sale in Oban North and Lorn
Previously listed properties in Oban North and Lorn
Roads and Postcodes in Oban North and Lorn
Navigate through our locations to find the location of your next house in Oban North and Lorn, Appin for sale or to rent.
| Streets | Postcodes |
|---|---|
| Appin Terrace | PA38 4BH |
| Bealach Na Mara | PA38 4DR |
| Shuna View | PA38 4DG |
| The Pier | PA38 4DN |
| Tynribbie Place | PA38 4DS |
| PA38 4BA PA38 4BB PA38 4BD PA38 4BE PA38 4BG PA38 4BJ PA38 4BL PA38 4BN PA38 4BQ PA38 4DB PA38 4DD PA38 4DE PA38 4DF PA38 4DL PA38 4DQ |
Transport near Oban North and Lorn
- FAQ
- Price Paid By Year
Frequently asked questions about Oban North and Lorn
What is the average price for a property for sale in Oban North and Lorn?
The average price for a property for sale in Oban North and Lorn is £488,451. There are 122 property listings for sale in Oban North and Lorn.
Which train stations are available in or near Oban North and Lorn?
Some of the train stations available in or near Oban North and Lorn are Connel Ferry, Taynuilt and Oban.
Property Price Paid in Oban North and Lorn by Year
The average sold property price by year was:
| Year | Average Sold Price | Price Change |
Sold Properties
|
|---|---|---|---|
| 2023 | £488,451 | 25% |
6 Properties |
| 2022 | £366,750 | -15% |
6 Properties |
| 2021 | £421,381 | 31% |
8 Properties |
| 2020 | £288,750 | 0,2% |
6 Properties |
| 2019 | £288,035 | 35% |
14 Properties |
| 2018 | £188,111 | 44% |
9 Properties |
| 2017 | £105,666 | -97% |
3 Properties |
| 2016 | £207,642 | -71% |
7 Properties |
| 2015 | £355,000 | 47% |
8 Properties |
| 2014 | £188,312 | -26% |
8 Properties |
| 2013 | £237,785 | -21% |
7 Properties |
| 2012 | £287,892 | -2% |
14 Properties |
| 2011 | £292,583 | 50% |
6 Properties |
| 2010 | £146,800 | -131% |
7 Properties |
| 2009 | £339,642 | 32% |
7 Properties |
| 2008 | £232,571 | -15% |
7 Properties |
| 2007 | £267,115 | 45% |
10 Properties |
| 2006 | £147,380 | -1% |
18 Properties |
| 2005 | £149,075 | -3% |
10 Properties |
| 2004 | £153,760 | 22% |
10 Properties |
| 2003 | £120,294 | 33% |
12 Properties |
| 2002 | £80,722 | -656% |
11 Properties |
| 2001 | £610,000 | - |
1 Property |


