
Houses for sale & to rent in DG2 7QU, New Abbey, Dumfries
House Prices in DG2 7QU, New Abbey
Properties in DG2 7QU have no sales history available within the last 3 years. DG2 7QU is a postcode in New Abbey, an area in Dumfries, Dumfries and Galloway, with 8 households².
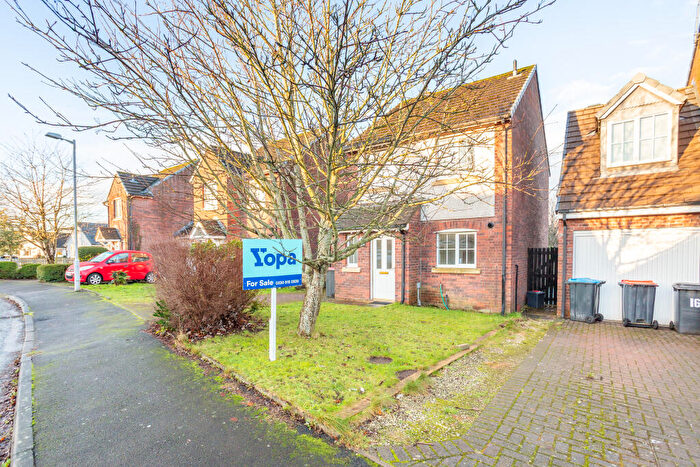
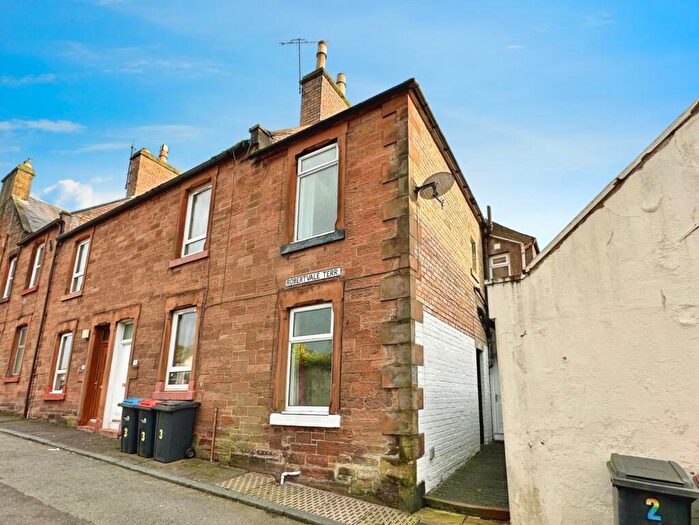
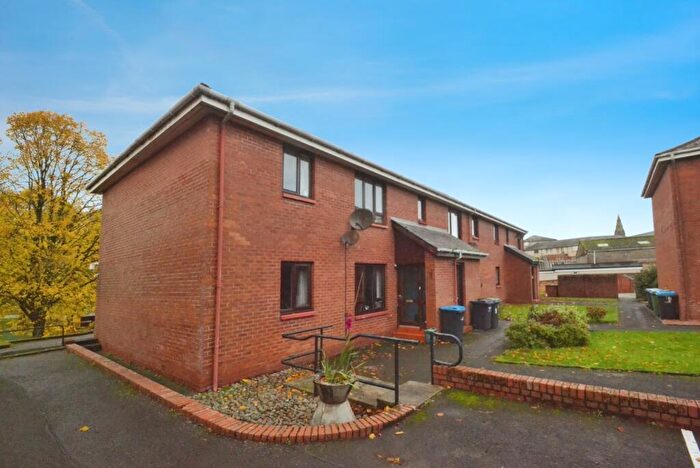
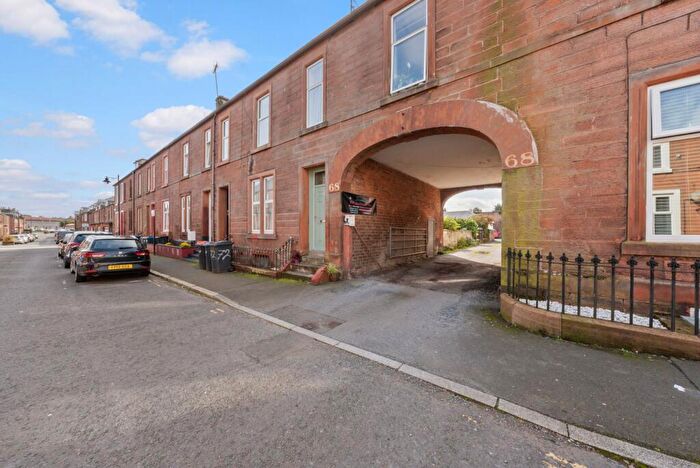
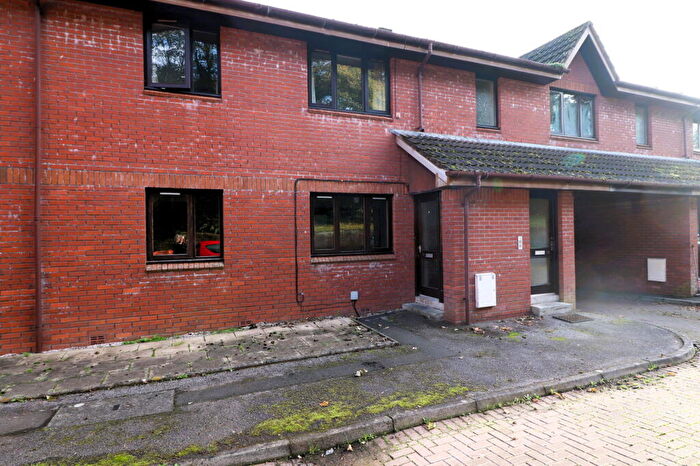
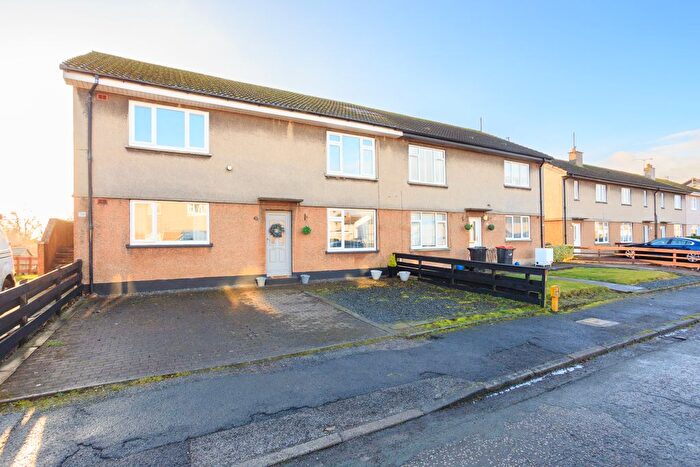
Properties for sale near DG2 7QU
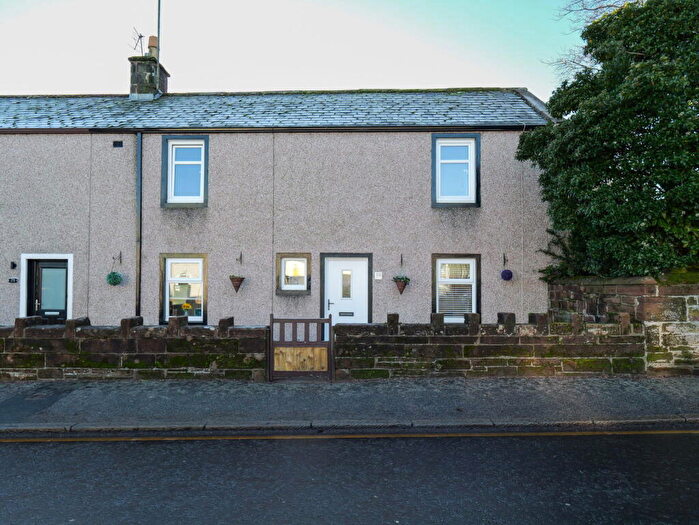
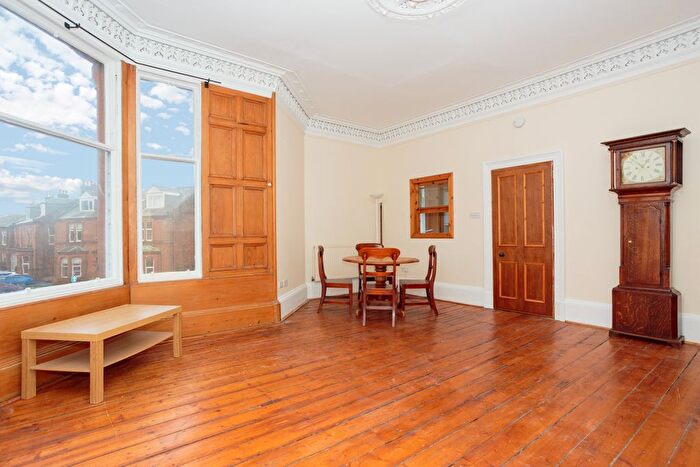
![]()
If you are looking to sell your house, let it out, or receive a property valuation, an expert can help you.
Click the button below to get started.
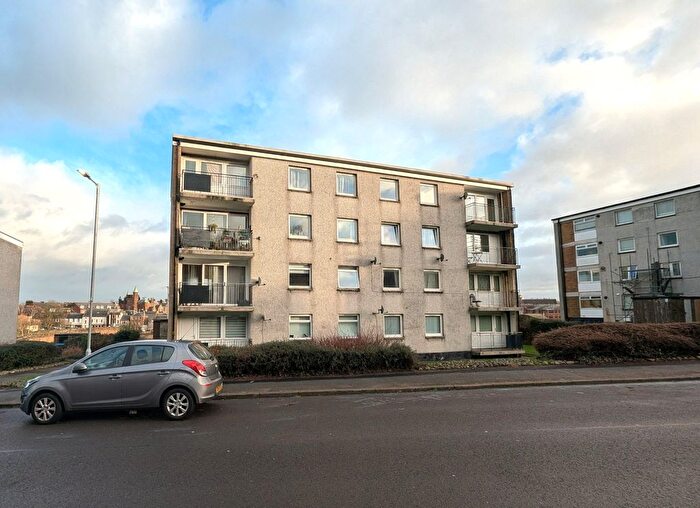
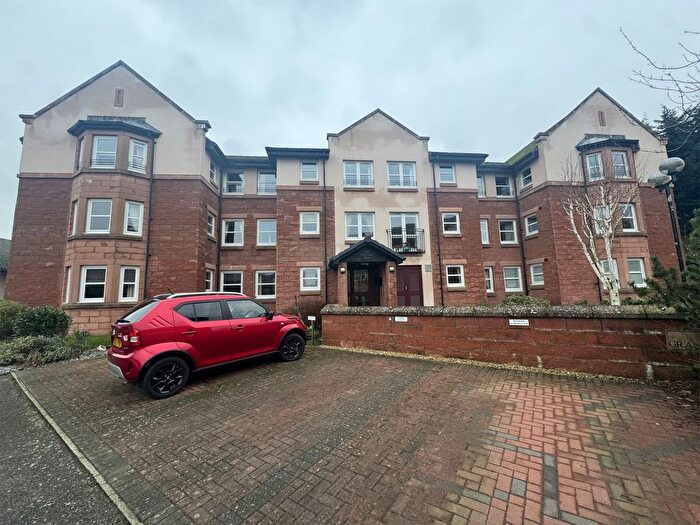
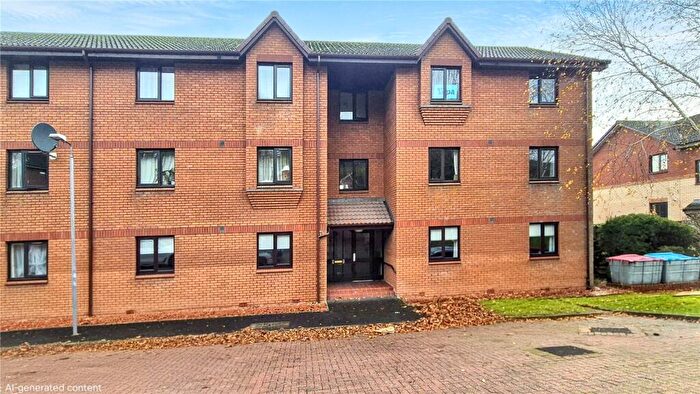
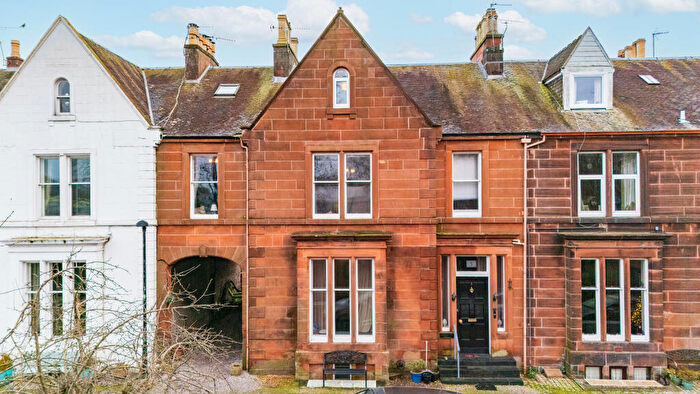
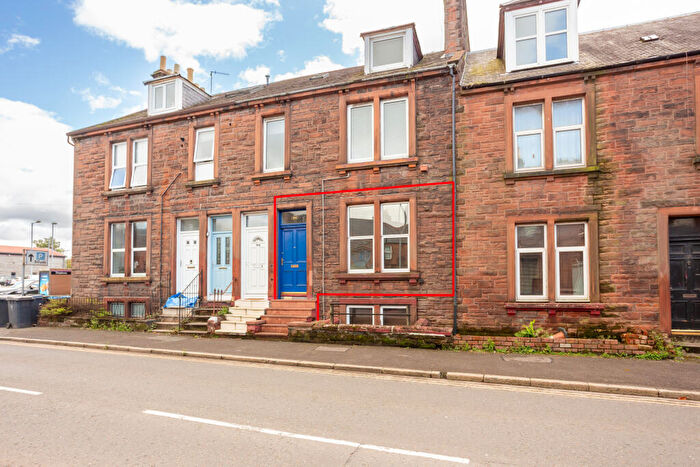
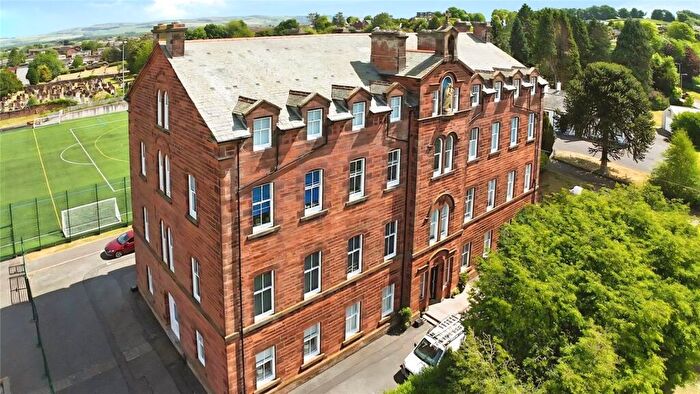
Previously listed properties near DG2 7QU
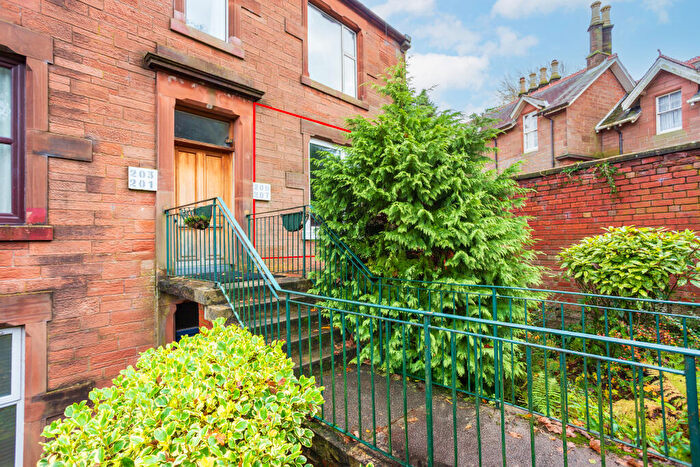
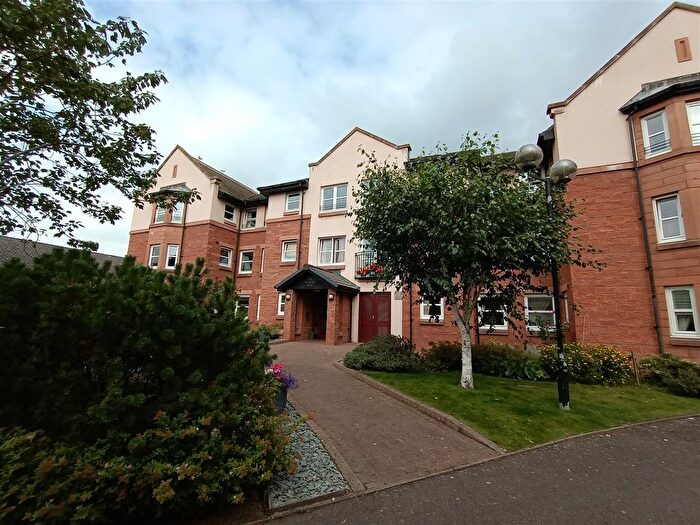
![]()
If you are looking to sell your house, let it out, or receive a property valuation, an expert can help you.
Click the button below to get started.
Price Paid in DG2 7QU, New Abbey
8 Welldale DG2 7QU, New Abbey Dumfries
Property 8 Welldale has been sold 3 times. The last time it was sold was in 02/12/2020 and the sold price was £173,000.00.
This is a Property which was sold as an Established Building in 02/12/2020
| Date | Price | Classification |
|---|---|---|
| 02/12/2020 | £173,000.00 | Established Building |
| 07/12/2009 | £160,000.00 | Established Building |
| 17/12/2004 | £171,500.00 | Established Building |
1 Ashlar DG2 7QU, New Abbey Dumfries
Property 1 Ashlar has been sold 2 times. The last time it was sold was in 02/07/2019 and the sold price was £173,000.00.
This is a Property which was sold as an Established Building in 02/07/2019
| Date | Price | Classification |
|---|---|---|
| 02/07/2019 | £173,000.00 | Established Building |
| 09/01/2014 | £150,000.00 | Established Building |
7 Welldale DG2 7QU, New Abbey Dumfries
Property 7 Welldale has been sold 2 times. The last time it was sold was in 22/03/2019 and the sold price was £167,000.00.
This is a Property which was sold as an Established Building in 22/03/2019
| Date | Price | Classification |
|---|---|---|
| 22/03/2019 | £167,000.00 | Established Building |
| 27/08/2014 | £170,000.00 | Established Building |
6 Welldale DG2 7QU, New Abbey Dumfries
Property 6 Welldale has been sold 1 time. The last time it was sold was in 18/09/2015 and the sold price was £146,000.00.
This is a Property which was sold as an Established Building in 18/09/2015
| Date | Price | Classification |
|---|---|---|
| 18/09/2015 | £146,000.00 | Established Building |
Transport near DG2 7QU

House price paid reports for DG2 7QU
Click on the buttons below to see price paid reports by year or property price:
- Price Paid By Year
Property Price Paid in DG2 7QU by Year
The average sold property price by year was:
| Year | Average Sold Price | Price Change |
Sold Properties
|
|---|---|---|---|
| 2020 | £173,000 | 2% |
1 Property |
| 2019 | £170,000 | 14% |
2 Properties |
| 2015 | £146,000 | -10% |
1 Property |
| 2014 | £160,000 | - |
2 Properties |
| 2009 | £160,000 | -7% |
1 Property |
| 2004 | £171,500 | - |
1 Property |