
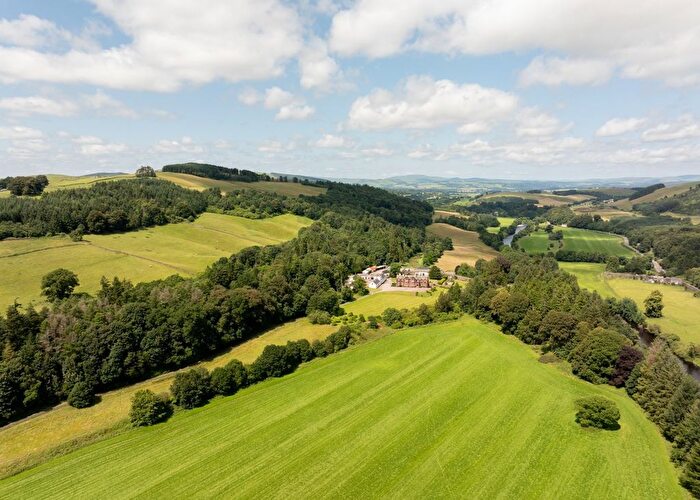
Houses for sale in Dumfries and Galloway, Scotland
House Prices in Dumfries and Galloway
Properties in Dumfries and Galloway have
an average house price of
£157k
and had 3,146 Property Transactions
within the last 3 years.¹
Dumfries and Galloway is a location in
Scotland with
67,951 households², where the most expensive property was sold for £900k.
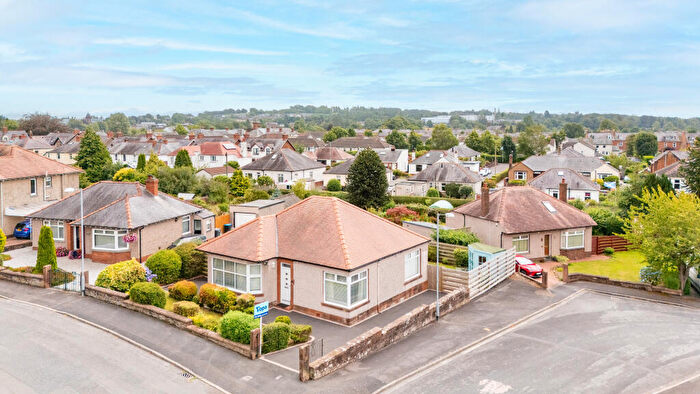
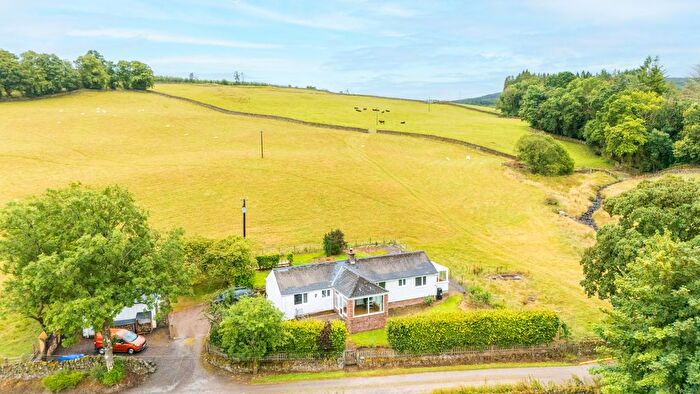
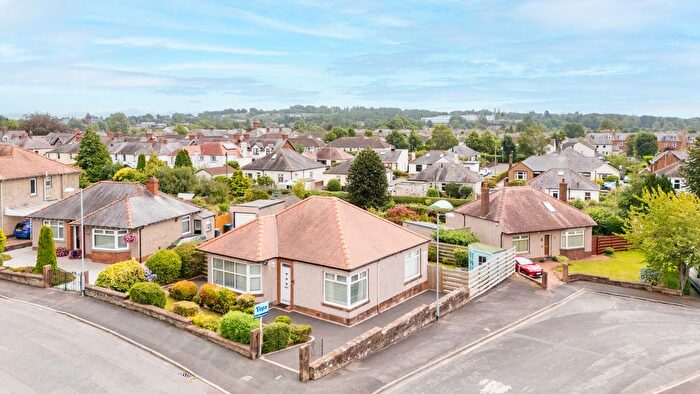
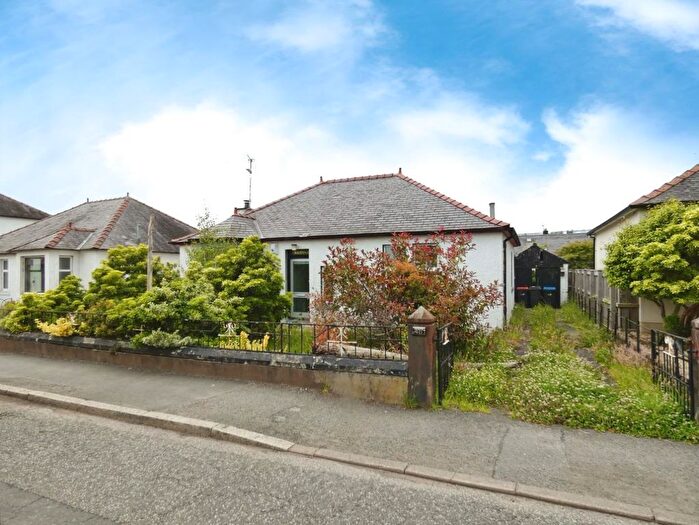
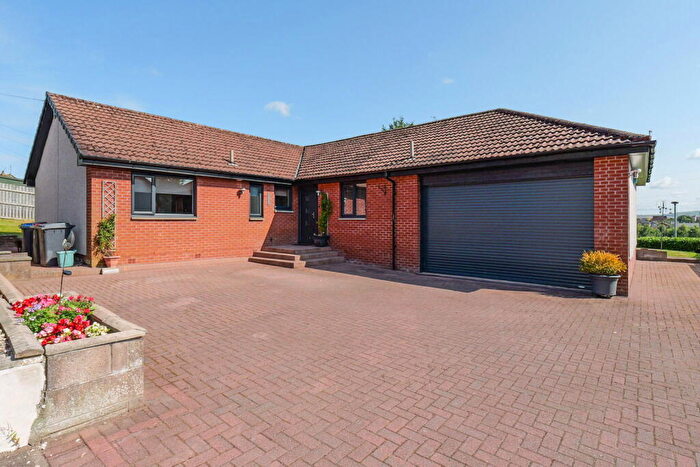
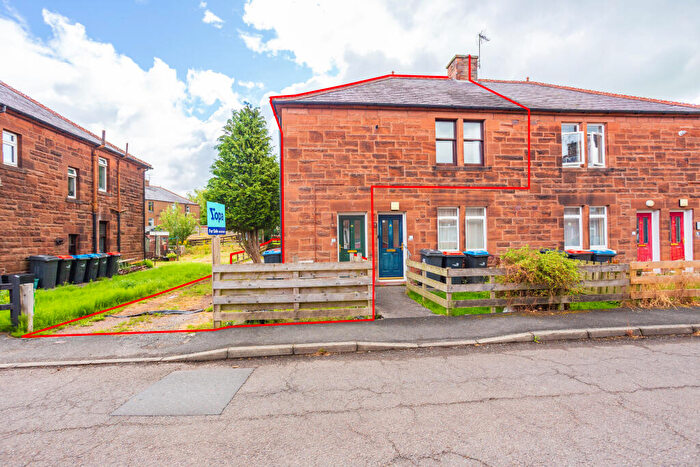
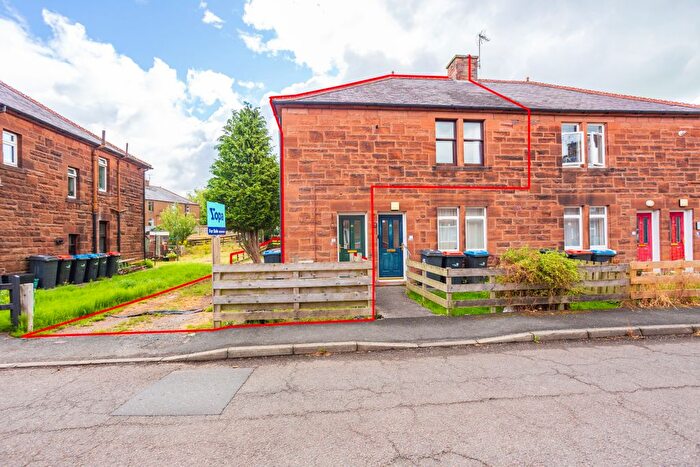
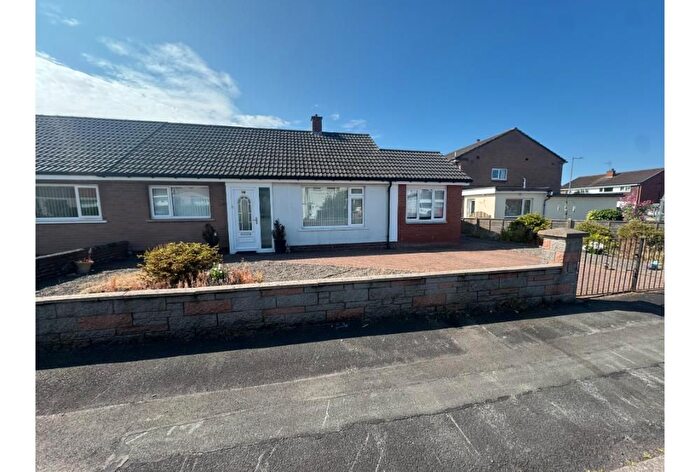
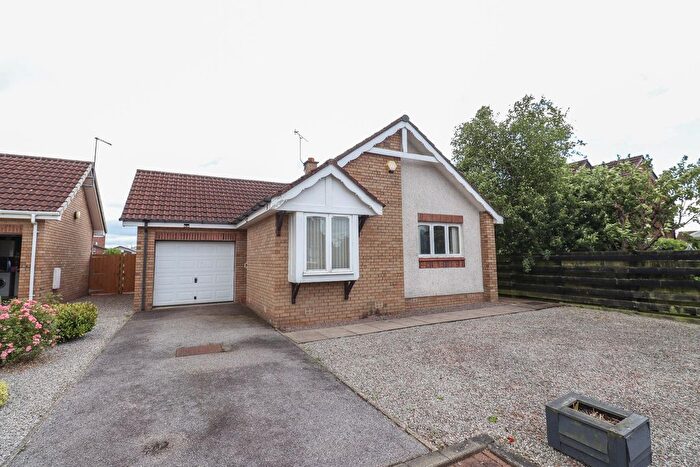
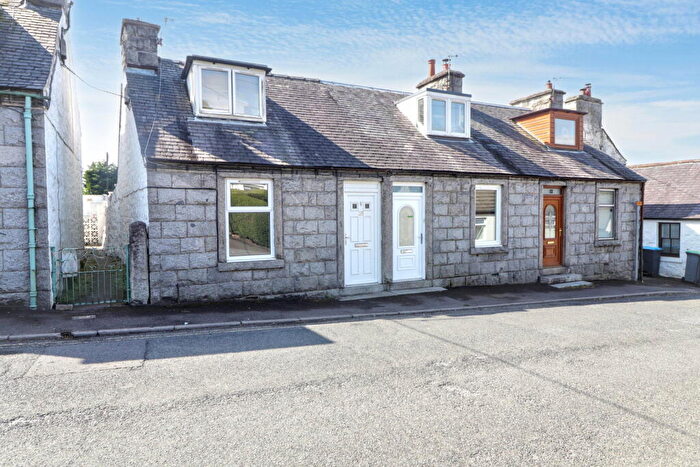
Properties for sale in Dumfries and Galloway

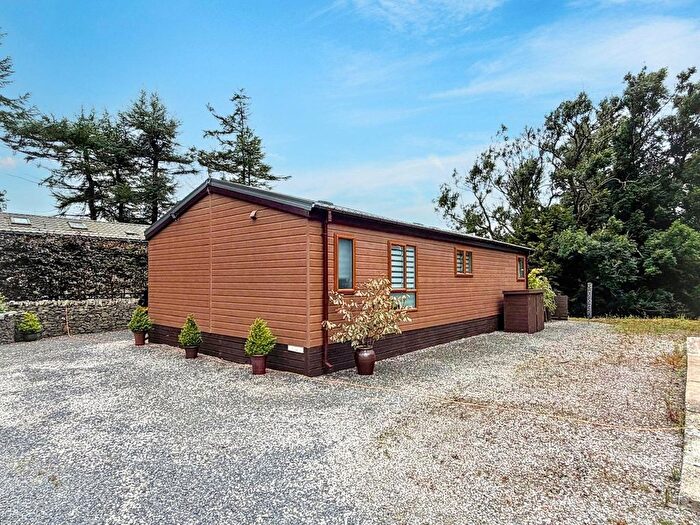
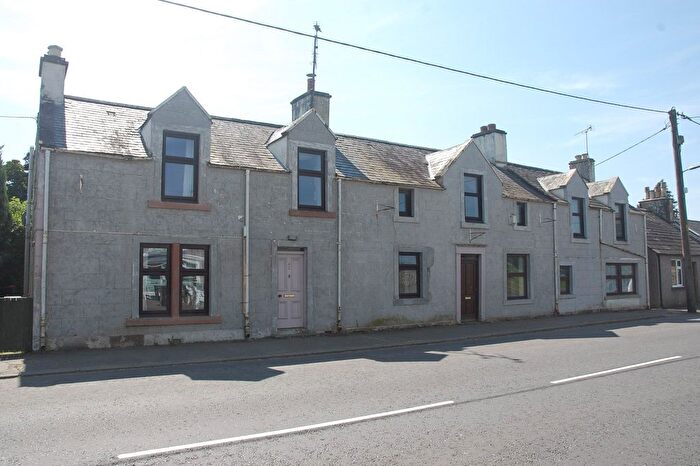
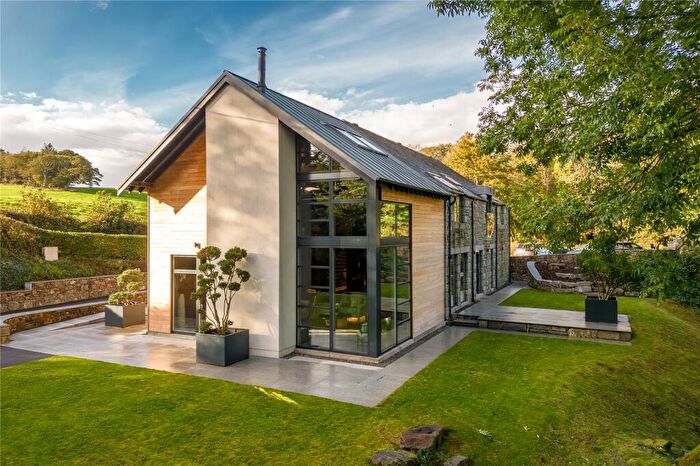
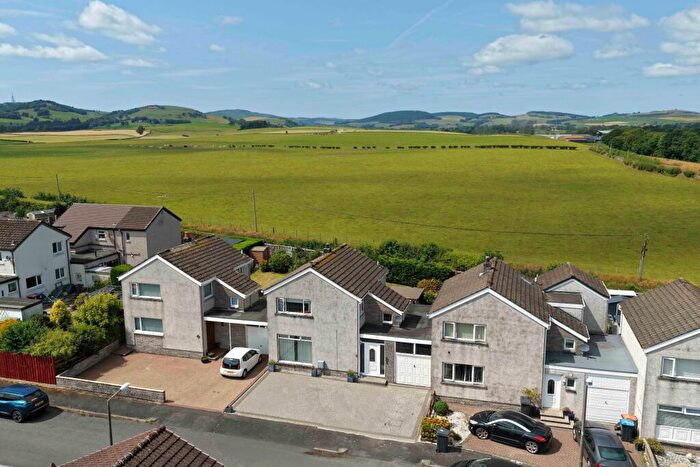
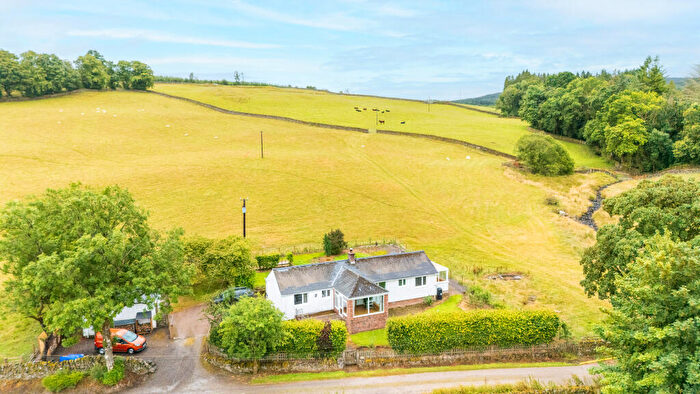
![]()
If you are looking to sell your house, let it out, or receive a property valuation, an expert can help you.
Click the button below to get started.


Towns in Dumfries and Galloway
Navigate through our locations to find the location of your next house in Dumfries and Galloway, Scotland for sale or to rent.
Property price trends in Dumfries and Galloway
According to the latest Registers of Scotland data, the average home in Dumfries and Galloway sold for £158,270 in 2026. That figure comes from a substantial record of 56,570 sales logged over the past 25 years.
Prices have held fairly steady over the last three years. Compared with 2023, when the typical sale came in around £157,786, values are broadly unchanged.
Looking back five years, average prices are down about 5.4% since 2021, a drop of around £9,083 in cash terms.
Zoom out to the past decade for the fuller picture. Back in 2016, homes here averaged £138,138, so the typical sold price has climbed about 14.6% since then, roughly 1.4% a year. Stretch the view to fifteen years and that annual pace holds at about 1.2%.
Frequently asked questions about Dumfries and Galloway
What is the average price for a property for sale in Dumfries and Galloway?
The average price for a property for sale in Dumfries and Galloway is £156,738. This amount is 22% lower than the average price in Scotland. There are more than 10,000 property listings for sale in Dumfries and Galloway.
What locations have the most expensive properties for sale in Dumfries and Galloway?
The locations with the most expensive properties for sale in Dumfries and Galloway are Moffat at an average of £218,906, Kirkcudbright at an average of £202,472 and Castle Douglas at an average of £188,655.
What locations have the most affordable properties for sale in Dumfries and Galloway?
The locations with the most affordable properties for sale in Dumfries and Galloway are Sanquhar at an average of £96,399, Langholm at an average of £126,834 and Stranraer at an average of £128,694.
Which train stations are available in or near Dumfries and Galloway?
Some of the train stations available in or near Dumfries and Galloway are Dumfries, Lockerbie and Sanquhar.
Property Price Paid in Dumfries and Galloway by Year
The average sold property price by year was:
| Year | Average Sold Price | Price Change |
Sold Properties
|
|---|---|---|---|
| 2026 | £158,270 | 0,1% |
230 Properties |
| 2025 | £158,128 | 3% |
927 Properties |
| 2024 | £153,575 | -3% |
885 Properties |
| 2023 | £157,786 | -17% |
1,104 Properties |
| 2022 | £185,057 | 10% |
2,443 Properties |
| 2021 | £167,353 | 9% |
2,916 Properties |
| 2020 | £152,217 | 3% |
2,151 Properties |
| 2019 | £147,449 | -1% |
2,629 Properties |
| 2018 | £148,350 | 7% |
2,515 Properties |
| 2017 | £138,018 | -0,1% |
2,416 Properties |
Transport in Dumfries and Galloway
Please see below transportation links in this area:
