
Houses for sale & to rent in Dumfries, Dumfries and Galloway
House Prices in Dumfries
Properties in Dumfries have an average house price of £152k and had 1,099 Property Transactions within the last 3 years.¹
Dumfries is an area in Dumfries and Galloway with 22,616 households², where the most expensive property was sold for £635k.
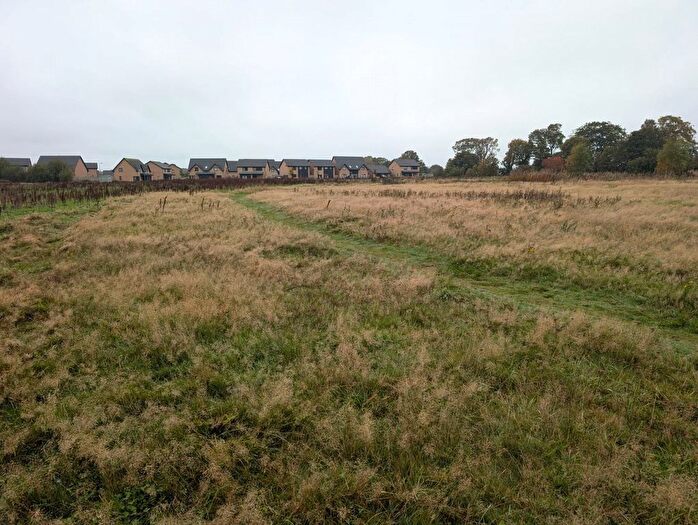
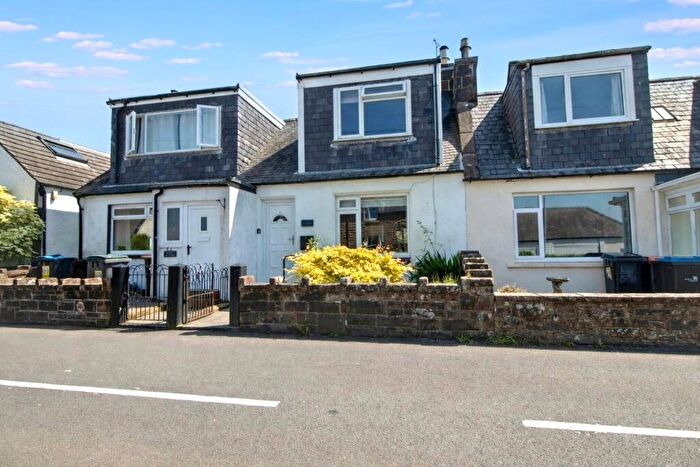
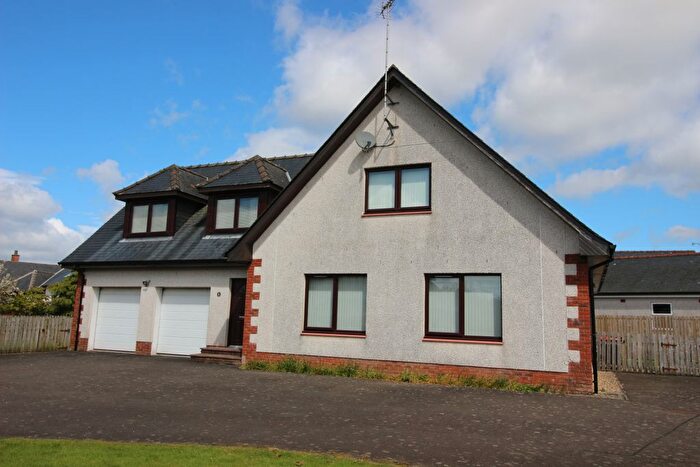
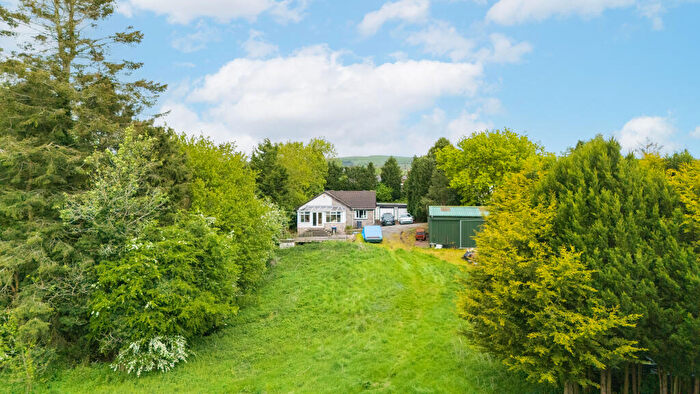
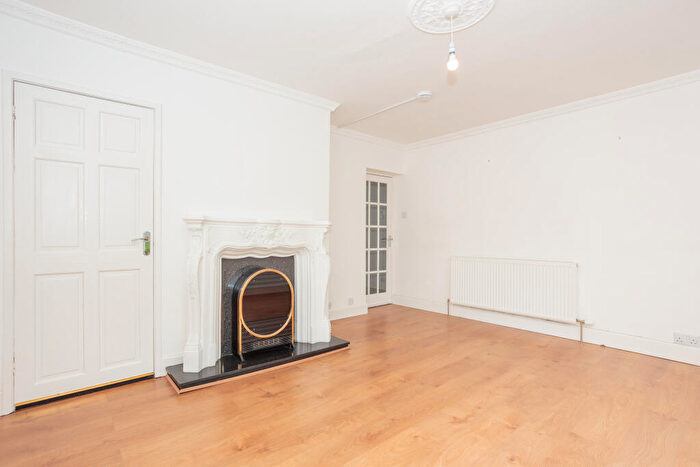
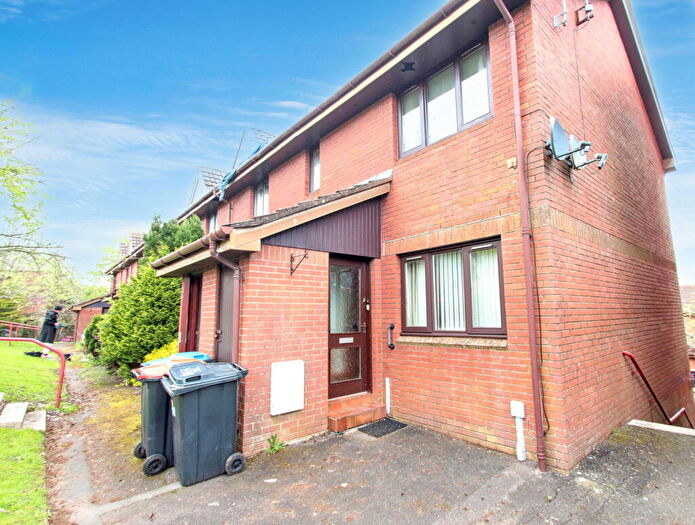
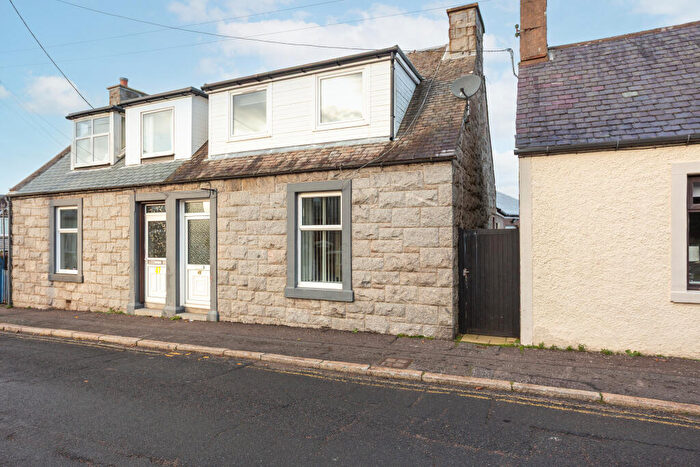
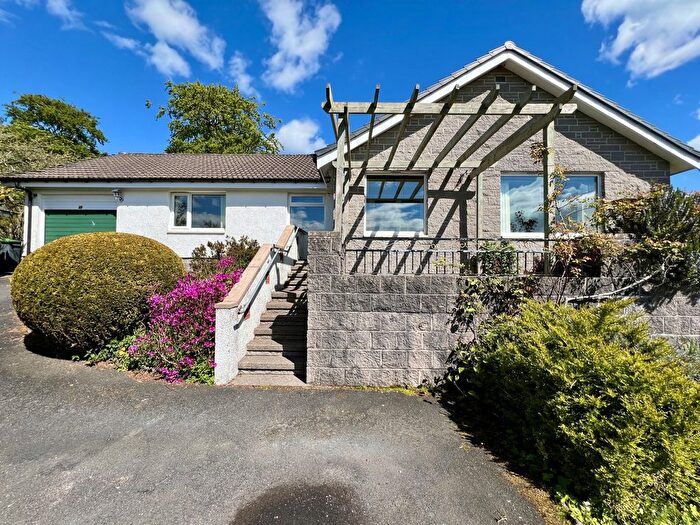
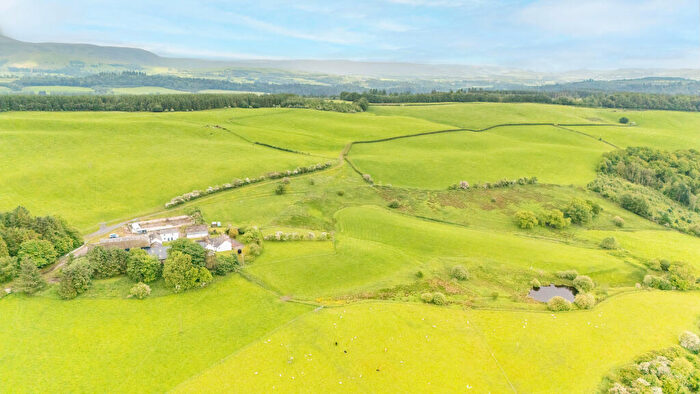
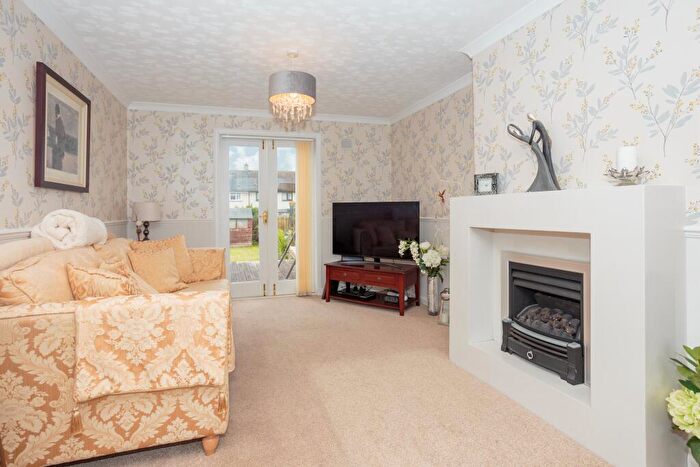
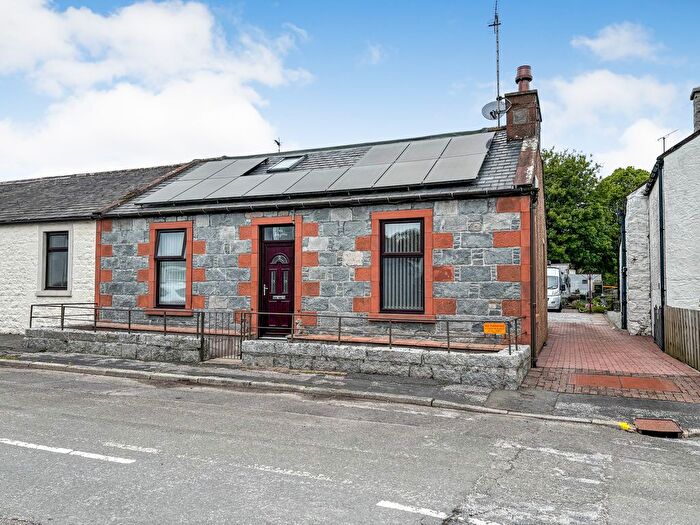
Properties for sale in Dumfries
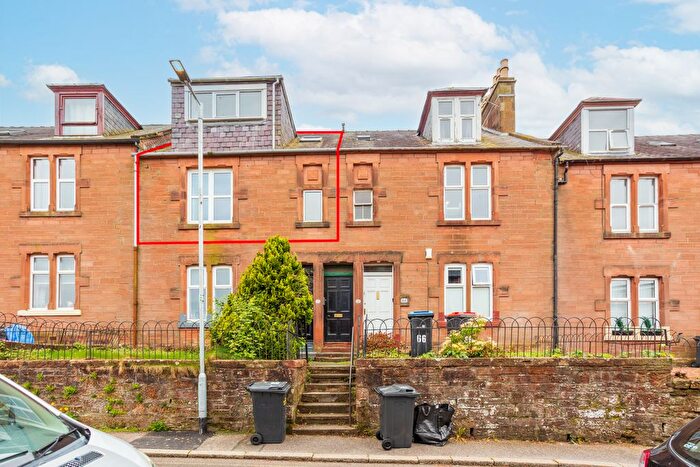
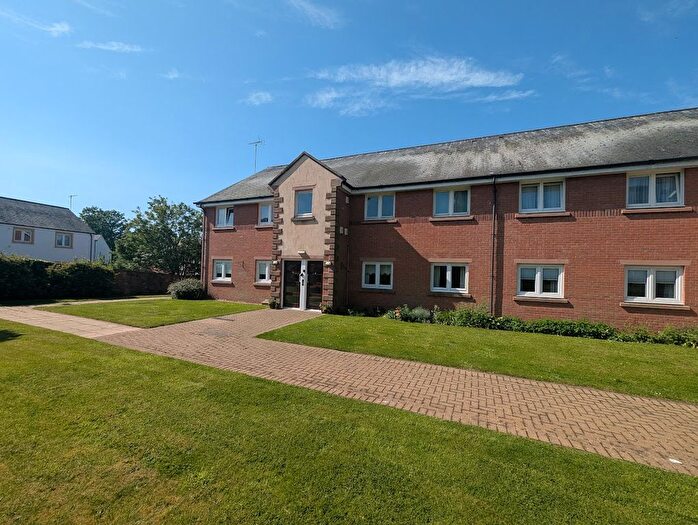
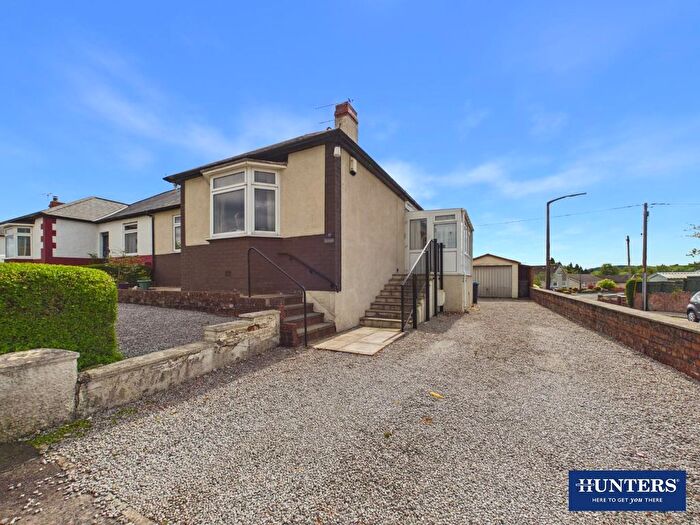
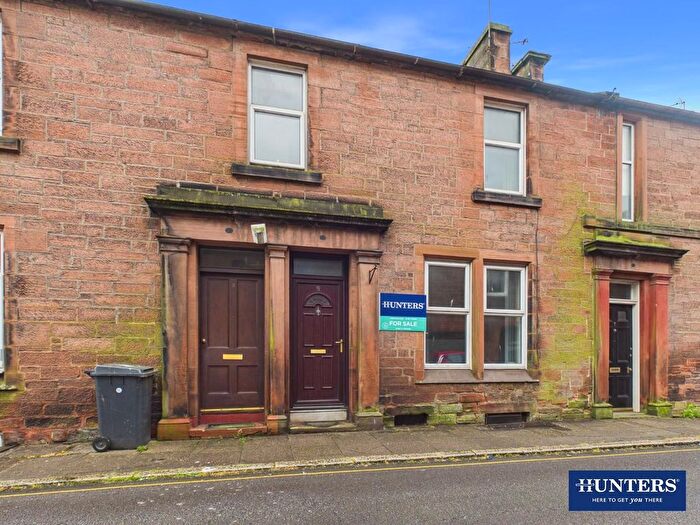
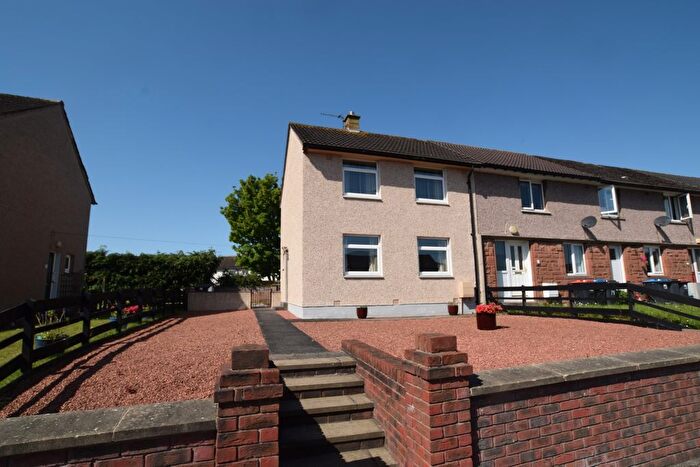
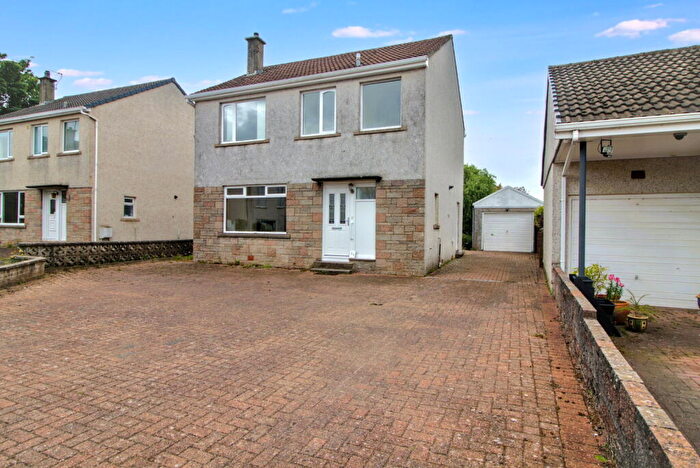
![]()
If you are looking to sell your house, let it out, or receive a property valuation, an expert can help you.
Click the button below to get started.

Neighbourhoods in Dumfries
Navigate through our locations to find the location of your next house in Dumfries, Dumfries and Galloway for sale or to rent.
Transport in Dumfries
Please see below transportation links in this area:

- FAQ
- Price Paid By Year
Frequently asked questions about Dumfries
What is the average price for a property for sale in Dumfries?
The average price for a property for sale in Dumfries is £151,768. This amount is 3% lower than the average price in Dumfries and Galloway. There are 5,347 property listings for sale in Dumfries.
What locations have the most expensive properties for sale in Dumfries?
The locations with the most expensive properties for sale in Dumfries are Mid and Upper Nithsdale at an average of £326,000, Annandale South at an average of £245,625 and Castle Douglas and Crocketford at an average of £224,100.
What locations have the most affordable properties for sale in Dumfries?
The locations with the most affordable properties for sale in Dumfries are North West Dumfries at an average of £130,500, Nith at an average of £138,597 and New Abbey at an average of £141,555.
Which train stations are available in or near Dumfries?
Some of the train stations available in or near Dumfries are Dumfries, Lockerbie and Annan.
Property Price Paid in Dumfries by Year
The average sold property price by year was:
| Year | Average Sold Price | Price Change |
Sold Properties
|
|---|---|---|---|
| 2025 | £150,196 | -2% |
343 Properties |
| 2024 | £153,140 | 1% |
357 Properties |
| 2023 | £151,893 | -15% |
399 Properties |
| 2022 | £174,641 | 11% |
769 Properties |
| 2021 | £155,997 | 5% |
927 Properties |
| 2020 | £148,803 | 4% |
718 Properties |
| 2019 | £142,484 | -2% |
930 Properties |
| 2018 | £145,848 | 8% |
874 Properties |
| 2017 | £134,577 | -0,3% |
795 Properties |
| 2016 | £134,975 | 2% |
770 Properties |
| 2015 | £132,104 | -3% |
757 Properties |
| 2014 | £135,979 | 5% |
705 Properties |
| 2013 | £129,051 | -4% |
700 Properties |
| 2012 | £134,623 | 7% |
630 Properties |
| 2011 | £125,775 | -3% |
611 Properties |
| 2010 | £129,521 | 3% |
620 Properties |
| 2009 | £125,793 | -6% |
584 Properties |
| 2008 | £132,845 | -623% |
725 Properties |
| 2007 | £960,202 | 86% |
1,064 Properties |
| 2006 | £131,040 | -922% |
1,044 Properties |
| 2005 | £1,339,110 | 90% |
1,073 Properties |
| 2004 | £136,667 | 27% |
1,199 Properties |
| 2003 | £100,314 | 39% |
1,238 Properties |
| 2002 | £61,659 | 13% |
1,273 Properties |
| 2001 | £53,347 | - |
104 Properties |