
Houses for sale & to rent in Annandale North, Lockerbie
House Prices in Annandale North
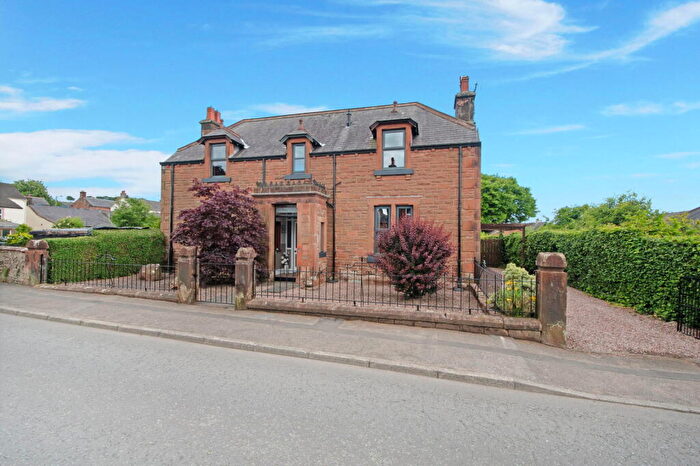
Properties in Annandale North have an average house price of £165k and had 189 Property Transactions within the last 3 years¹.
Annandale North is an area in Lockerbie, Dumfries and Galloway with 4,620 households², where the most expensive property was sold for £532k.
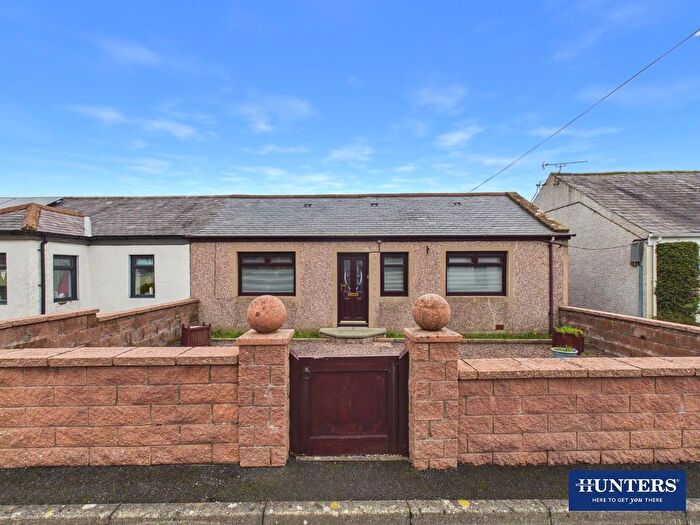
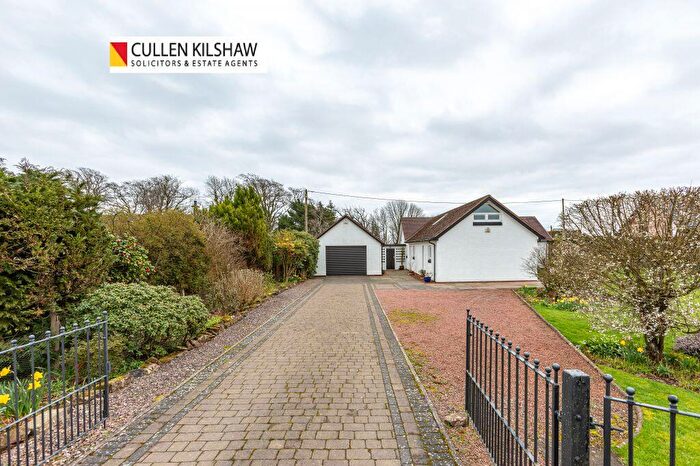
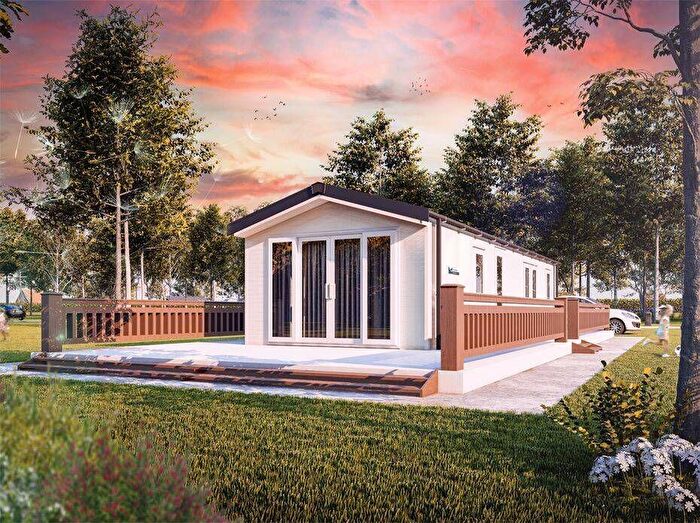
Properties for sale in Annandale North
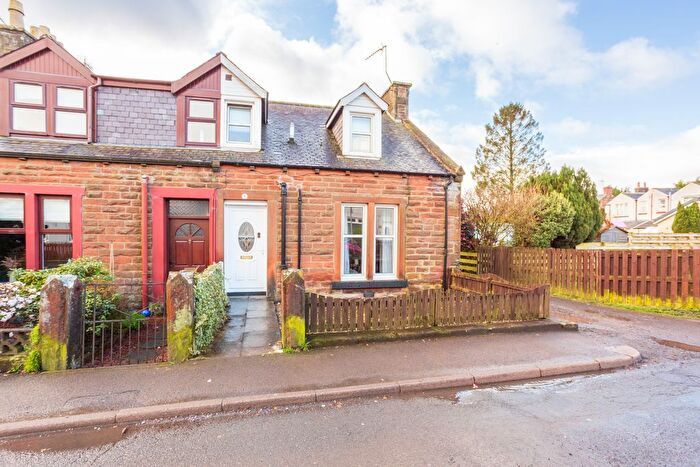
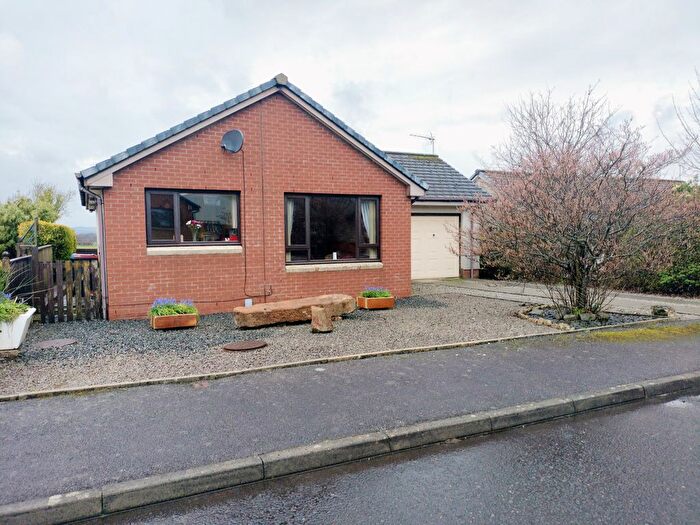
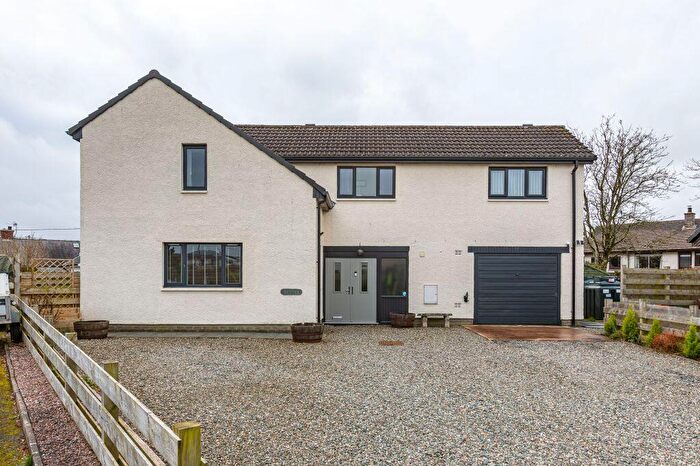
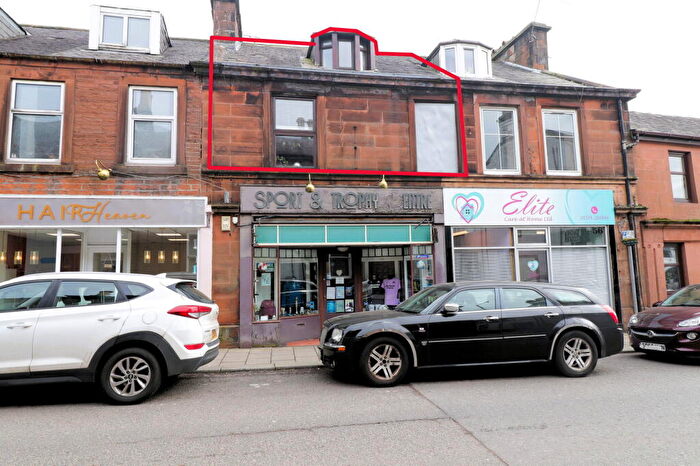
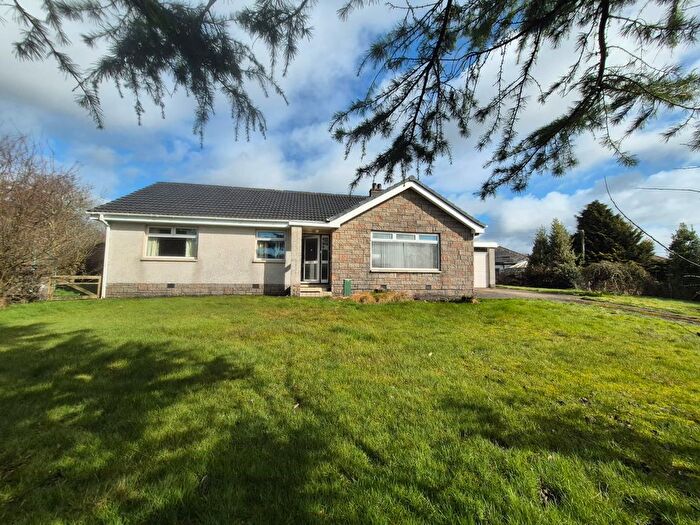
![]()
If you are looking to sell your house, let it out, or receive a property valuation, an expert can help you.
Click the button below to get started.
Roads and Postcodes in Annandale North
Navigate through our locations to find the location of your next house in Annandale North, Lockerbie for sale or to rent.
Transport near Annandale North

- FAQ
- Price Paid By Year
Frequently asked questions about Annandale North
What is the average price for a property for sale in Annandale North?
The average price for a property for sale in Annandale North is £165,275. This amount is 0.58% lower than the average price in Lockerbie. There are 1,672 property listings for sale in Annandale North.
What streets have the most expensive properties for sale in Annandale North?
The streets with the most expensive properties for sale in Annandale North are Woodlands Drive at an average of £320,000, High Road at an average of £305,000 and Eskrigg Place at an average of £300,000.
What streets have the most affordable properties for sale in Annandale North?
The streets with the most affordable properties for sale in Annandale North are Oak Tree Drive at an average of £67,600, Dryfesdale Court at an average of £70,000 and Broomhouse Road at an average of £76,000.
Which train stations are available in or near Annandale North?
Some of the train stations available in or near Annandale North are Lockerbie, Dumfries and Annan.
Property Price Paid in Annandale North by Year
The average sold property price by year was:
| Year | Average Sold Price | Price Change |
Sold Properties
|
|---|---|---|---|
| 2025 | £180,944 | 21% |
61 Properties |
| 2024 | £142,615 | -21% |
62 Properties |
| 2023 | £172,080 | -6% |
66 Properties |
| 2022 | £182,884 | 9% |
133 Properties |
| 2021 | £165,998 | 18% |
163 Properties |
| 2020 | £135,996 | -9% |
123 Properties |
| 2019 | £148,838 | 5% |
159 Properties |
| 2018 | £140,668 | -0,2% |
170 Properties |
| 2017 | £140,892 | -2% |
156 Properties |
| 2016 | £143,296 | 2% |
157 Properties |
| 2015 | £139,960 | 6% |
137 Properties |
| 2014 | £132,207 | -11% |
113 Properties |
| 2013 | £147,217 | -2% |
149 Properties |
| 2012 | £149,542 | 15% |
144 Properties |
| 2011 | £127,780 | -25% |
132 Properties |
| 2010 | £160,277 | 6% |
92 Properties |
| 2009 | £150,437 | -11% |
105 Properties |
| 2008 | £166,575 | 21% |
147 Properties |
| 2007 | £132,118 | 3% |
174 Properties |
| 2006 | £127,860 | -5% |
175 Properties |
| 2005 | £134,134 | 21% |
165 Properties |
| 2004 | £106,353 | 31% |
205 Properties |
| 2003 | £73,279 | 13% |
186 Properties |
| 2002 | £63,912 | 25% |
217 Properties |
| 2001 | £47,743 | - |
17 Properties |