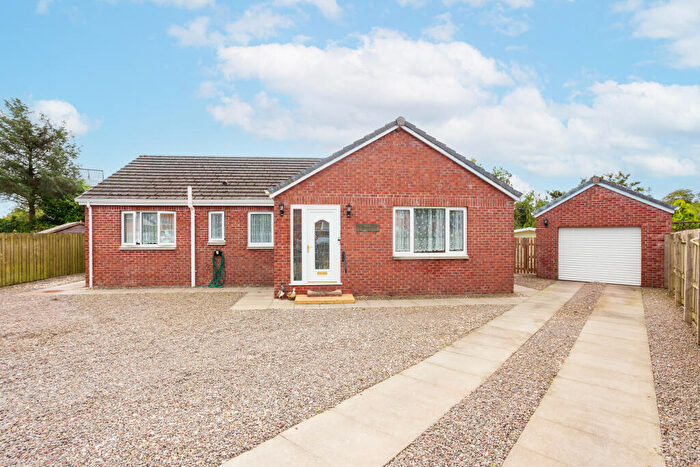
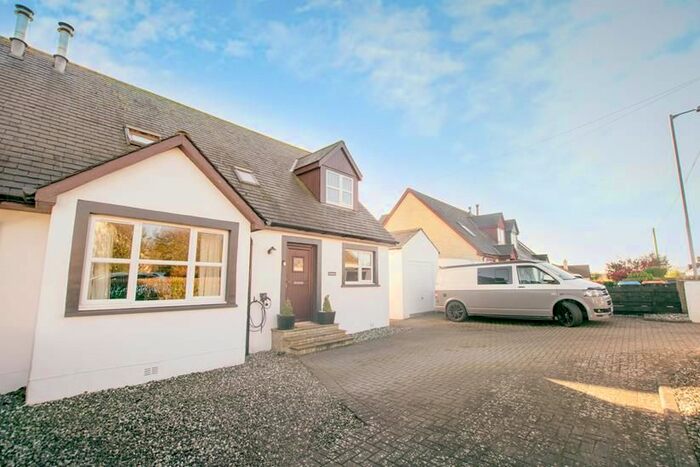
Houses for sale & to rent in Annandale South, Dumfries
House Prices in Annandale South
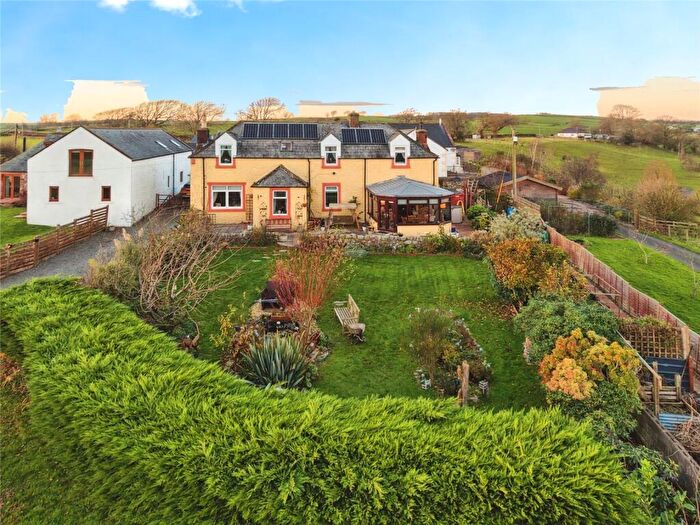
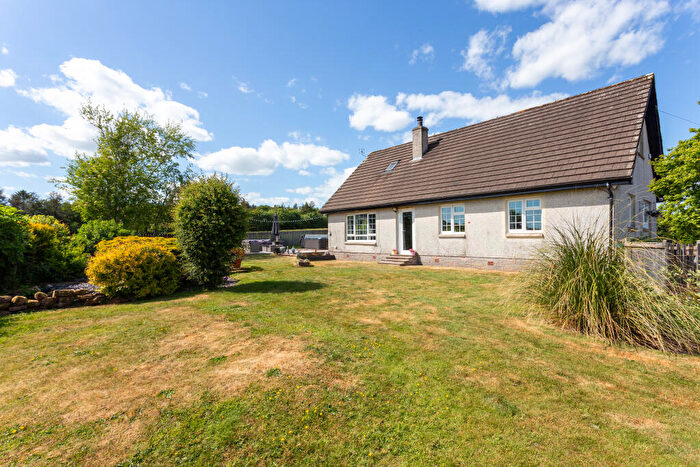
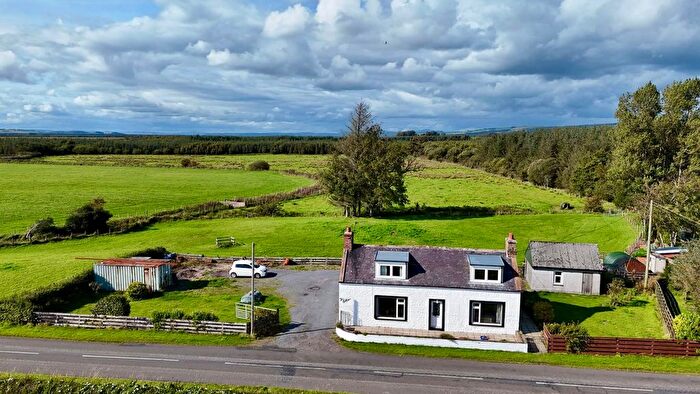
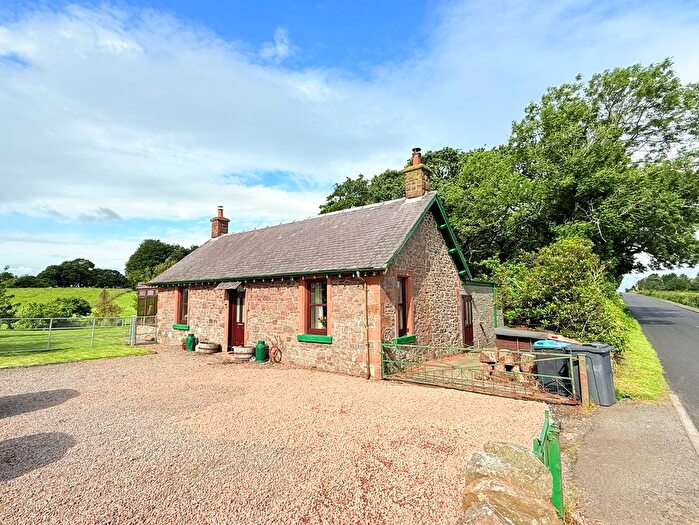
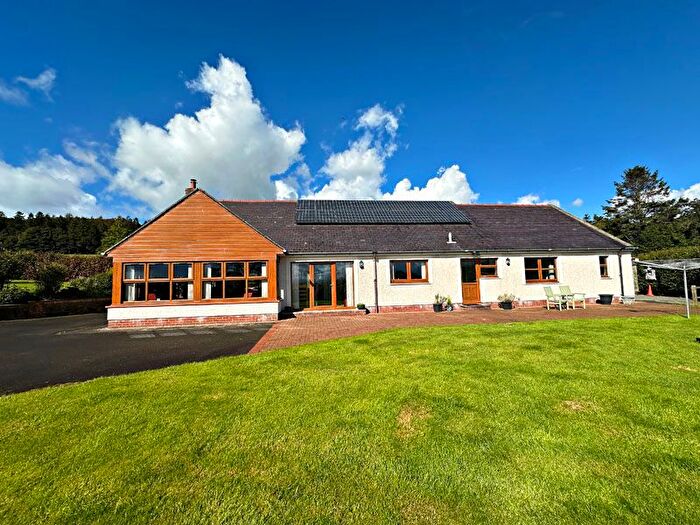
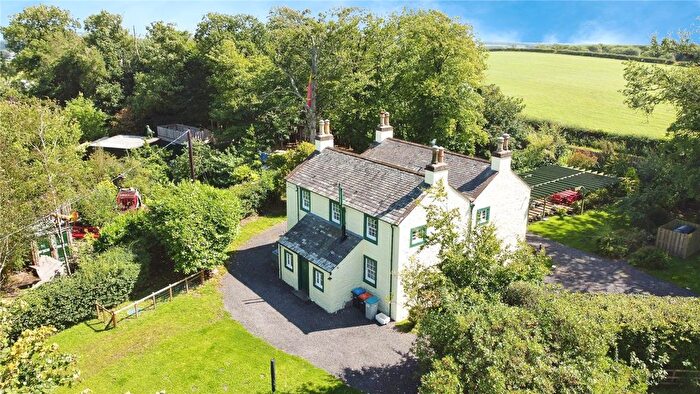
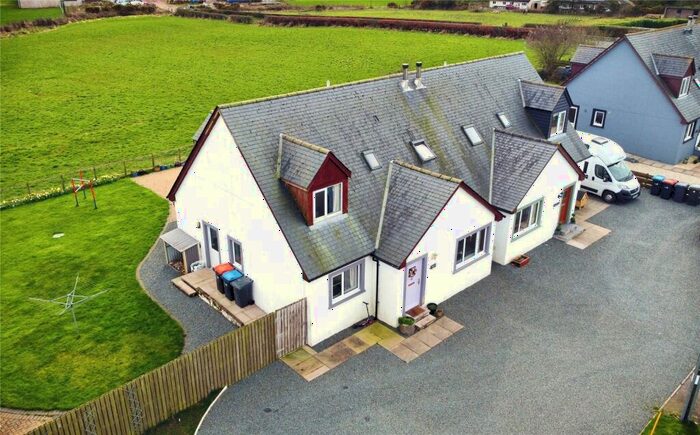
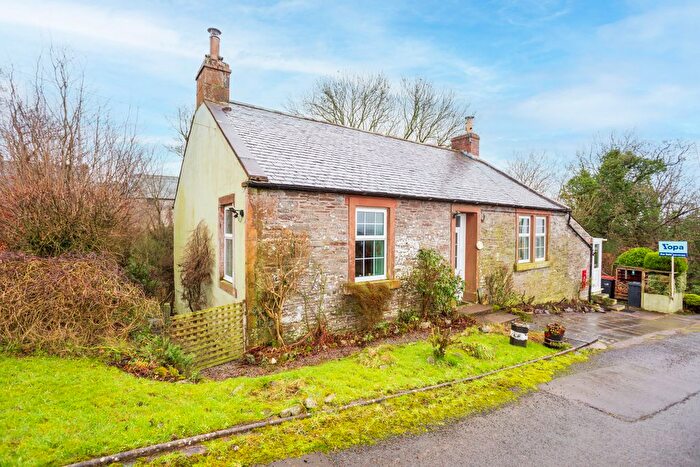
Properties in Annandale South have an average house price of £244,250.00 and had 4 Property Transactions within the last 3 years¹.
Annandale South is an area in Dumfries, Dumfries and Galloway with 466 households², where the most expensive property was sold for £320,000.00.
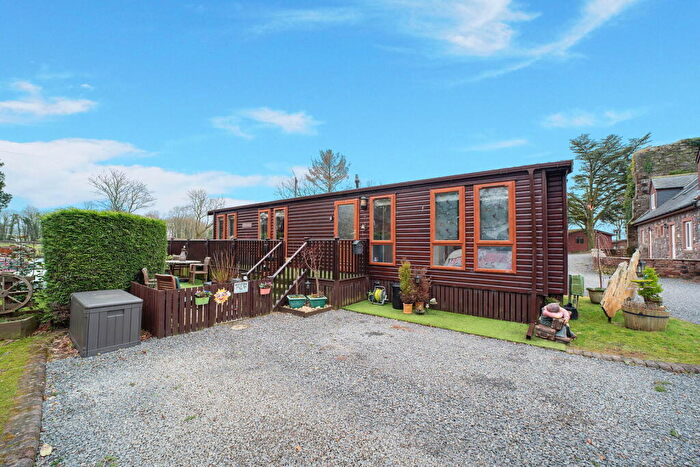
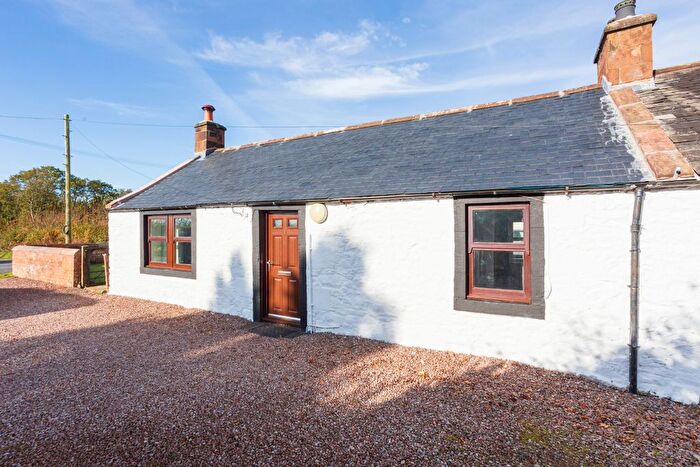
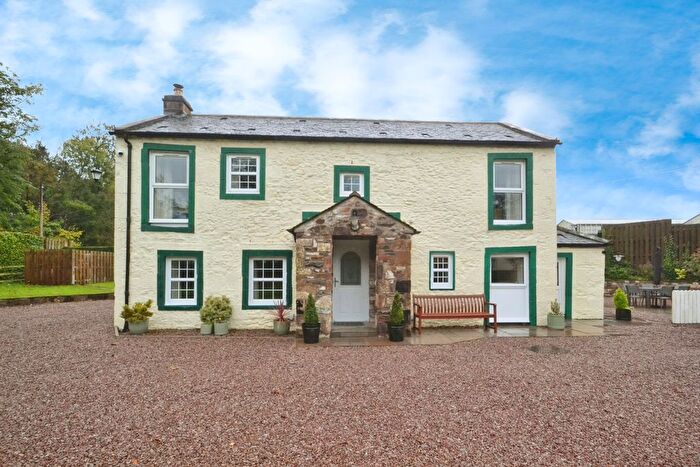
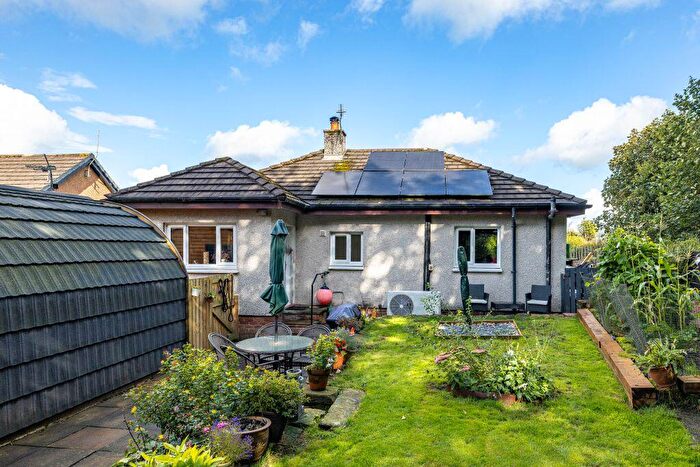
Properties for sale in Annandale South
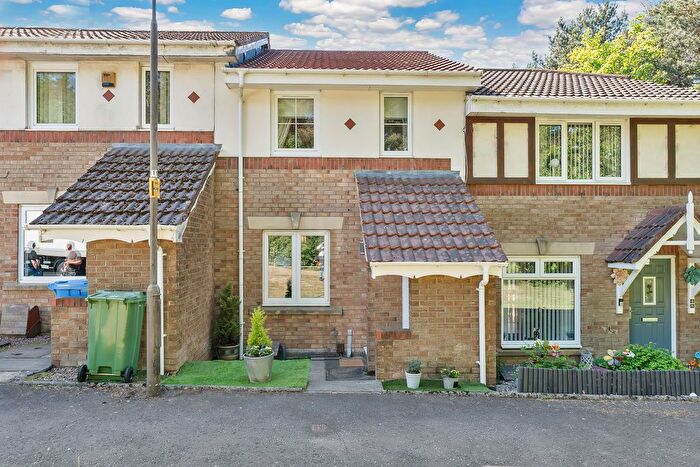
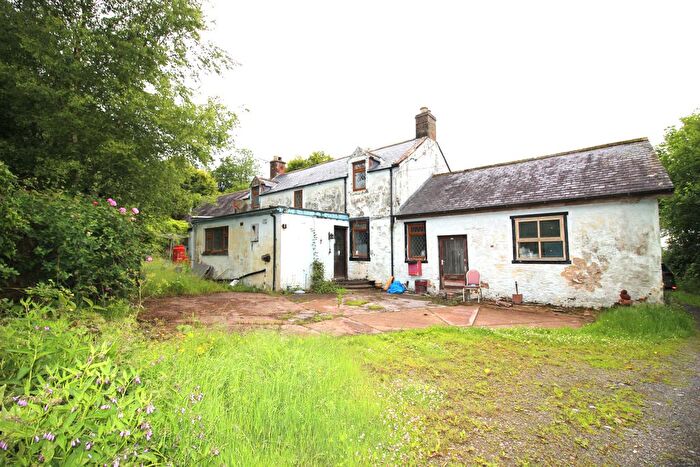
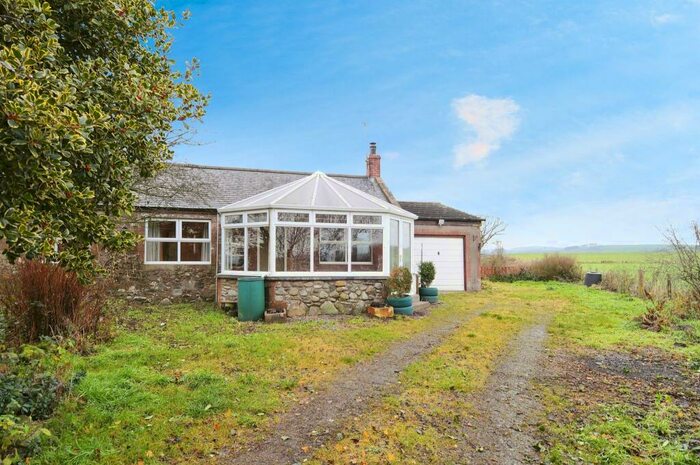
Previously listed properties in Annandale South
Roads and Postcodes in Annandale South
Navigate through our locations to find the location of your next house in Annandale South, Dumfries for sale or to rent.
| Streets | Postcodes |
|---|---|
| Bankend | DG1 4RN |
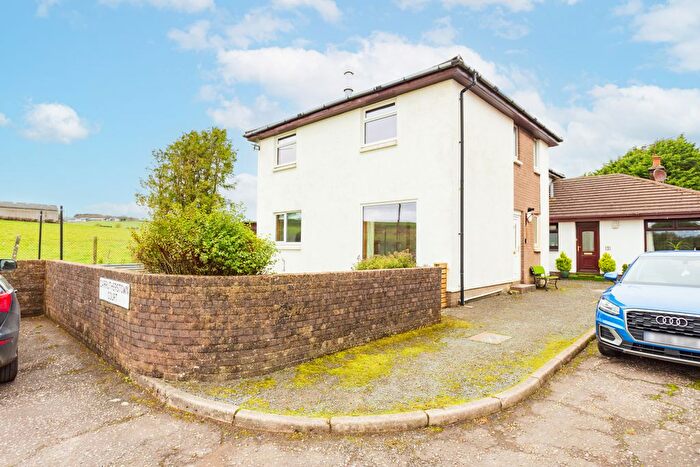
| Carrutherstown Court | DG1 4LJ |
| Herdel Road | DG1 4JZ |
| Kirkbeck Road | DG1 4ND |
| Quarry Place | DG1 4NE |
| Runic Place | DG1 4NW |
| Whitehill Road | DG1 4LA |
| Woodside Avenue | DG1 4GD |
| DG1 4JP DG1 4JR DG1 4JS DG1 4JT DG1 4JU DG1 4JX DG1 4LD DG1 4LF DG1 4LG DG1 4LQ DG1 4LT DG1 4LU DG1 4LX DG1 4LY DG1 4LZ DG1 4NA DG1 4NF DG1 4NG DG1 4NH DG1 4NJ DG1 4NL DG1 4NN DG1 4NP DG1 4NQ DG1 4NR DG1 4NS DG1 4NT DG1 4NU DG1 4NX DG1 4NY DG1 4NZ DG1 4PX DG1 4PY DG1 4PZ DG1 4QA DG1 4QB |
Transport near Annandale South
- FAQ
- Price Paid By Year
Frequently asked questions about Annandale South
What is the average price for a property for sale in Annandale South?
The average price for a property for sale in Annandale South is £244,250. This amount is 49% higher than the average price in Dumfries. There are 63 property listings for sale in Annandale South.
Which train stations are available in or near Annandale South?
Some of the train stations available in or near Annandale South are Dumfries, Annan and Lockerbie.
Property Price Paid in Annandale South by Year
The average sold property price by year was:
| Year | Average Sold Price | Price Change |
Sold Properties
|
|---|---|---|---|
| 2023 | £244,250 | 8% |
4 Properties |
| 2022 | £224,850 | -27% |
10 Properties |
| 2021 | £286,019 | 49% |
13 Properties |
| 2020 | £144,923 | -15% |
13 Properties |
| 2019 | £167,086 | -10% |
9 Properties |
| 2018 | £183,093 | -11% |
16 Properties |
| 2017 | £202,562 | 26% |
8 Properties |
| 2016 | £149,025 | -27% |
20 Properties |
| 2015 | £189,041 | 33% |
12 Properties |
| 2014 | £126,705 | -54% |
17 Properties |
| 2013 | £194,880 | 8% |
13 Properties |
| 2012 | £179,714 | 15% |
7 Properties |
| 2011 | £152,782 | -11% |
14 Properties |
| 2010 | £170,154 | 19% |
11 Properties |
| 2009 | £138,507 | 25% |
14 Properties |
| 2008 | £104,272 | -102% |
11 Properties |
| 2007 | £210,835 | 18% |
19 Properties |
| 2006 | £173,540 | 9% |
14 Properties |
| 2005 | £158,207 | 9% |
17 Properties |
| 2004 | £144,669 | 19% |
21 Properties |
| 2003 | £117,238 | 30% |
26 Properties |
| 2002 | £81,834 | 21% |
28 Properties |
| 2001 | £65,000 | - |
4 Properties |

