
Houses for sale & to rent in Kilmarnock, East Ayrshire
House Prices in Kilmarnock
Properties in Kilmarnock have an average house price of £149k and had 2,119 Property Transactions within the last 3 years.¹
Kilmarnock is an area in East Ayrshire with 30,135 households², where the most expensive property was sold for £925k.
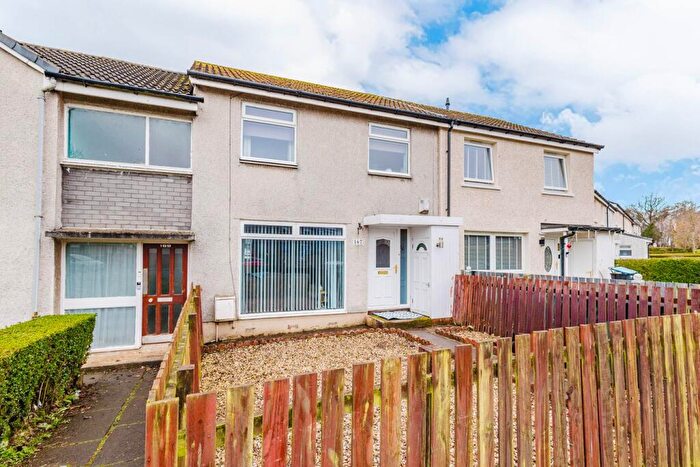
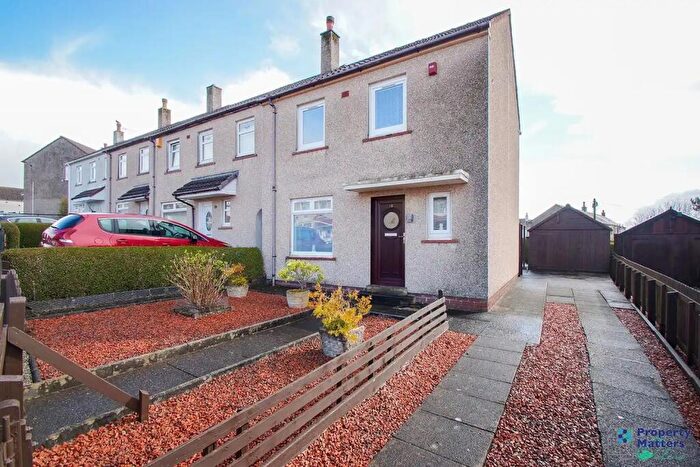
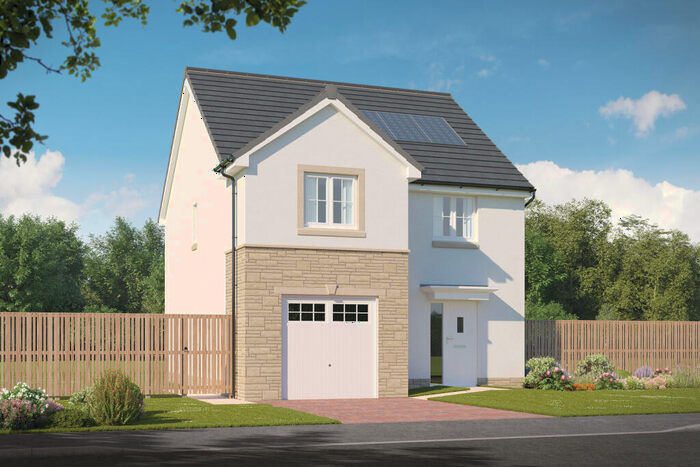
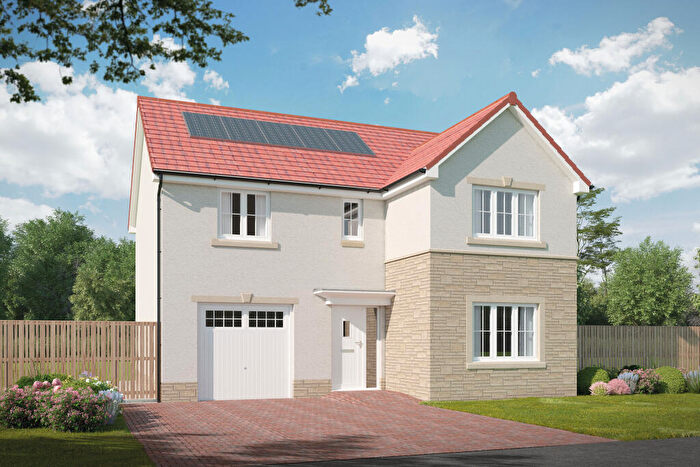
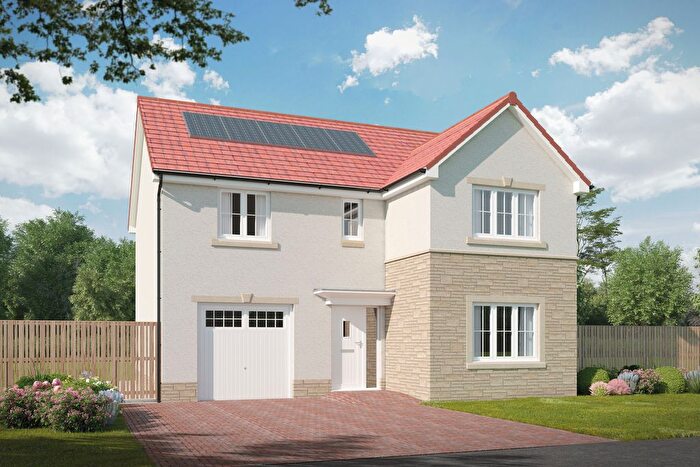
Properties for sale in Kilmarnock


![]()
If you are looking to sell your house, let it out, or receive a property valuation, an expert can help you.
Click the button below to get started.


Neighbourhoods in Kilmarnock
Navigate through our locations to find the location of your next house in Kilmarnock, East Ayrshire for sale or to rent.
Transport in Kilmarnock
Please see below transportation links in this area:

- FAQ
- Price Paid By Year
Frequently asked questions about Kilmarnock
What is the average price for a property for sale in Kilmarnock?
The average price for a property for sale in Kilmarnock is £148,667. This amount is 10% higher than the average price in East Ayrshire. There are 7,867 property listings for sale in Kilmarnock.
What locations have the most expensive properties for sale in Kilmarnock?
The locations with the most expensive properties for sale in Kilmarnock are Ballochmyle at an average of £455,000, Annick at an average of £203,141 and Kilmarnock North at an average of £163,598.
What locations have the most affordable properties for sale in Kilmarnock?
The locations with the most affordable properties for sale in Kilmarnock are Kilmarnock South at an average of £98,127, Kilmarnock East and Hurlford at an average of £126,112 and Kilmarnock West and Crosshouse at an average of £140,307.
Which train stations are available in or near Kilmarnock?
Some of the train stations available in or near Kilmarnock are Kilmarnock, Kilmaurs and Stewarton.
Property Price Paid in Kilmarnock by Year
The average sold property price by year was:
| Year | Average Sold Price | Price Change |
Sold Properties
|
|---|---|---|---|
| 2025 | £154,273 | 2% |
695 Properties |
| 2024 | £151,213 | 7% |
684 Properties |
| 2023 | £141,047 | -10% |
740 Properties |
| 2022 | £154,846 | 12% |
1,233 Properties |
| 2021 | £136,639 | 2% |
1,388 Properties |
| 2020 | £134,024 | 5% |
1,040 Properties |
| 2019 | £126,782 | -6% |
1,294 Properties |
| 2018 | £134,606 | -1% |
1,310 Properties |
| 2017 | £136,624 | 7% |
1,382 Properties |
| 2016 | £126,619 | 4% |
1,310 Properties |
| 2015 | £121,600 | 5% |
1,121 Properties |
| 2014 | £115,727 | 1% |
1,093 Properties |
| 2013 | £114,068 | -4% |
988 Properties |
| 2012 | £118,329 | -6% |
925 Properties |
| 2011 | £125,753 | 1% |
804 Properties |
| 2010 | £124,057 | -0,3% |
787 Properties |
| 2009 | £124,443 | -13% |
834 Properties |
| 2008 | £141,158 | 9% |
1,335 Properties |
| 2007 | £128,838 | 11% |
1,839 Properties |
| 2006 | £115,267 | 13% |
1,971 Properties |
| 2005 | £100,527 | 2% |
1,844 Properties |
| 2004 | £98,924 | 32% |
1,788 Properties |
| 2003 | £67,190 | -38% |
1,919 Properties |
| 2002 | £92,838 | 36% |
1,823 Properties |
| 2001 | £59,459 | - |
151 Properties |