
Houses for sale & to rent in Haddington and Lammermuir, Haddington
House Prices in Haddington and Lammermuir
Properties in Haddington and Lammermuir have an average house price of £283,353.00 and had 285 Property Transactions within the last 3 years¹.
Haddington and Lammermuir is an area in Haddington, East Lothian with 5,028 households², where the most expensive property was sold for £997,000.00.
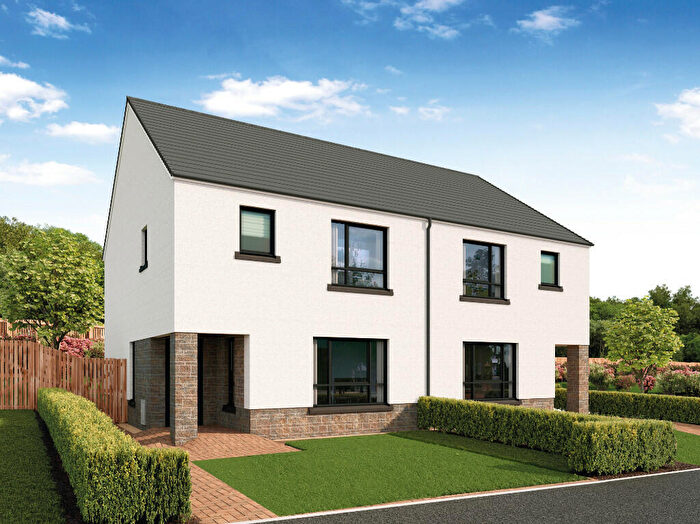
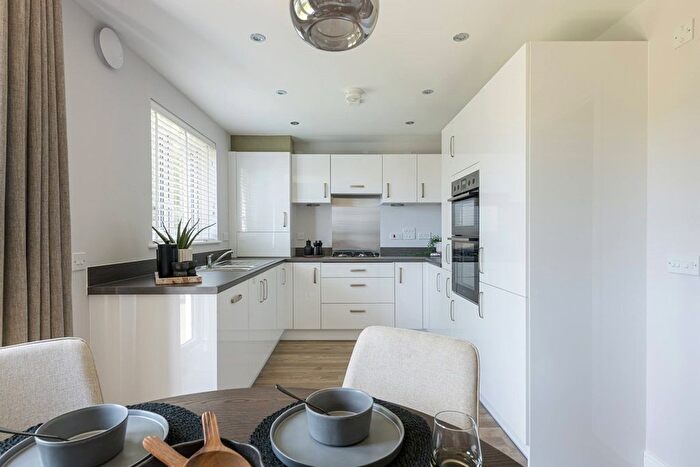
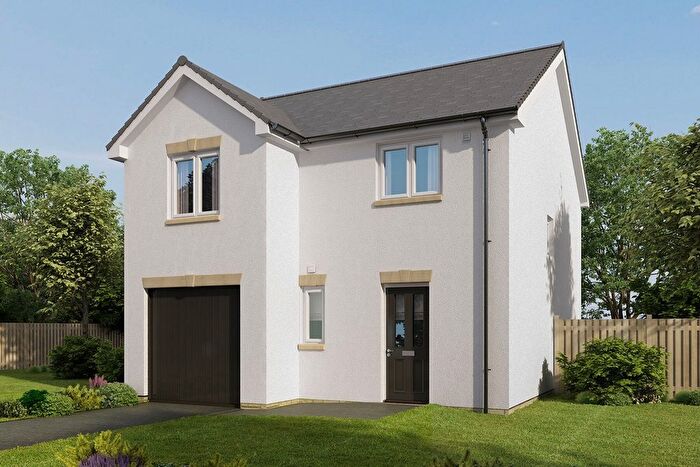
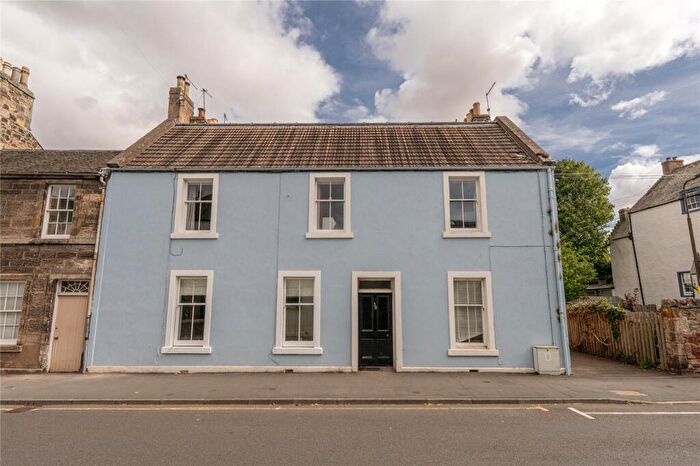
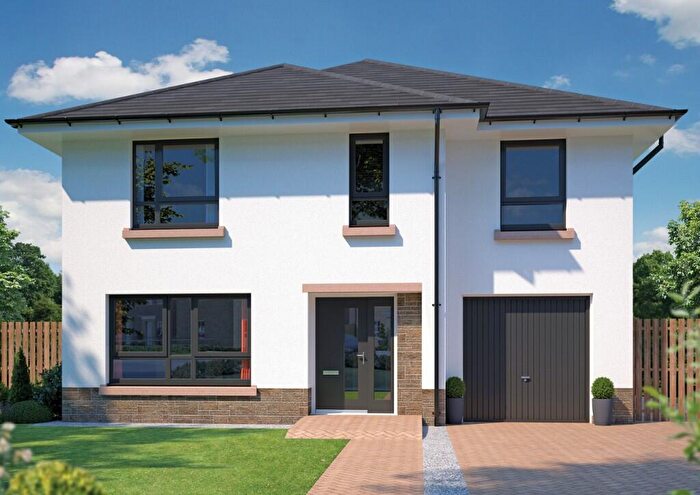
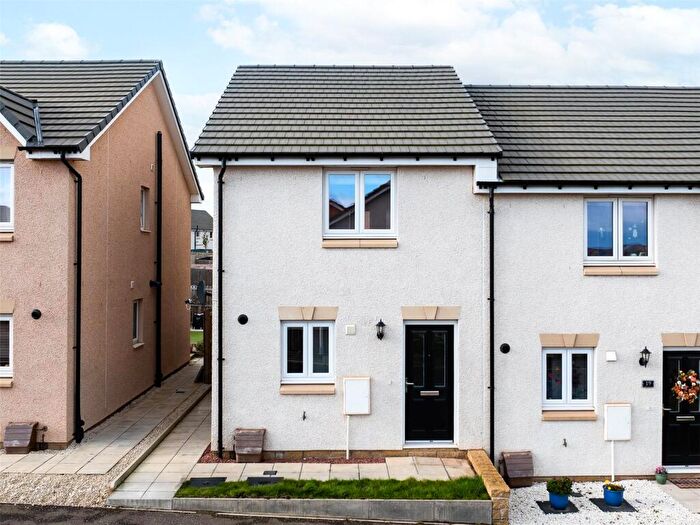
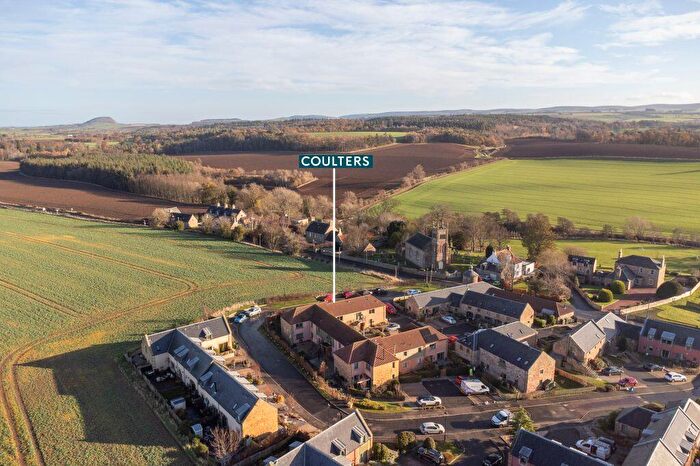
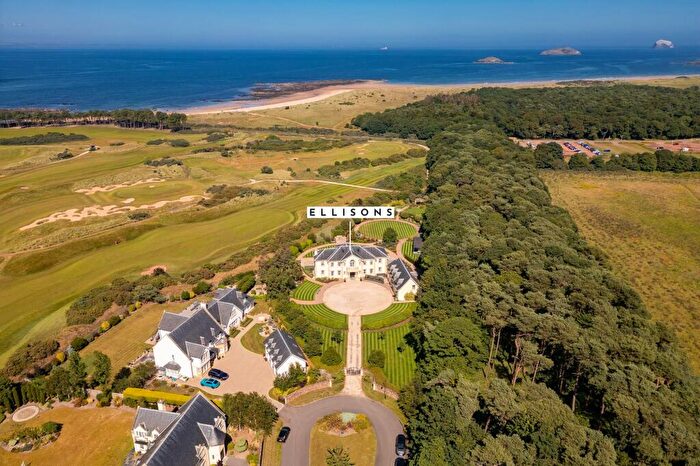
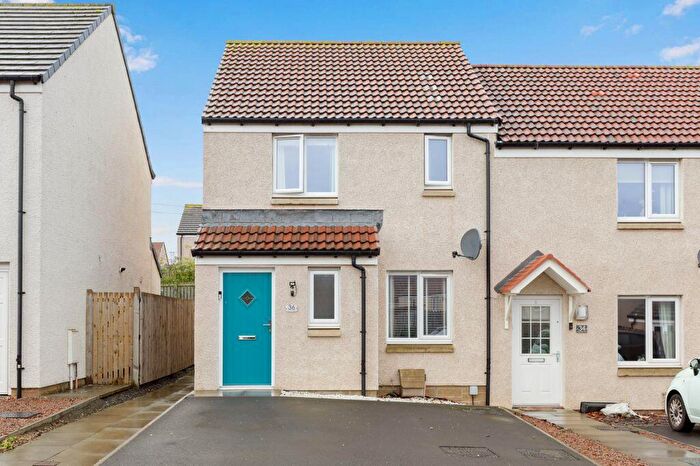
Properties for sale in Haddington and Lammermuir


![]()
If you are looking to sell your house, let it out, or receive a property valuation, an expert can help you.
Click the button below to get started.


Roads and Postcodes in Haddington and Lammermuir
Navigate through our locations to find the location of your next house in Haddington and Lammermuir, Haddington for sale or to rent.
Transport near Haddington and Lammermuir

- FAQ
- Price Paid By Year
Frequently asked questions about Haddington and Lammermuir
What is the average price for a property for sale in Haddington and Lammermuir?
The average price for a property for sale in Haddington and Lammermuir is £283,353. This amount is 3% lower than the average price in Haddington. There are 1,235 property listings for sale in Haddington and Lammermuir.
Which train stations are available in or near Haddington and Lammermuir?
Some of the train stations available in or near Haddington and Lammermuir are Drem, Longniddry and Prestonpans.
Property Price Paid in Haddington and Lammermuir by Year
The average sold property price by year was:
| Year | Average Sold Price | Price Change |
Sold Properties
|
|---|---|---|---|
| 2023 | £270,132 | -6% |
44 Properties |
| 2022 | £285,767 | 2% |
241 Properties |
| 2021 | £281,376 | 1% |
341 Properties |
| 2020 | £277,532 | 5% |
254 Properties |
| 2019 | £264,150 | 5% |
327 Properties |
| 2018 | £250,848 | 7% |
310 Properties |
| 2017 | £232,785 | 4% |
346 Properties |
| 2016 | £223,535 | 1% |
248 Properties |
| 2015 | £222,320 | -6% |
178 Properties |
| 2014 | £234,572 | 5% |
164 Properties |
| 2013 | £223,760 | 15% |
147 Properties |
| 2012 | £189,787 | -0,4% |
129 Properties |
| 2011 | £190,496 | -9% |
112 Properties |
| 2010 | £207,041 | 3% |
130 Properties |
| 2009 | £201,484 | -13% |
118 Properties |
| 2008 | £227,148 | 2% |
157 Properties |
| 2007 | £223,684 | 8% |
240 Properties |
| 2006 | £204,782 | 1% |
248 Properties |
| 2005 | £203,697 | 33% |
289 Properties |
| 2004 | £137,270 | 20% |
197 Properties |
| 2003 | £109,659 | -14% |
221 Properties |
| 2002 | £124,847 | 34% |
314 Properties |
| 2001 | £82,754 | - |
25 Properties |