
Houses for sale & to rent in Haddington, East Lothian
House Prices in Haddington
Properties in Haddington have an average house price of £282k and had 299 Property Transactions within the last 3 years.¹
Haddington is an area in East Lothian with 5,222 households², where the most expensive property was sold for £1.03M.
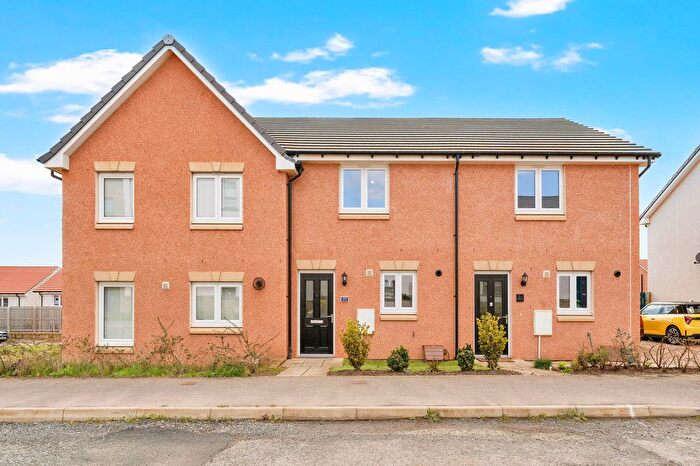
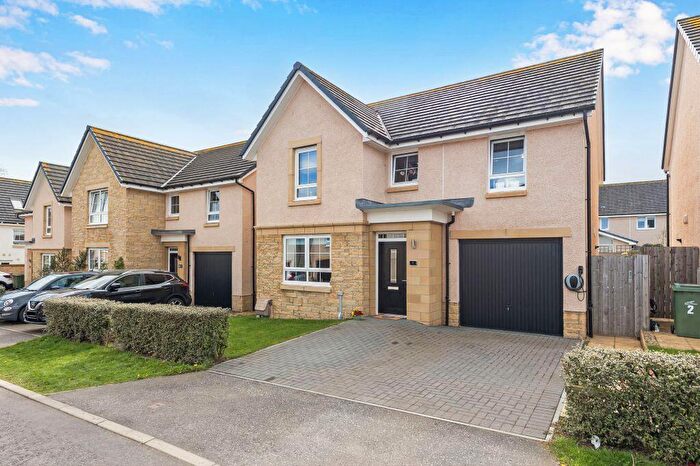
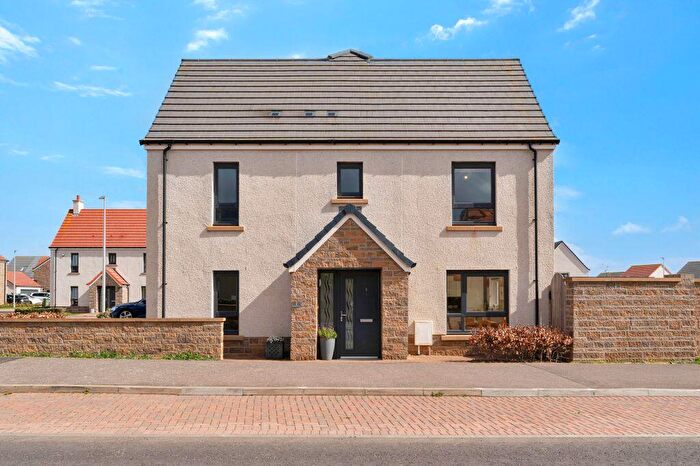
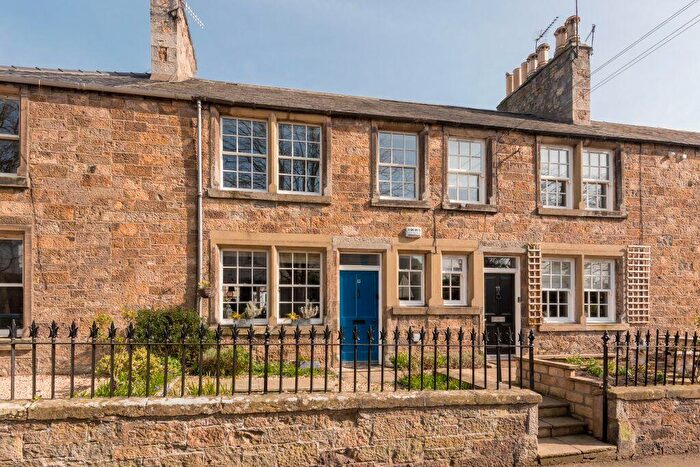
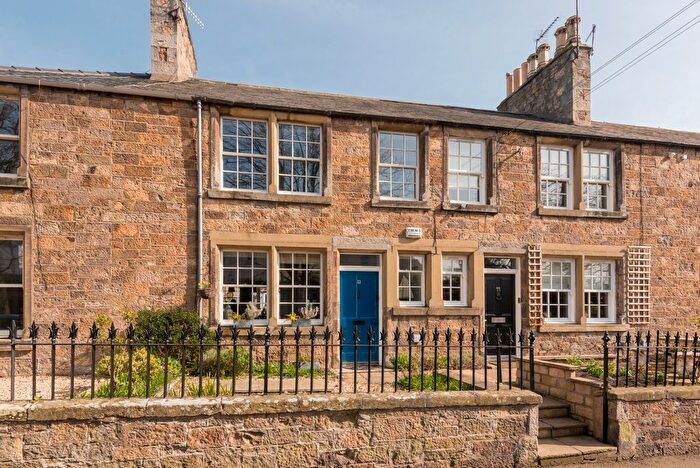
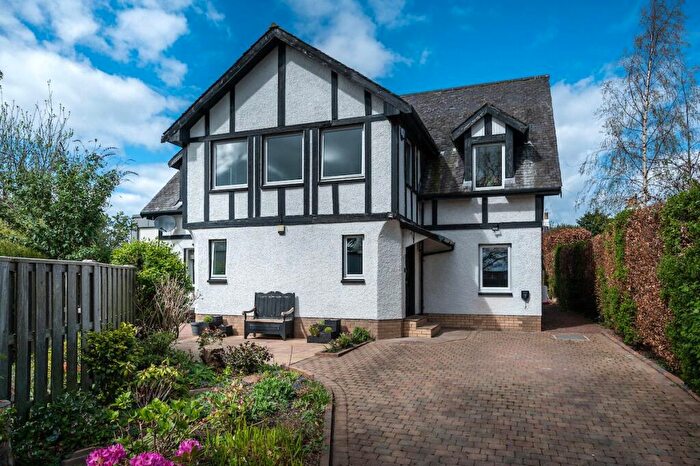
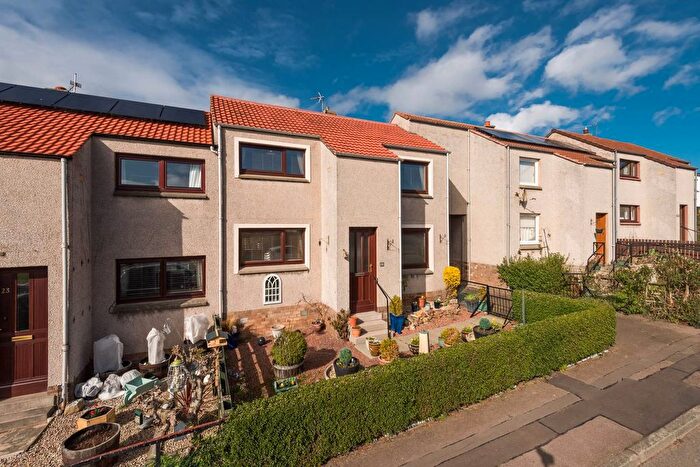
Properties for sale in Haddington
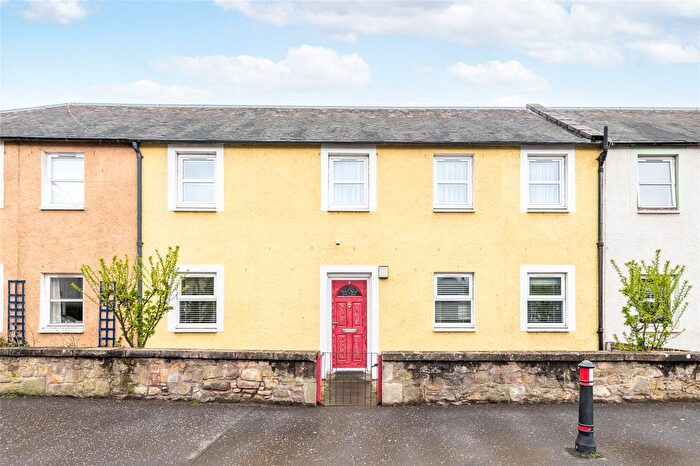


![]()
If you are looking to sell your house, let it out, or receive a property valuation, an expert can help you.
Click the button below to get started.
Neighbourhoods in Haddington
Navigate through our locations to find the location of your next house in Haddington, East Lothian for sale or to rent.
Transport in Haddington
Please see below transportation links in this area:

- FAQ
- Price Paid By Year
Frequently asked questions about Haddington
What is the average price for a property for sale in Haddington?
The average price for a property for sale in Haddington is £281,563. This amount is 2% lower than the average price in East Lothian. There are 1,338 property listings for sale in Haddington.
What locations have the most expensive properties for sale in Haddington?
The location with the most expensive properties for sale in Haddington is Dunbar and East Linton at an average of £411,000.
What locations have the most affordable properties for sale in Haddington?
The location with the most affordable properties for sale in Haddington is Haddington and Lammermuir at an average of £281,031.
Which train stations are available in or near Haddington?
Some of the train stations available in or near Haddington are Drem, Longniddry and Prestonpans.
Property Price Paid in Haddington by Year
The average sold property price by year was:
| Year | Average Sold Price | Price Change |
Sold Properties
|
|---|---|---|---|
| 2025 | £284,357 | 5% |
97 Properties |
| 2024 | £271,463 | -6% |
90 Properties |
| 2023 | £287,259 | -6% |
112 Properties |
| 2022 | £305,387 | 8% |
252 Properties |
| 2021 | £282,292 | 1% |
350 Properties |
| 2020 | £279,886 | 6% |
267 Properties |
| 2019 | £264,128 | 5% |
336 Properties |
| 2018 | £250,016 | 7% |
328 Properties |
| 2017 | £232,418 | 4% |
377 Properties |
| 2016 | £223,528 | -1% |
269 Properties |
| 2015 | £226,591 | -6% |
181 Properties |
| 2014 | £239,452 | 4% |
175 Properties |
| 2013 | £230,917 | 18% |
155 Properties |
| 2012 | £189,569 | -0,2% |
133 Properties |
| 2011 | £189,968 | -14% |
118 Properties |
| 2010 | £215,629 | 0,5% |
142 Properties |
| 2009 | £214,580 | -8% |
124 Properties |
| 2008 | £231,598 | 5% |
175 Properties |
| 2007 | £220,614 | 7% |
270 Properties |
| 2006 | £206,008 | -0,3% |
271 Properties |
| 2005 | £206,600 | 32% |
301 Properties |
| 2004 | £140,665 | 22% |
206 Properties |
| 2003 | £109,977 | -16% |
225 Properties |
| 2002 | £127,632 | 35% |
326 Properties |
| 2001 | £82,754 | - |
25 Properties |