
Houses for sale in East Lothian, Scotland
House Prices in East Lothian
Properties in East Lothian have
an average house price of
£287k
and had 2,893 Property Transactions
within the last 3 years.¹
East Lothian is a location in
Scotland with
42,864 households², where the most expensive property was sold for £3M.
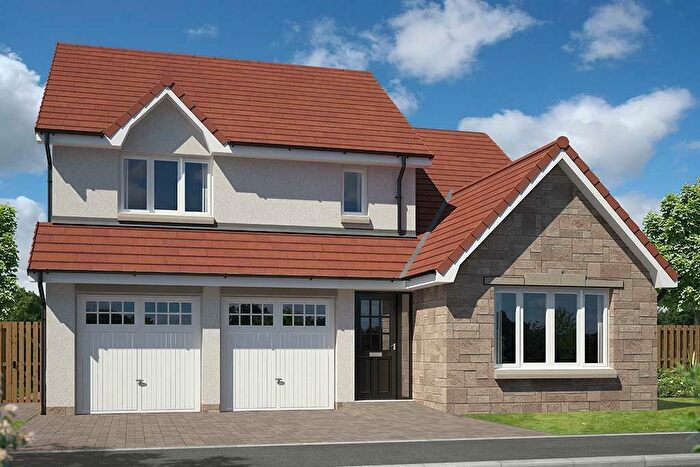
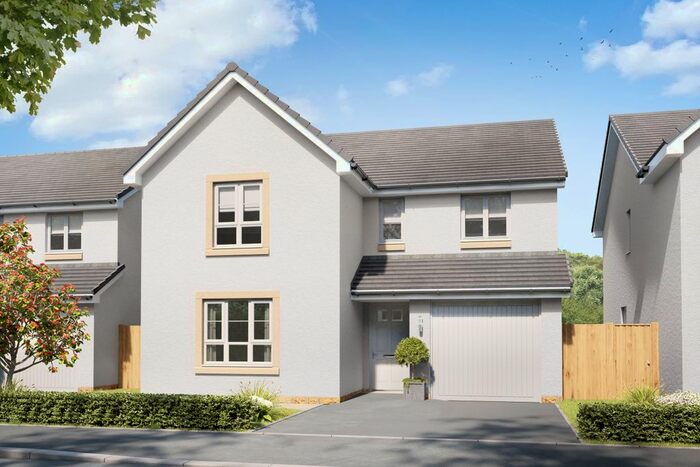
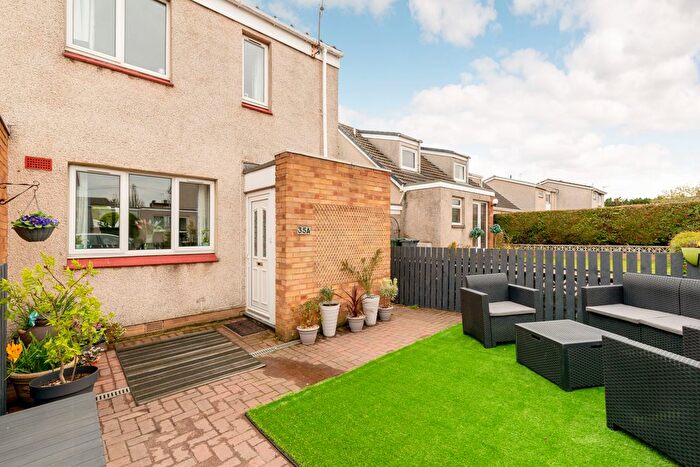
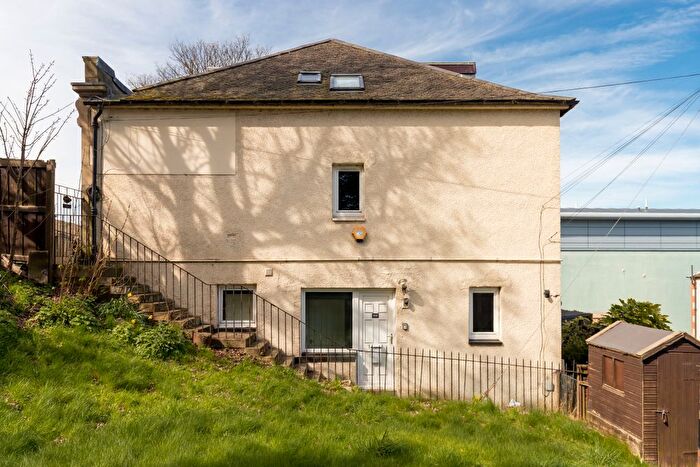
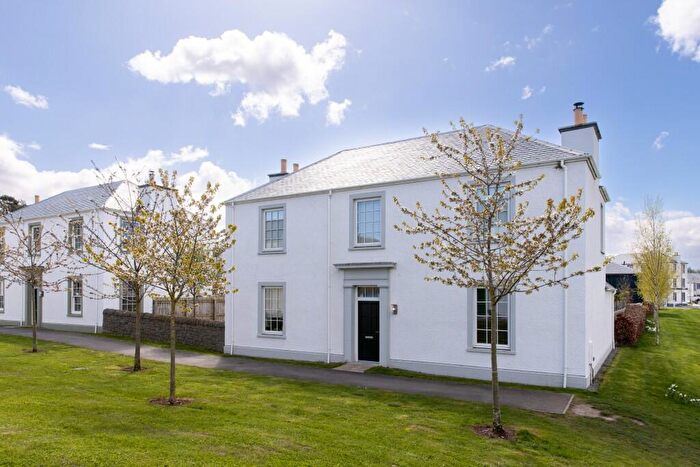
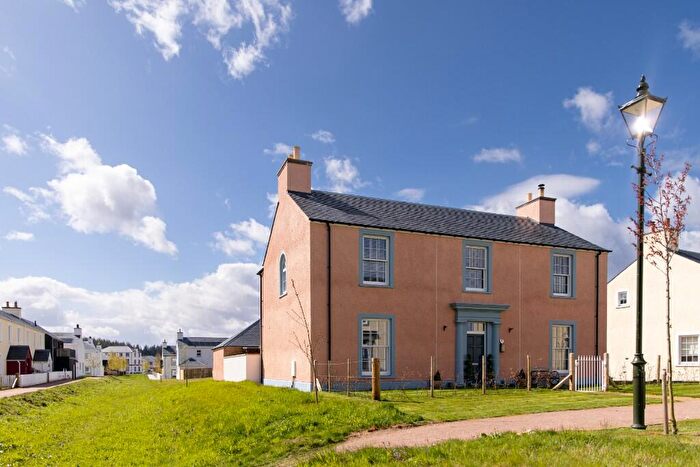
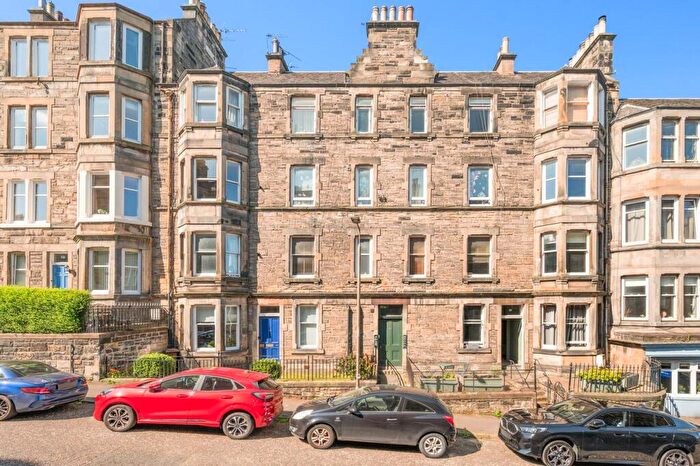
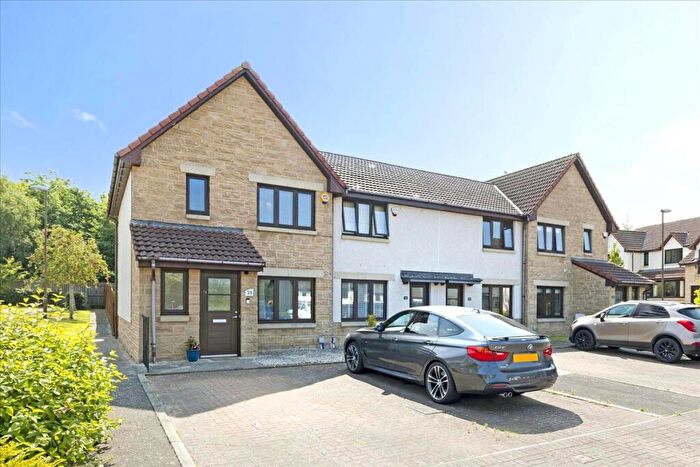
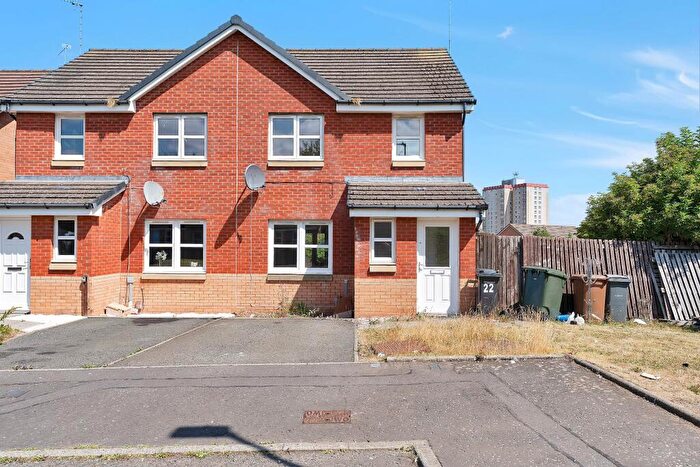
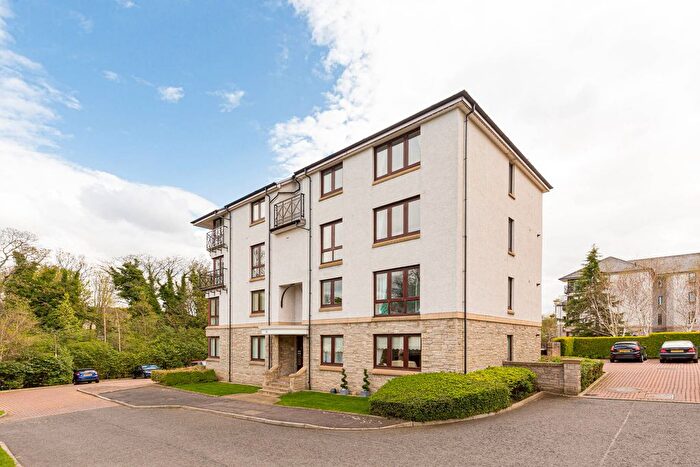
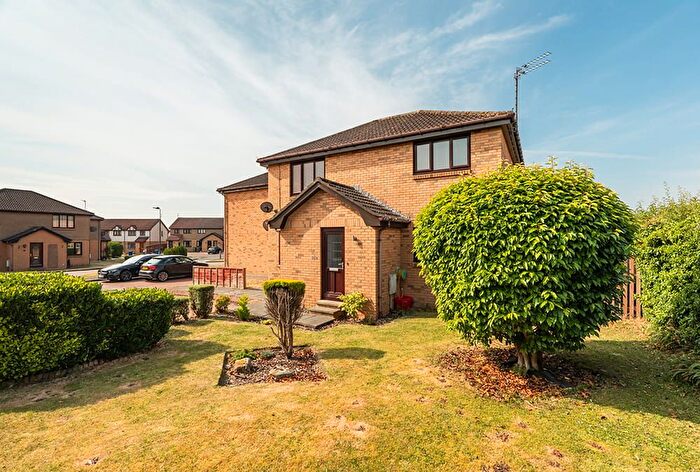
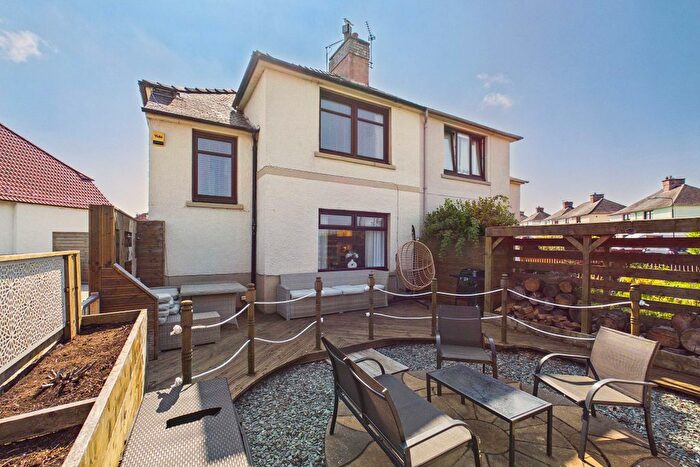
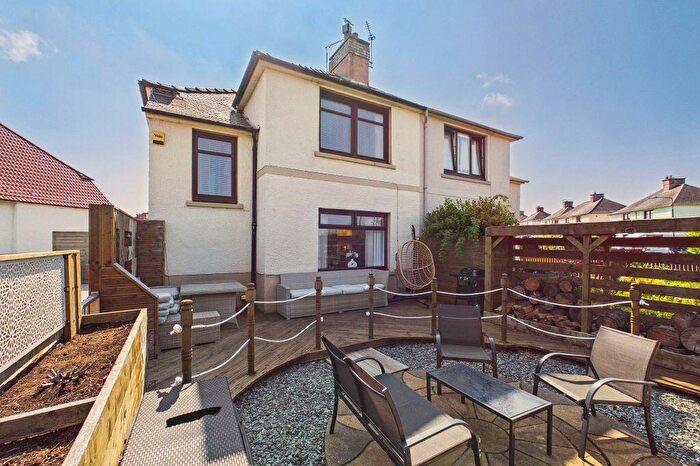
Properties for sale in East Lothian
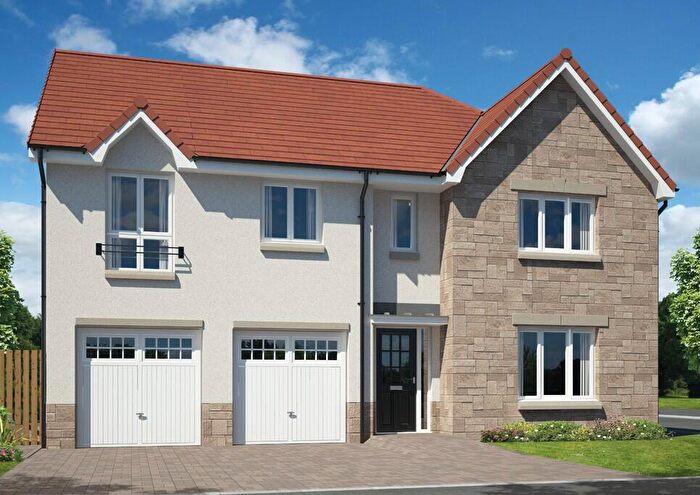

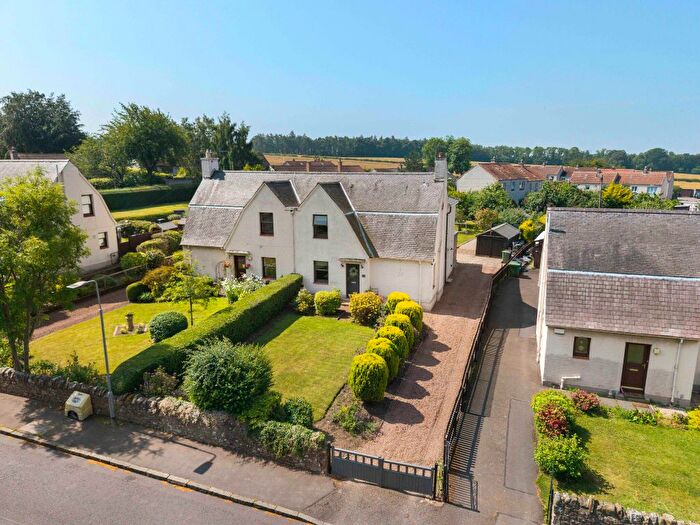
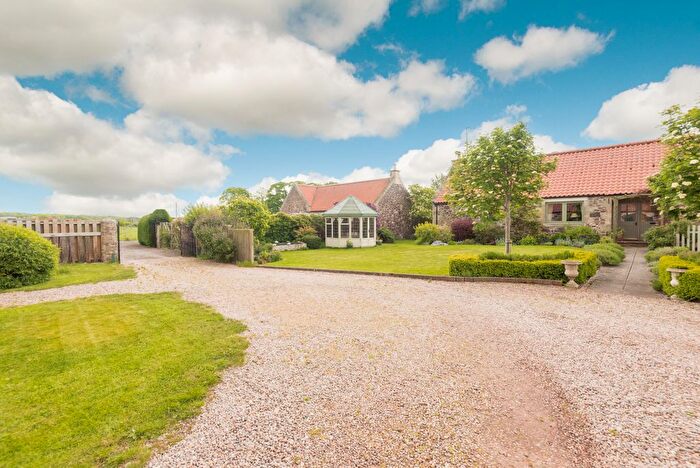
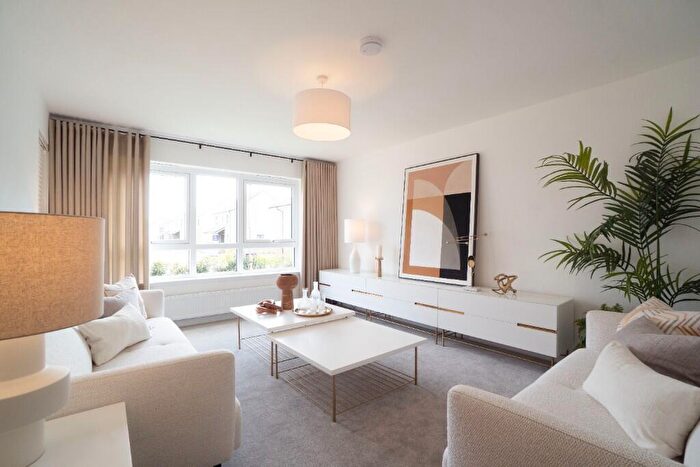
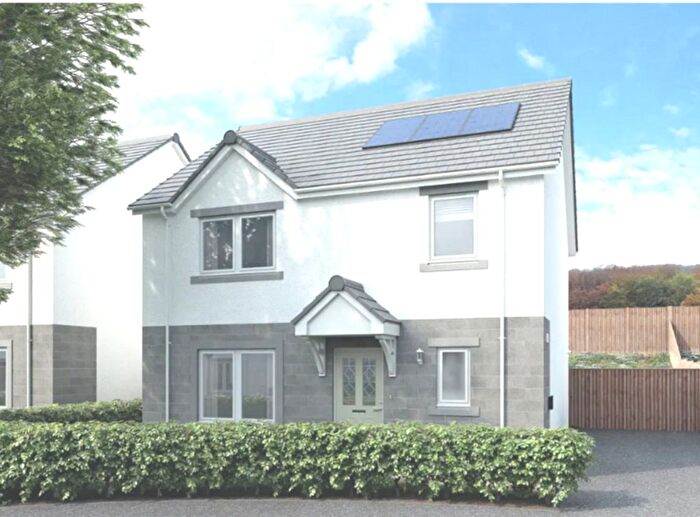
![]()
If you are looking to sell your house, let it out, or receive a property valuation, an expert can help you.
Click the button below to get started.


Towns in East Lothian
Navigate through our locations to find the location of your next house in East Lothian, Scotland for sale or to rent.
Property price trends in East Lothian
According to the latest Registers of Scotland data, the average home in East Lothian sold for £291,496 in 2026. That figure comes from a substantial record of 45,243 sales logged over the past 26 years.
Prices have held fairly steady over the last three years. Compared with 2023, when the typical sale came in around £295,885, values are broadly unchanged.
Looking back five years, average prices are up about 0% since 2021, a gain of around £11 in cash terms.
Zoom out to the past decade for the fuller picture. Back in 2016, homes here averaged £216,981, so the typical sold price has climbed about 34.3% since then, roughly 3% a year. Stretch the view to fifteen years and that annual pace eases back to about 2.6%.
Frequently asked questions about East Lothian
What is the average price for a property for sale in East Lothian?
The average price for a property for sale in East Lothian is £287,015. This amount is 42% higher than the average price in Scotland. There are more than 10,000 property listings for sale in East Lothian.
What locations have the most expensive properties for sale in East Lothian?
The locations with the most expensive properties for sale in East Lothian are Humbie at an average of £700,000, Gullane at an average of £523,533 and North Berwick at an average of £481,405.
What locations have the most affordable properties for sale in East Lothian?
The locations with the most affordable properties for sale in East Lothian are Tranent at an average of £228,208, Musselburgh at an average of £238,014 and Prestonpans at an average of £263,203.
Which train stations are available in or near East Lothian?
Some of the train stations available in or near East Lothian are Longniddry, Drem and Prestonpans.
Property Price Paid in East Lothian by Year
The average sold property price by year was:
| Year | Average Sold Price | Price Change |
Sold Properties
|
|---|---|---|---|
| 2026 | £291,496 | 2% |
162 Properties |
| 2025 | £285,889 | 3% |
943 Properties |
| 2024 | £276,381 | -7% |
796 Properties |
| 2023 | £295,885 | -5% |
992 Properties |
| 2022 | £312,094 | 7% |
1,855 Properties |
| 2021 | £291,485 | 3% |
2,392 Properties |
| 2020 | £281,742 | 7% |
1,935 Properties |
| 2019 | £262,029 | 8% |
2,415 Properties |
| 2018 | £241,282 | 5% |
2,271 Properties |
| 2017 | £229,166 | 5% |
2,219 Properties |
Transport in East Lothian
Please see below transportation links in this area:
