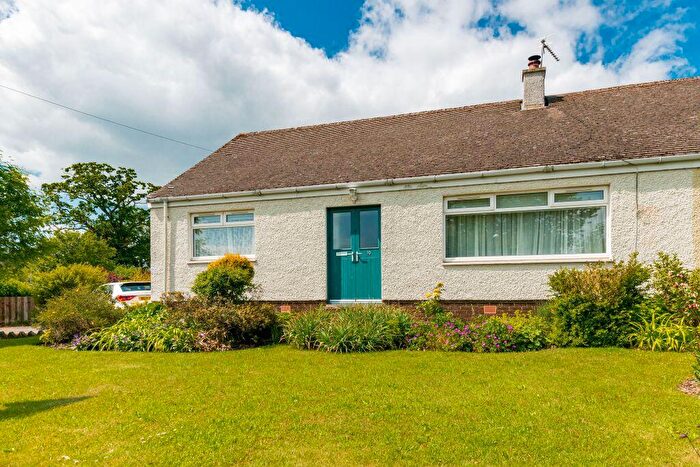
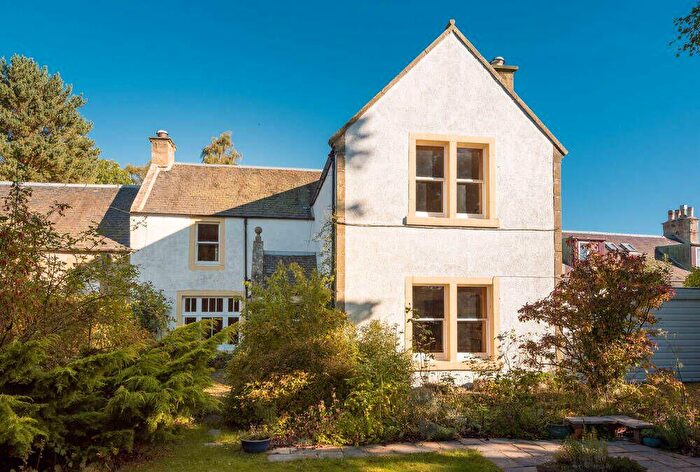
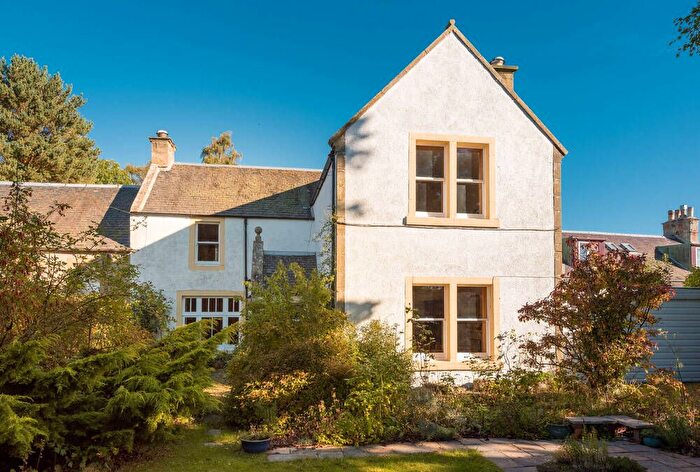
Houses for sale & to rent in Haddington and Lammermuir, Humbie
House Prices in Haddington and Lammermuir
Properties in Haddington and Lammermuir have an average house price of £462,000.00 and had 3 Property Transactions within the last 3 years¹.
Haddington and Lammermuir is an area in Humbie, East Lothian with 163 households², where the most expensive property was sold for £740,000.00.
Previously listed properties in Haddington and Lammermuir
Roads and Postcodes in Haddington and Lammermuir
Navigate through our locations to find the location of your next house in Haddington and Lammermuir, Humbie for sale or to rent.
| Streets | Postcodes |
|---|---|
| Kippithill | EH36 5PP |
| Shillinghill | EH36 5PX |
| EH36 5PA EH36 5PB EH36 5PD EH36 5PE EH36 5PH EH36 5PJ EH36 5PL EH36 5PN EH36 5PW |
Transport near Haddington and Lammermuir
-
Gorebridge Station
-
Prestonpans Station
-
Newtongrange Station
-
Longniddry Station
-
Wallyford Station
-
Eskbank Station
-
Shawfair Station
- FAQ
- Price Paid By Year
Frequently asked questions about Haddington and Lammermuir
What is the average price for a property for sale in Haddington and Lammermuir?
The average price for a property for sale in Haddington and Lammermuir is £462,000. There are 8 property listings for sale in Haddington and Lammermuir.
Which train stations are available in or near Haddington and Lammermuir?
Some of the train stations available in or near Haddington and Lammermuir are Gorebridge, Prestonpans and Newtongrange.
Property Price Paid in Haddington and Lammermuir by Year
The average sold property price by year was:
| Year | Average Sold Price | Price Change |
Sold Properties
|
|---|---|---|---|
| 2022 | £462,000 | 13% |
3 Properties |
| 2021 | £401,650 | -29% |
9 Properties |
| 2019 | £517,750 | 38% |
6 Properties |
| 2018 | £318,797 | 2% |
4 Properties |
| 2017 | £311,312 | -152% |
4 Properties |
| 2016 | £785,878 | 57% |
4 Properties |
| 2015 | £336,875 | 24% |
4 Properties |
| 2014 | £256,666 | -10% |
3 Properties |
| 2013 | £281,792 | -56% |
7 Properties |
| 2012 | £438,924 | 31% |
5 Properties |
| 2011 | £303,400 | -3% |
5 Properties |
| 2010 | £312,268 | -40% |
5 Properties |
| 2009 | £438,500 | -21% |
5 Properties |
| 2008 | £530,000 | 34% |
1 Property |
| 2007 | £348,500 | 13% |
2 Properties |
| 2006 | £301,818 | 9% |
8 Properties |
| 2005 | £273,612 | 65% |
4 Properties |
| 2004 | £96,033 | -317% |
3 Properties |
| 2003 | £400,165 | 39% |
7 Properties |
| 2002 | £242,210 | 94% |
8 Properties |
| 2001 | £15,000 | - |
1 Property |

