
Houses for sale & to rent in Musselburgh, East Lothian
House Prices in Musselburgh
Properties in Musselburgh have an average house price of £238k and had 858 Property Transactions within the last 3 years.¹
Musselburgh is an area in East Lothian with 10,815 households², where the most expensive property was sold for £1.15M.
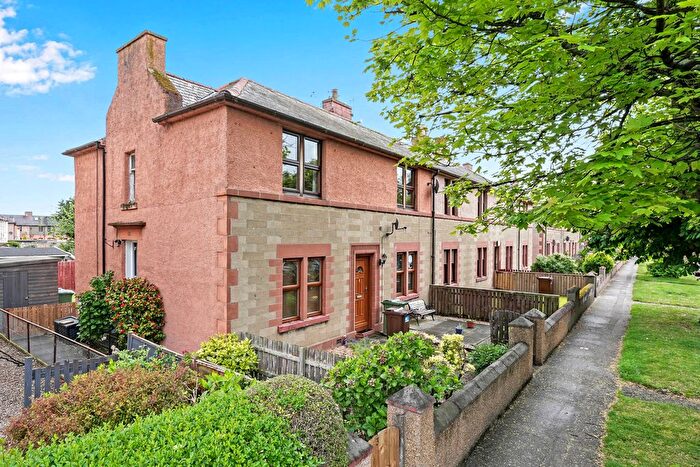
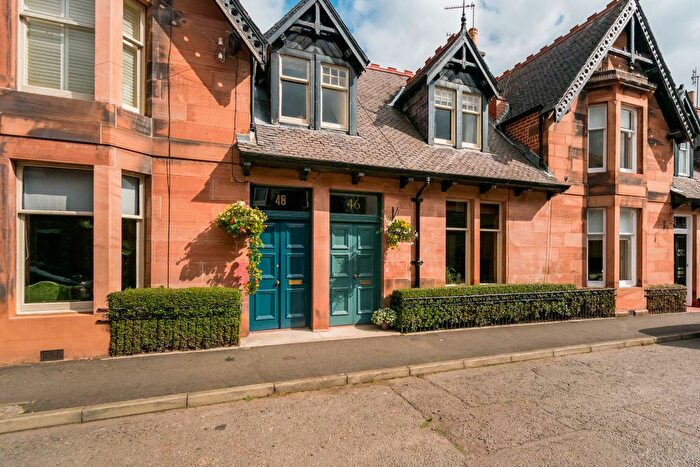
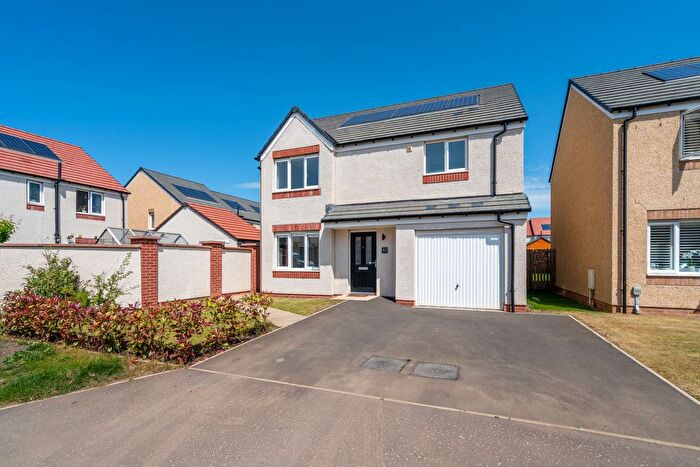
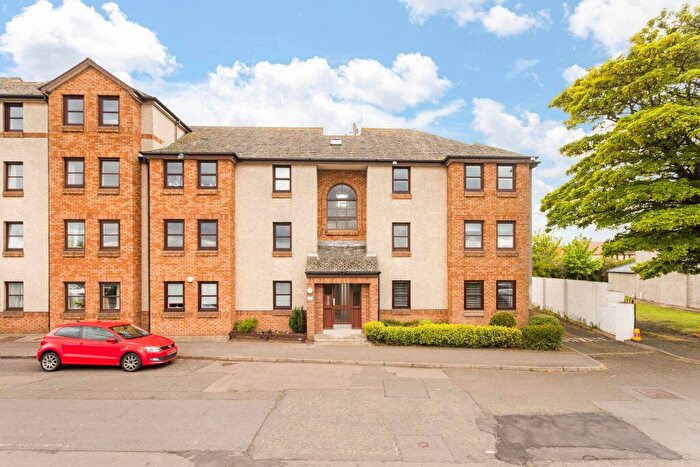
Properties for sale in Musselburgh

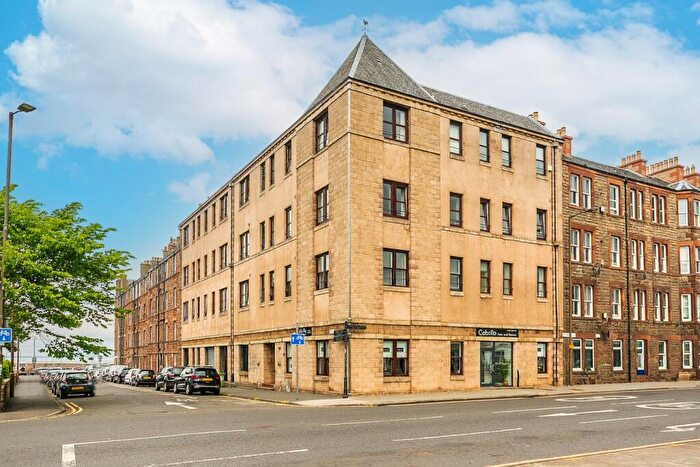

![]()
If you are looking to sell your house, let it out, or receive a property valuation, an expert can help you.
Click the button below to get started.


Neighbourhoods in Musselburgh
Navigate through our locations to find the location of your next house in Musselburgh, East Lothian for sale or to rent.
Transport in Musselburgh
Please see below transportation links in this area:
-
 Wallyford Station
 -
Musselburgh Station
-
Newcraighall Station
-
Shawfair Station
-
Brunstane Station
-
Prestonpans Station
- FAQ
- Price Paid By Year
Frequently asked questions about Musselburgh
What is the average price for a property for sale in Musselburgh?
The average price for a property for sale in Musselburgh is £238,014. This amount is 17% lower than the average price in East Lothian. There are 2,137 property listings for sale in Musselburgh.
What locations have the most expensive properties for sale in Musselburgh?
The locations with the most expensive properties for sale in Musselburgh are Preston, Seton and Gosford at an average of £354,500 and Tranent, Wallyford and Macmerry at an average of £242,597.
What locations have the most affordable properties for sale in Musselburgh?
The location with the most affordable properties for sale in Musselburgh is Musselburgh at an average of £236,868.
Which train stations are available in or near Musselburgh?
Some of the train stations available in or near Musselburgh are Wallyford, Musselburgh and Newcraighall.
Property Price Paid in Musselburgh by Year
The average sold property price by year was:
| Year | Average Sold Price | Price Change |
Sold Properties
|
|---|---|---|---|
| 2025 | £236,051 | -1% |
319 Properties |
| 2024 | £238,162 | -1% |
249 Properties |
| 2023 | £240,045 | -7% |
290 Properties |
| 2022 | £256,215 | 6% |
583 Properties |
| 2021 | £240,789 | 9% |
697 Properties |
| 2020 | £218,136 | 4% |
456 Properties |
| 2019 | £208,538 | 13% |
638 Properties |
| 2018 | £182,300 | 1% |
559 Properties |
| 2017 | £181,301 | 7% |
593 Properties |
| 2016 | £168,178 | 3% |
502 Properties |
| 2015 | £163,928 | 3% |
548 Properties |
| 2014 | £159,760 | 5% |
452 Properties |
| 2013 | £152,057 | 3% |
435 Properties |
| 2012 | £147,268 | 4% |
304 Properties |
| 2011 | £140,723 | -14% |
243 Properties |
| 2010 | £160,795 | 9% |
281 Properties |
| 2009 | £146,080 | -0,2% |
286 Properties |
| 2008 | £146,402 | -15% |
475 Properties |
| 2007 | £168,089 | 16% |
690 Properties |
| 2006 | £141,750 | 11% |
723 Properties |
| 2005 | £126,447 | 2% |
640 Properties |
| 2004 | £124,303 | 27% |
643 Properties |
| 2003 | £90,299 | 3% |
711 Properties |
| 2002 | £87,484 | 24% |
737 Properties |
| 2001 | £66,337 | 2% |
81 Properties |
| 2000 | £64,928 | - |
33 Properties |