
Houses for sale & to rent in Musselburgh, Musselburgh
House Prices in Musselburgh
Properties in Musselburgh have an average house price of £239k and had 661 Property Transactions within the last 3 years¹.
Musselburgh is an area in Musselburgh, East Lothian with 8,950 households², where the most expensive property was sold for £1.15M.
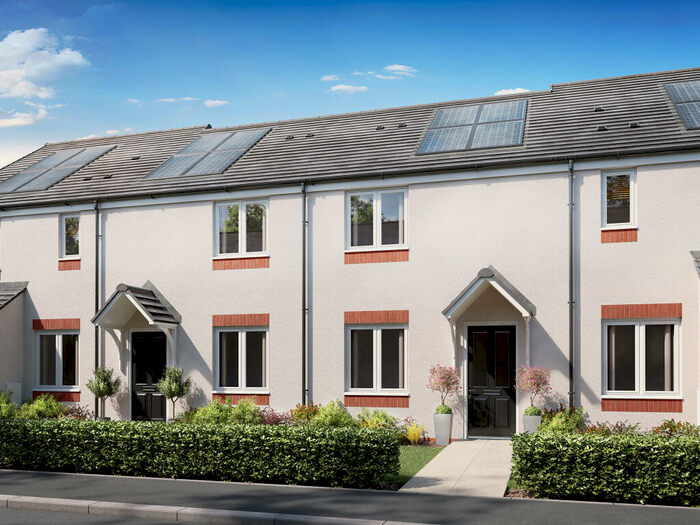
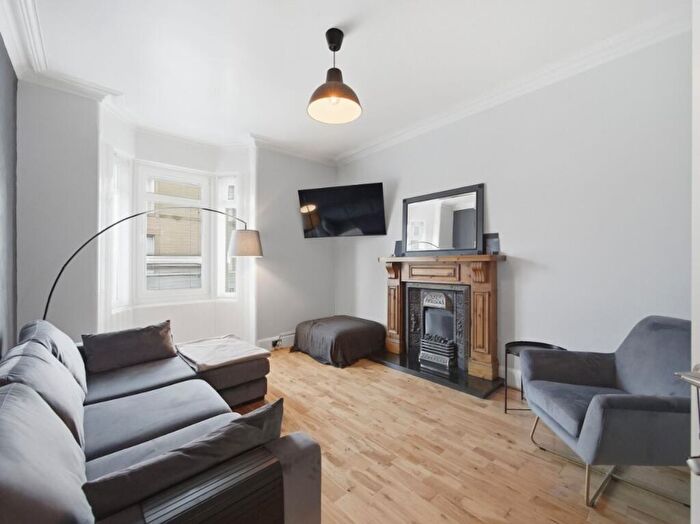
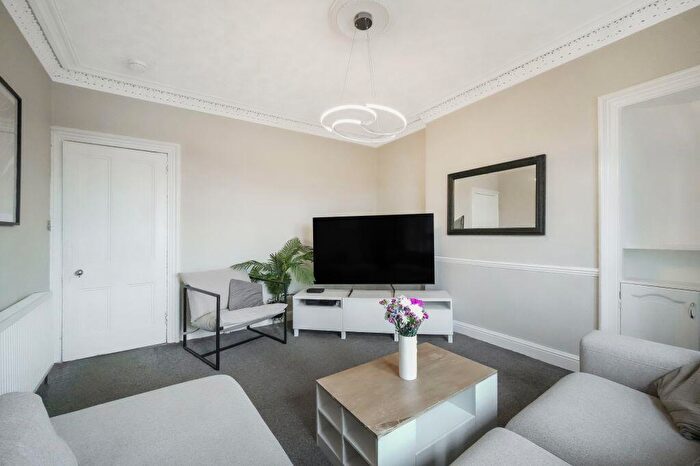
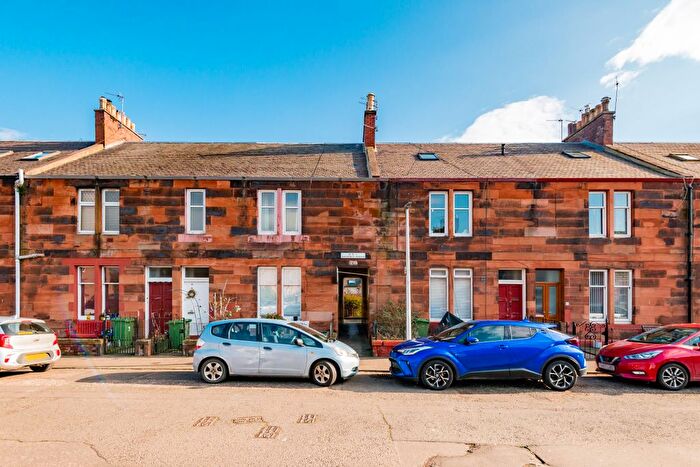
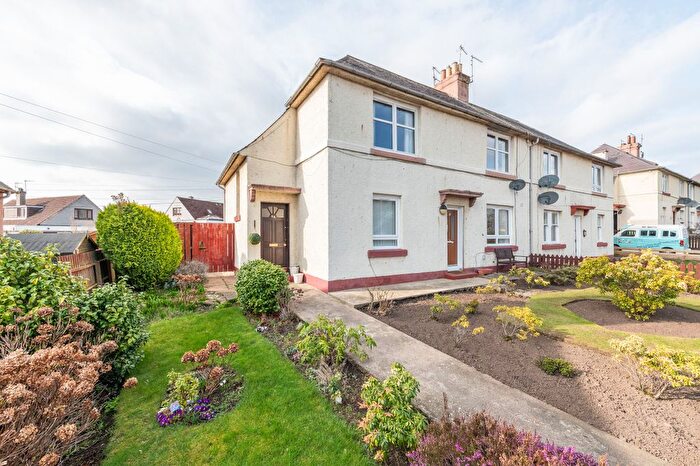
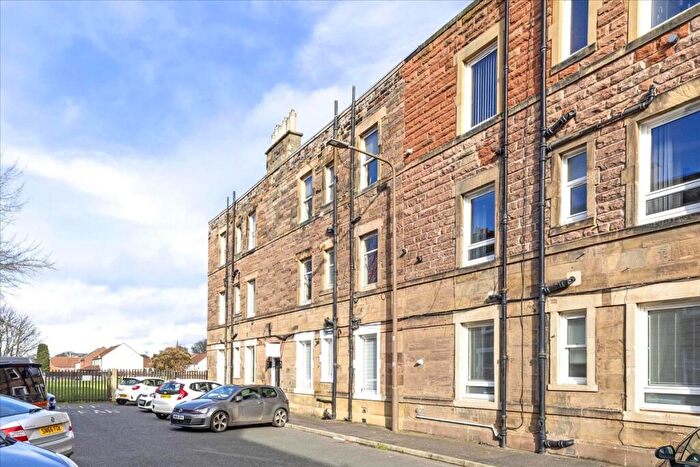
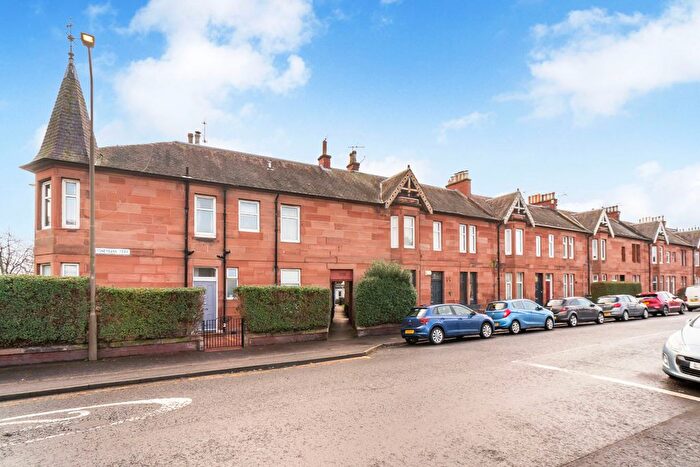
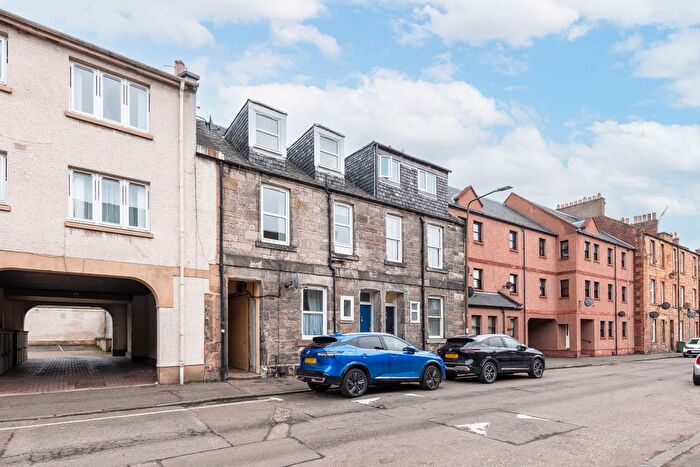
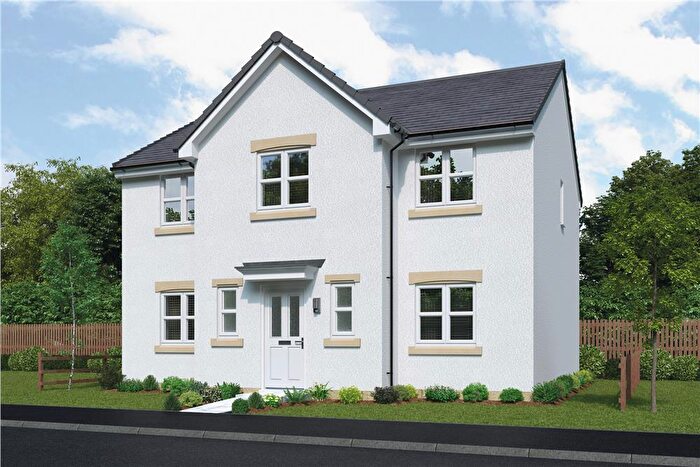
Properties for sale in Musselburgh
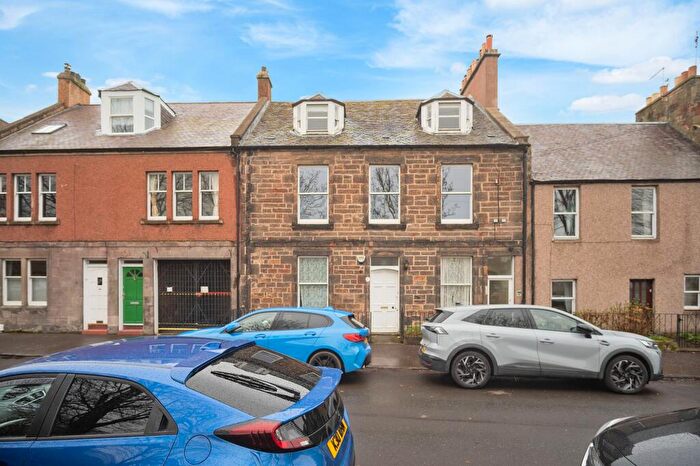
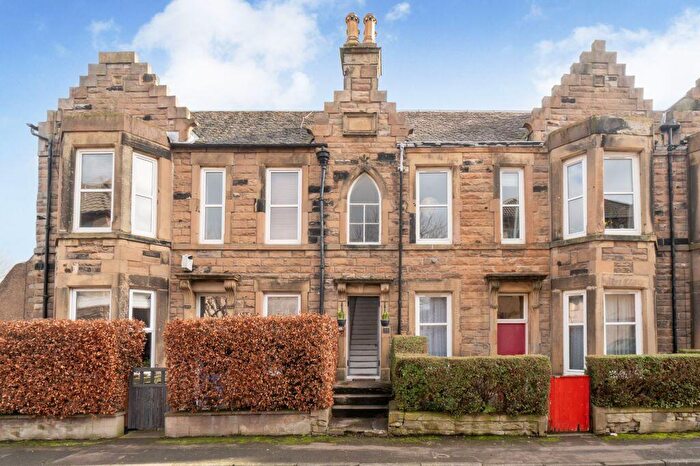
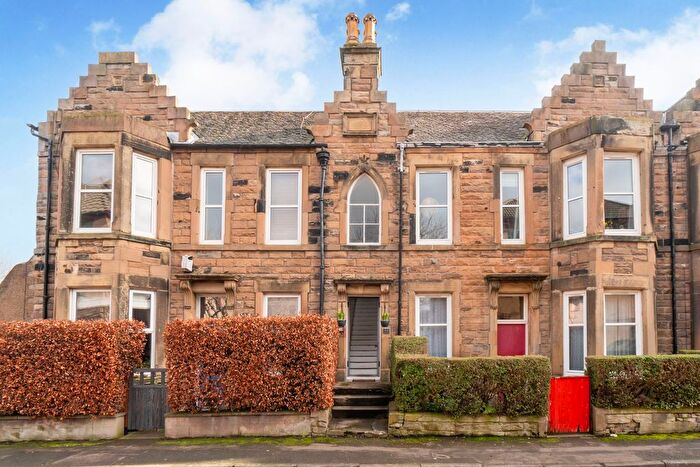
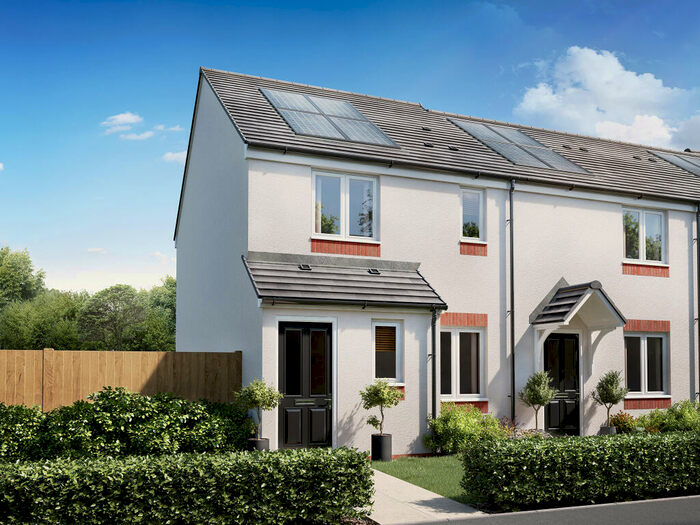
![]()
If you are looking to sell your house, let it out, or receive a property valuation, an expert can help you.
Click the button below to get started.


Roads and Postcodes in Musselburgh
Navigate through our locations to find the location of your next house in Musselburgh, Musselburgh for sale or to rent.
Transport near Musselburgh

- FAQ
- Price Paid By Year
Frequently asked questions about Musselburgh
What is the average price for a property for sale in Musselburgh?
The average price for a property for sale in Musselburgh is £238,505. This amount is 0.52% lower than the average price in Musselburgh. There are 1,462 property listings for sale in Musselburgh.
What streets have the most expensive properties for sale in Musselburgh?
The streets with the most expensive properties for sale in Musselburgh are The Inveresk Estate at an average of £990,000, Haddington Road at an average of £795,000 and Wedderburn Court at an average of £755,000.
What streets have the most affordable properties for sale in Musselburgh?
The streets with the most affordable properties for sale in Musselburgh are Delta Crescent at an average of £105,000, Shorthope Street at an average of £122,500 and Moir Crescent at an average of £130,000.
Which train stations are available in or near Musselburgh?
Some of the train stations available in or near Musselburgh are Musselburgh, Wallyford and Newcraighall.
Property Price Paid in Musselburgh by Year
The average sold property price by year was:
| Year | Average Sold Price | Price Change |
Sold Properties
|
|---|---|---|---|
| 2025 | £239,727 | 0,3% |
218 Properties |
| 2024 | £238,968 | 1% |
203 Properties |
| 2023 | £237,003 | -6% |
240 Properties |
| 2022 | £252,269 | 7% |
425 Properties |
| 2021 | £233,678 | 11% |
475 Properties |
| 2020 | £208,404 | 2% |
311 Properties |
| 2019 | £204,657 | 11% |
420 Properties |
| 2018 | £182,285 | 1% |
481 Properties |
| 2017 | £179,742 | 7% |
496 Properties |
| 2016 | £167,328 | 5% |
415 Properties |
| 2015 | £158,547 | -1% |
465 Properties |
| 2014 | £159,794 | 7% |
397 Properties |
| 2013 | £148,278 | 2% |
380 Properties |
| 2012 | £144,932 | 2% |
255 Properties |
| 2011 | £142,223 | -13% |
204 Properties |
| 2010 | £160,655 | 9% |
229 Properties |
| 2009 | £146,335 | 2% |
216 Properties |
| 2008 | £144,081 | -18% |
373 Properties |
| 2007 | £169,562 | 19% |
586 Properties |
| 2006 | £138,105 | 6% |
640 Properties |
| 2005 | £129,161 | 7% |
578 Properties |
| 2004 | £120,365 | 20% |
588 Properties |
| 2003 | £95,897 | 3% |
621 Properties |
| 2002 | £92,608 | 30% |
646 Properties |
| 2001 | £65,085 | -6% |
74 Properties |
| 2000 | £69,007 | - |
30 Properties |