
Houses for sale in Dunfermline, Fife
House Prices in Dunfermline
Properties in Dunfermline have an average house price of £195k and had 3,258 Property Transactions within the last 3 years.¹
Dunfermline is an area in Fife with 43,048 households², where the most expensive property was sold for £1.4M.
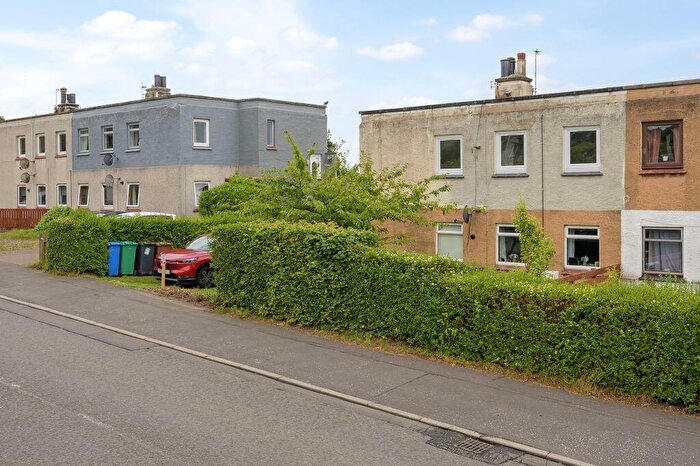
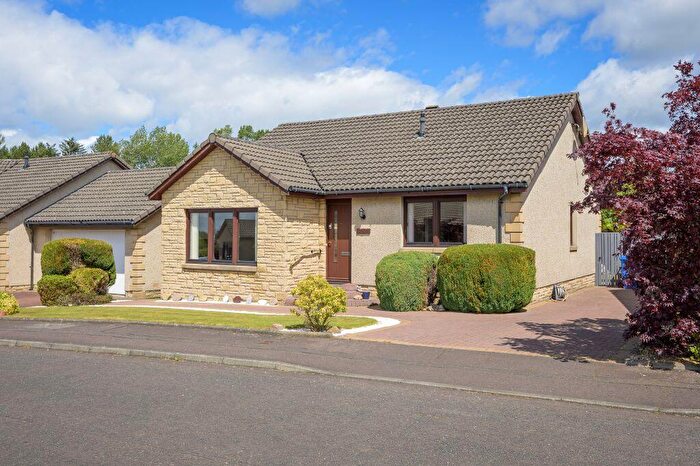
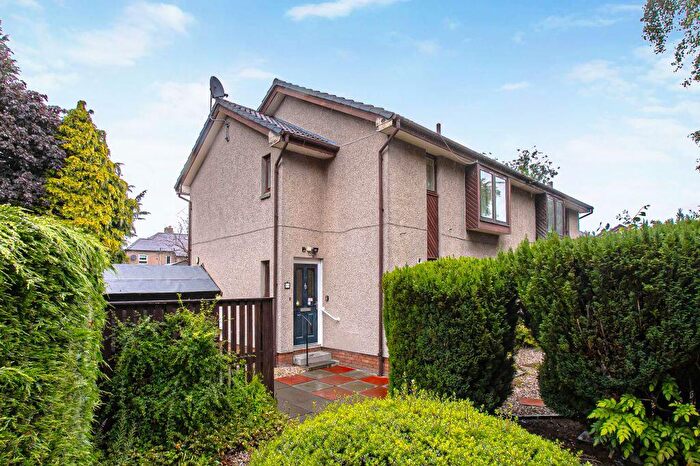
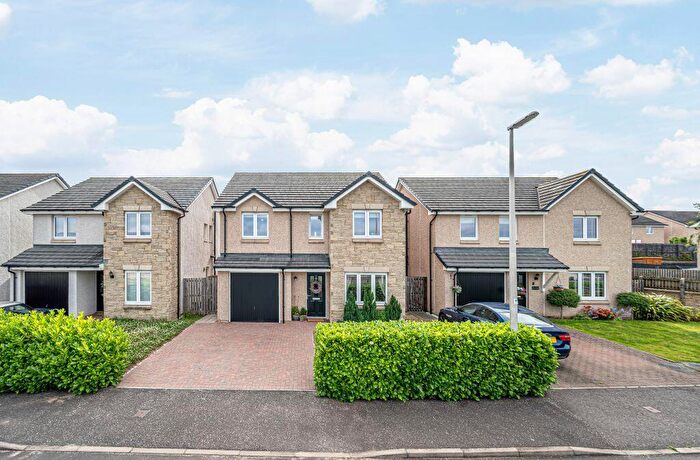
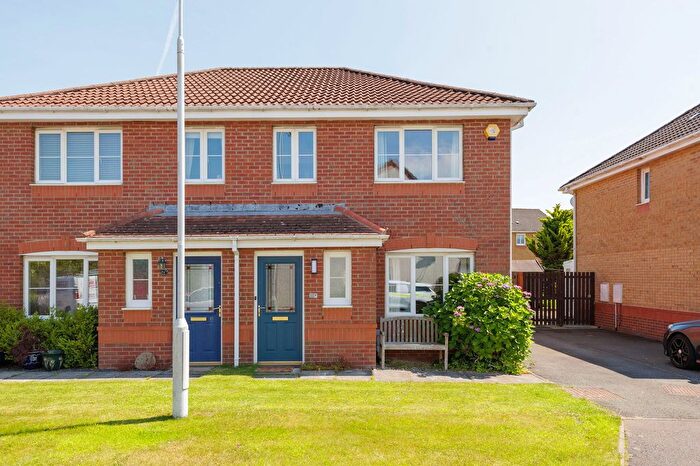
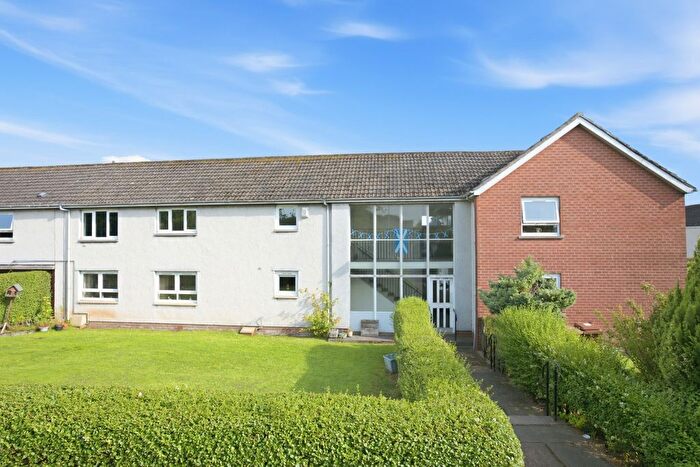
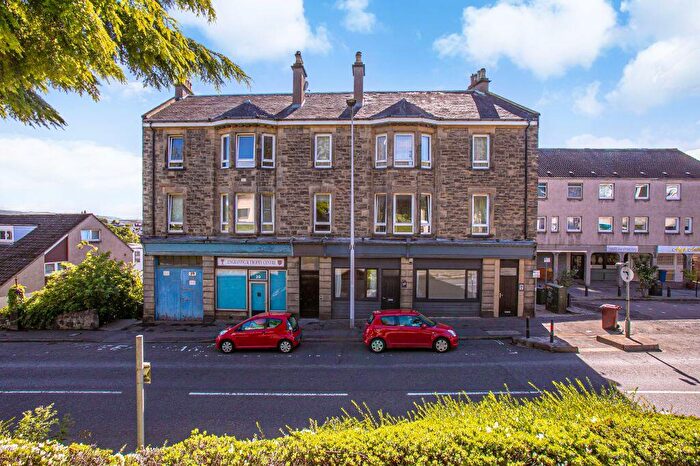
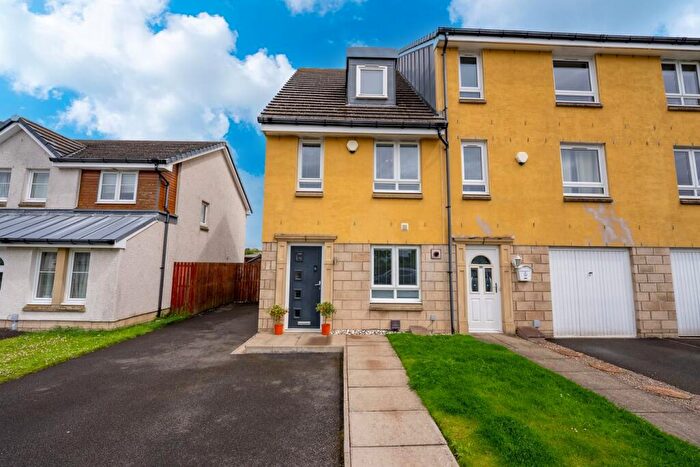
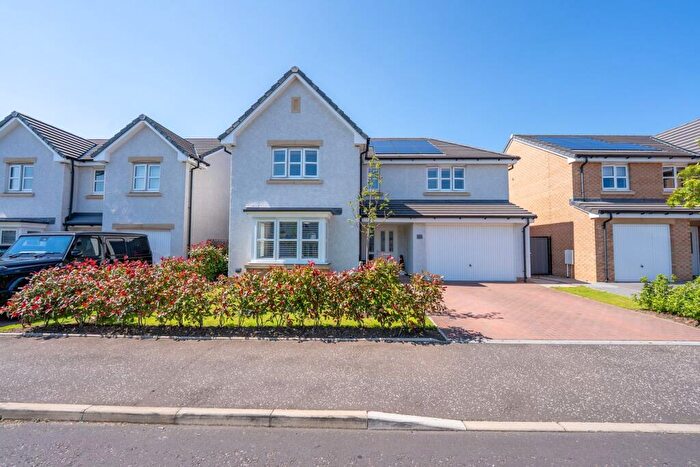
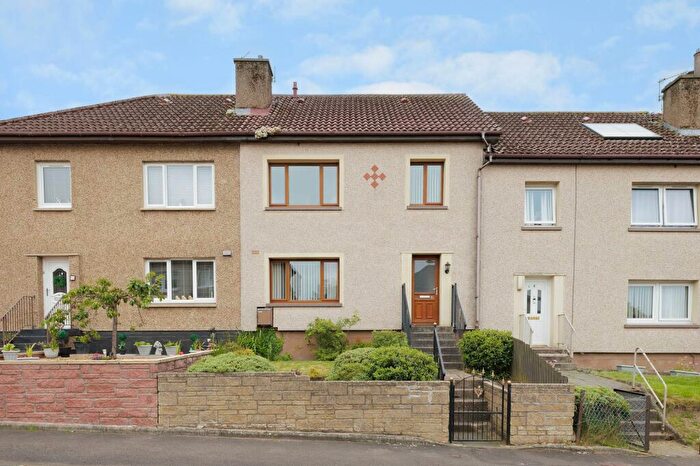
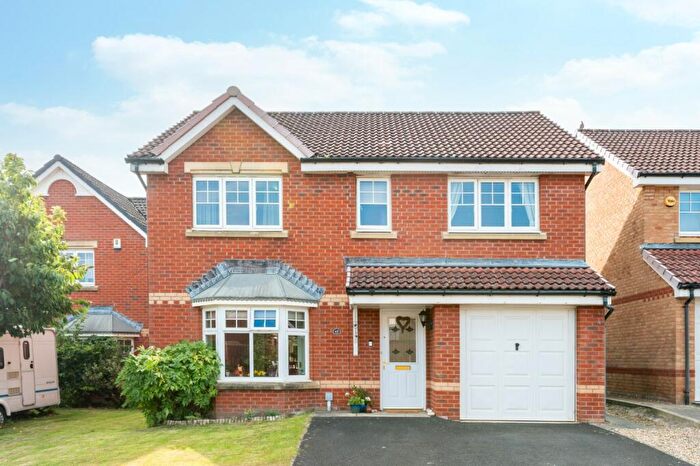
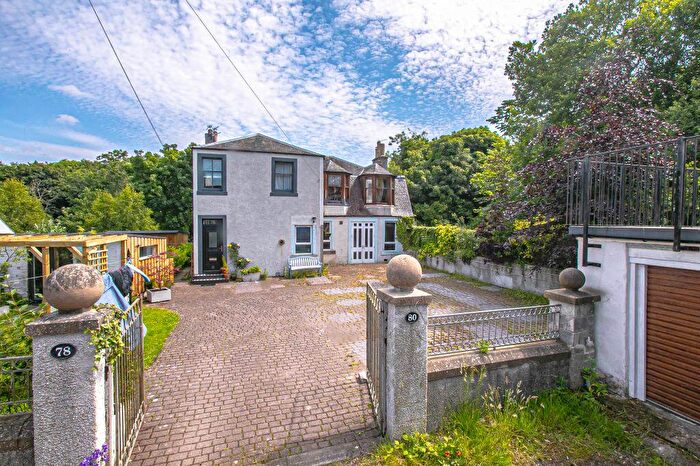
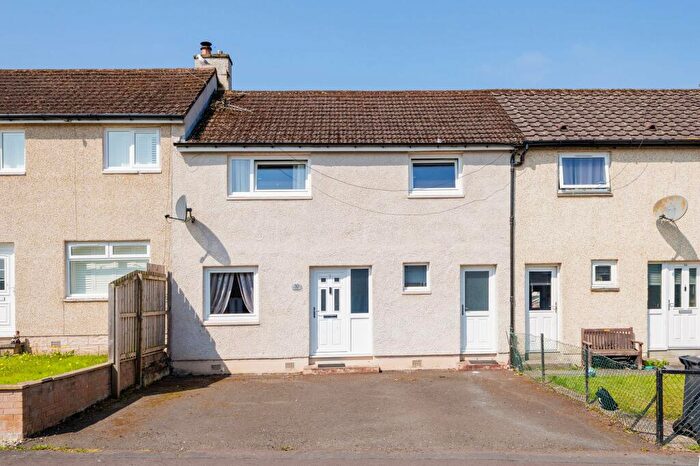
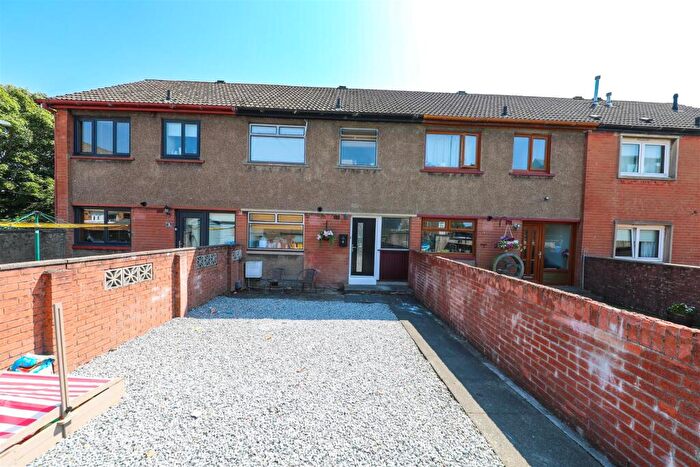
Properties for sale in Dunfermline
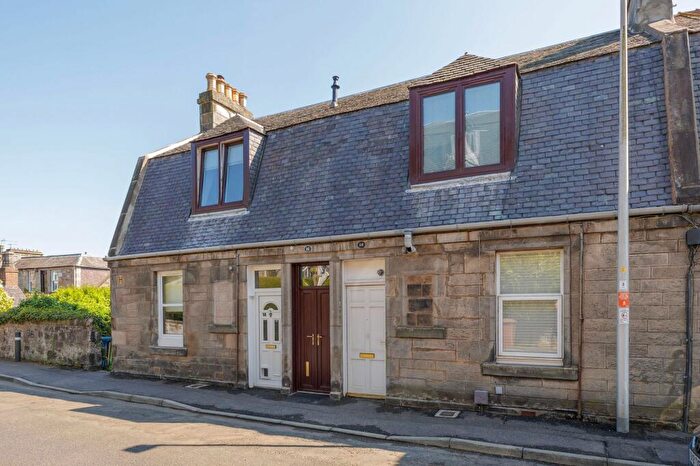
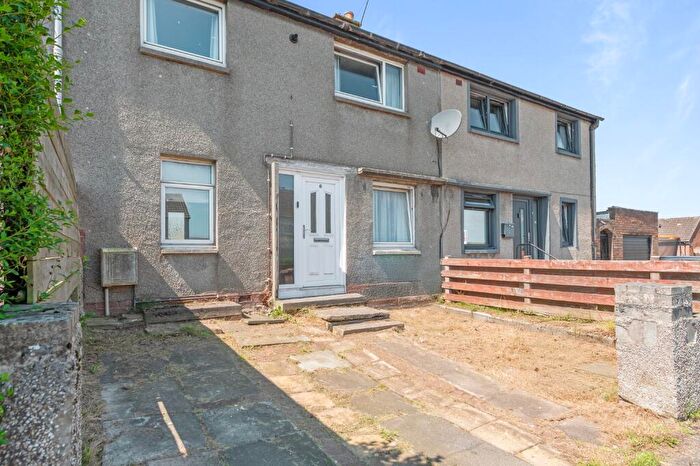
![]()
If you are looking to sell your house, let it out, or receive a property valuation, an expert can help you.
Click the button below to get started.

Neighbourhoods in Dunfermline
Navigate through our locations to find the location of your next house in Dunfermline, Fife for sale or to rent.
Property price trends in Dunfermline
According to the latest Registers of Scotland data, the average home in Dunfermline sold for £198,927 in 2025. That figure comes from a substantial record of 49,341 sales logged over the past 25 years.
Prices have moved up over the last three years. Compared with 2022, when the typical sale came in around £194,576, that's a rise of roughly 2.2%.
Looking back five years, average prices are up about 14.7% since 2020, a gain of around £25,454 in cash terms.
Zoom out to the past decade for the fuller picture. Back in 2015, homes here averaged £146,355, so the typical sold price has climbed about 35.9% since then, roughly 3.1% a year. Stretch the view to fifteen years and that annual pace eases back to about 2.4%.
Frequently asked questions about Dunfermline
What is the average price for a property for sale in Dunfermline?
The average price for a property for sale in Dunfermline is £194,504. This amount is 6% higher than the average price in Fife. There are more than 10,000 property listings for sale in Dunfermline.
What locations have the most expensive properties for sale in Dunfermline?
The locations with the most expensive properties for sale in Dunfermline are Dunfermline South at an average of £211,575, Inverkeithing and Dalgety Bay at an average of £210,270 and Dunfermline Central at an average of £204,001.
What locations have the most affordable properties for sale in Dunfermline?
The locations with the most affordable properties for sale in Dunfermline are Rosyth at an average of £162,375, Dunfermline North at an average of £174,243 and West Fife and Coastal Villages at an average of £196,205.
Which train stations are available in or near Dunfermline?
Some of the train stations available in or near Dunfermline are Dunfermline Queen Margaret, Rosyth and Dunfermline.
Property Price Paid in Dunfermline by Year
The average sold property price by year was:
| Year | Average Sold Price | Price Change |
Sold Properties
|
|---|---|---|---|
| 2025 | £198,927 | 0,1% |
1,069 Properties |
| 2024 | £198,769 | 6% |
1,098 Properties |
| 2023 | £185,878 | -5% |
1,091 Properties |
| 2022 | £194,576 | 7% |
1,889 Properties |
| 2021 | £181,244 | 4% |
2,284 Properties |
| 2020 | £173,473 | 4% |
1,877 Properties |
| 2019 | £166,254 | -1% |
2,331 Properties |
| 2018 | £167,552 | 6% |
2,261 Properties |
| 2017 | £157,052 | 5% |
2,240 Properties |
| 2016 | £149,356 | 2% |
2,011 Properties |
Transport in Dunfermline
Please see below transportation links in this area:
