
Houses for sale in Fife, Scotland
House Prices in Fife
Properties in Fife have
an average house price of
£184k
and had 11,380 Property Transactions
within the last 3 years.¹
Fife is a location in
Scotland with
160,796 households², where the most expensive property was sold for £2.29M.
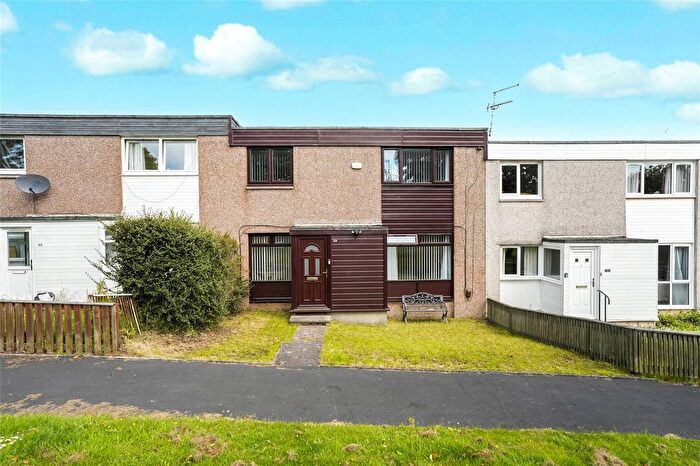
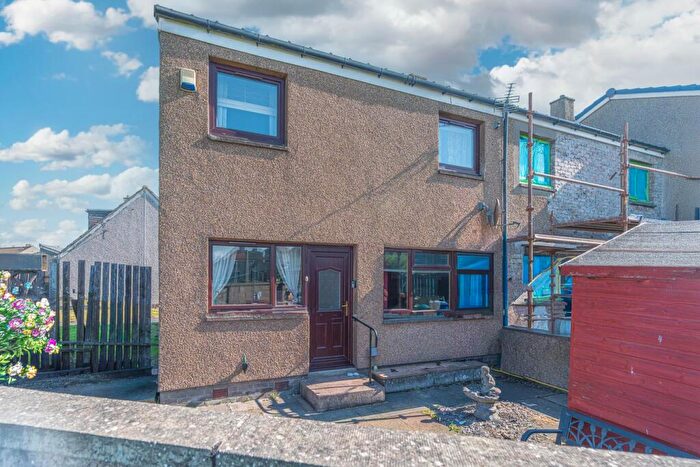
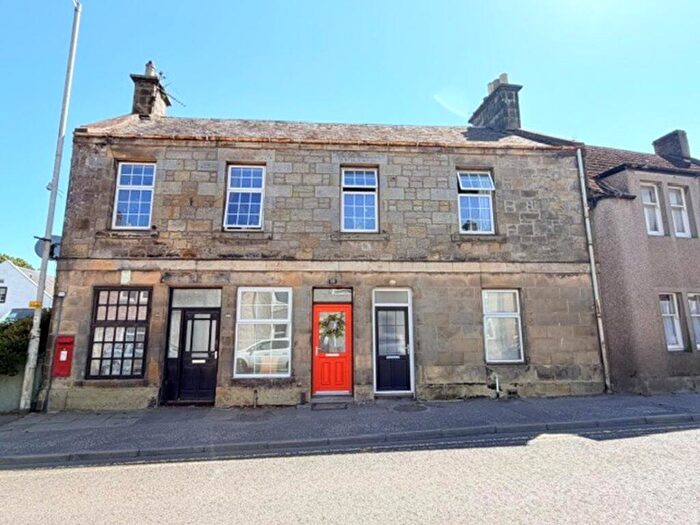
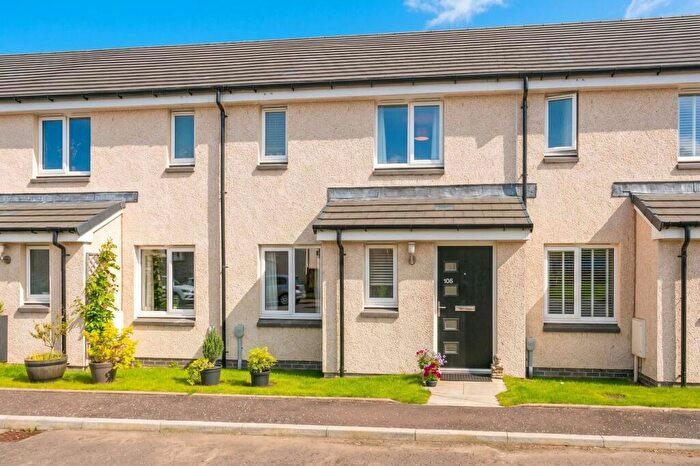
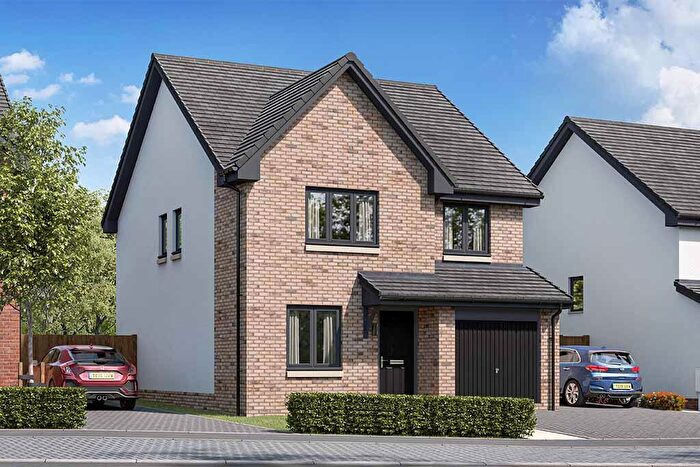
Properties for sale in Fife
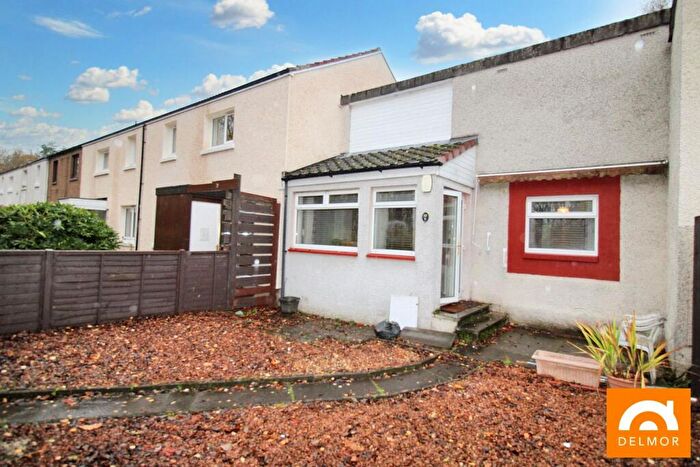
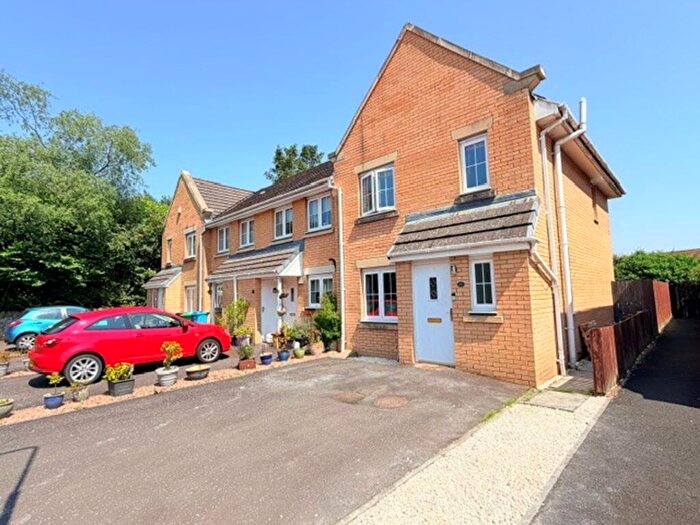
![]()
If you are looking to sell your house, let it out, or receive a property valuation, an expert can help you.
Click the button below to get started.


Towns in Fife
Navigate through our locations to find the location of your next house in Fife, Scotland for sale or to rent.
Property price trends in Fife
According to the latest Registers of Scotland data, the average home in Fife sold for £187,910 in 2026. That figure comes from a substantial record of 163,283 sales logged over the past 26 years.
Prices have moved up over the last three years. Compared with 2023, when the typical sale came in around £183,508, that's a rise of roughly 2.4%.
Looking back five years, average prices are up about 3.3% since 2021, a gain of around £5,975 in cash terms.
Zoom out to the past decade for the fuller picture. Back in 2016, homes here averaged £151,188, so the typical sold price has climbed about 24.3% since then, roughly 2.2% a year. Stretch the view to fifteen years and that annual pace holds at about 2.2%.
Frequently asked questions about Fife
What is the average price for a property for sale in Fife?
The average price for a property for sale in Fife is £183,770. This amount is 9% lower than the average price in Scotland. There are more than 10,000 property listings for sale in Fife.
What locations have the most expensive properties for sale in Fife?
The locations with the most expensive properties for sale in Fife are St Andrews at an average of £403,701, Anstruther at an average of £287,322 and Newport-on-tay at an average of £215,803.
What locations have the most affordable properties for sale in Fife?
The locations with the most affordable properties for sale in Fife are Lochgelly at an average of £137,940, Cowdenbeath at an average of £144,896 and Glenrothes at an average of £148,272.
Which train stations are available in or near Fife?
Some of the train stations available in or near Fife are Glenrothes with Thornton, Markinch and Cardenden.
Property Price Paid in Fife by Year
The average sold property price by year was:
| Year | Average Sold Price | Price Change |
Sold Properties
|
|---|---|---|---|
| 2026 | £187,910 | 2% |
699 Properties |
| 2025 | £183,828 | 0,4% |
3,571 Properties |
| 2024 | £183,139 | -0,2% |
3,364 Properties |
| 2023 | £183,508 | -6% |
3,746 Properties |
| 2022 | £194,666 | 7% |
6,401 Properties |
| 2021 | £181,935 | 6% |
7,389 Properties |
| 2020 | £170,653 | 5% |
5,922 Properties |
| 2019 | £161,679 | 0,4% |
7,134 Properties |
| 2018 | £160,967 | 4% |
7,013 Properties |
| 2017 | £155,290 | 3% |
6,989 Properties |
Transport in Fife
Please see below transportation links in this area:
