
Houses for sale in Kirkcaldy, Fife
House Prices in Kirkcaldy
Properties in Kirkcaldy have an average house price of £149k and had 1,800 Property Transactions within the last 3 years.¹
Kirkcaldy is an area in Fife with 25,978 households², where the most expensive property was sold for £825k.
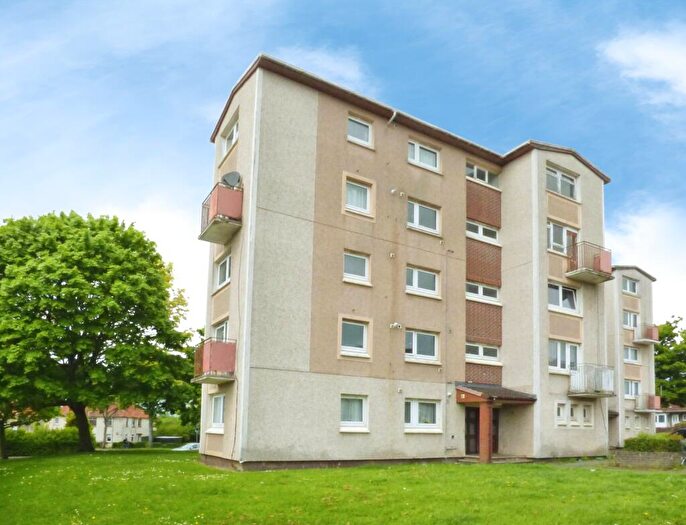
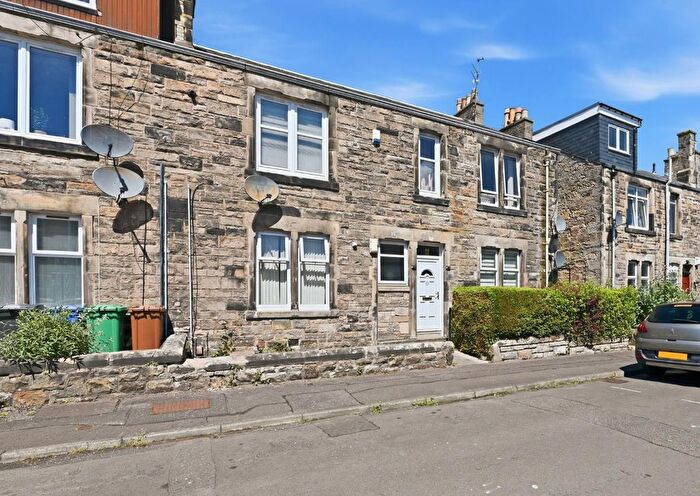
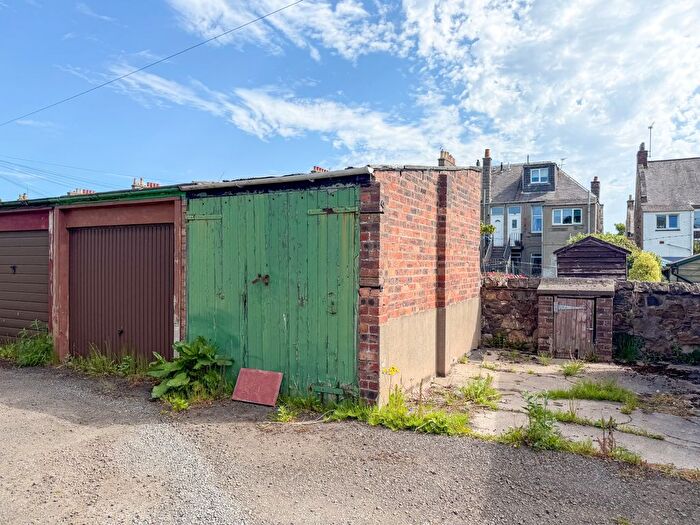
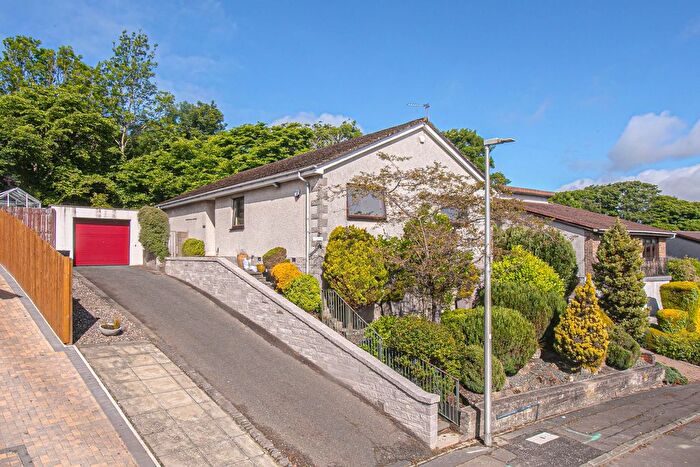
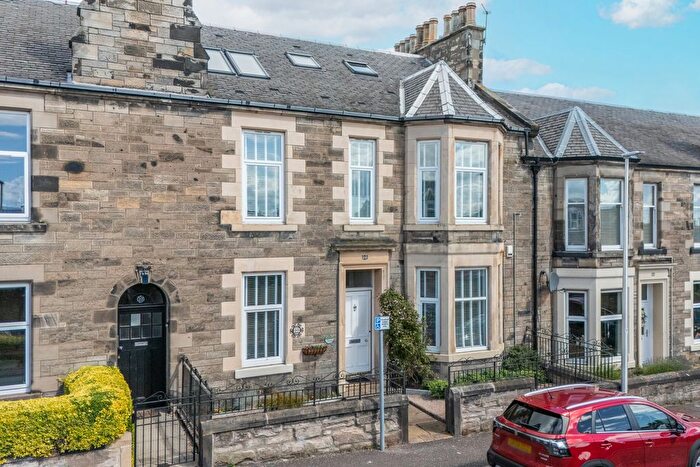
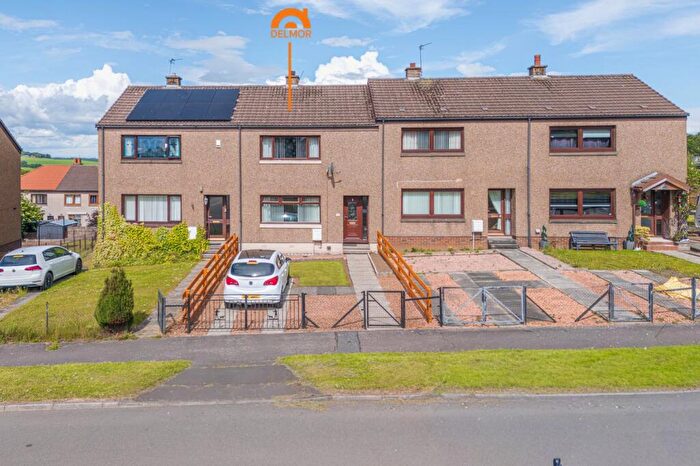
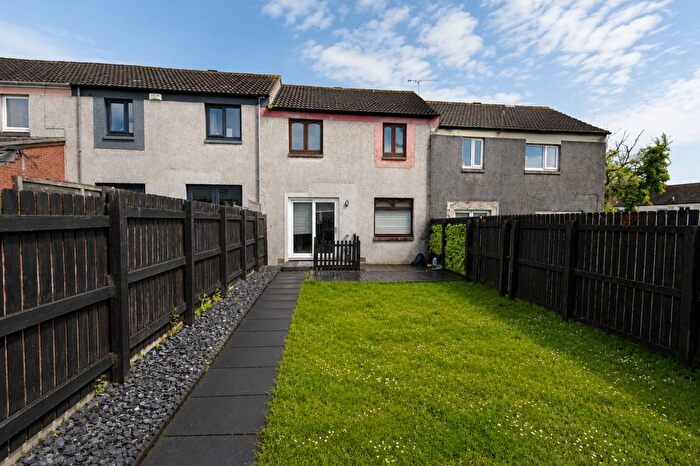
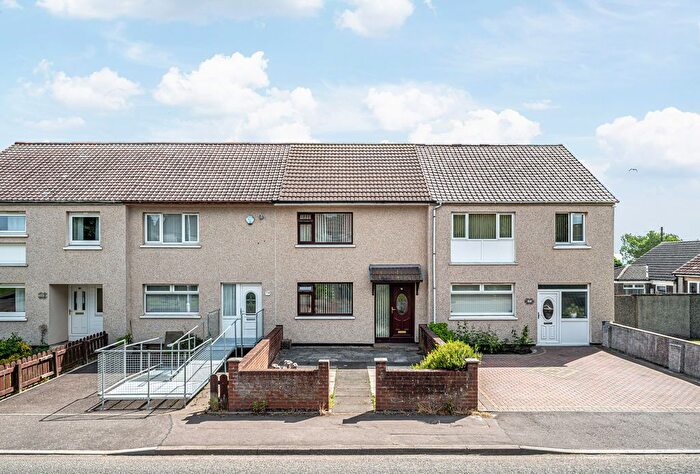
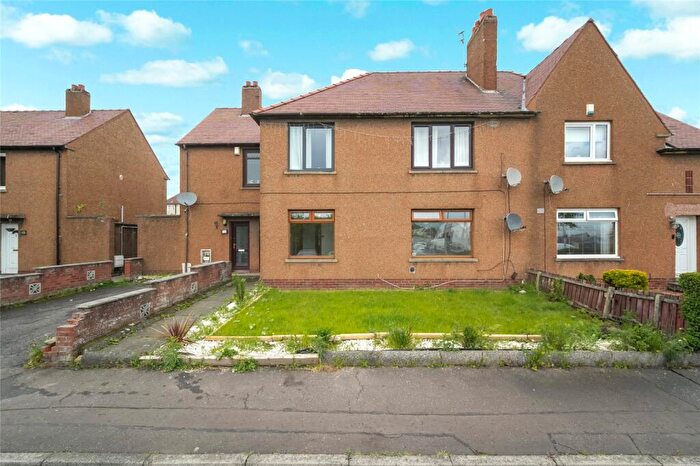
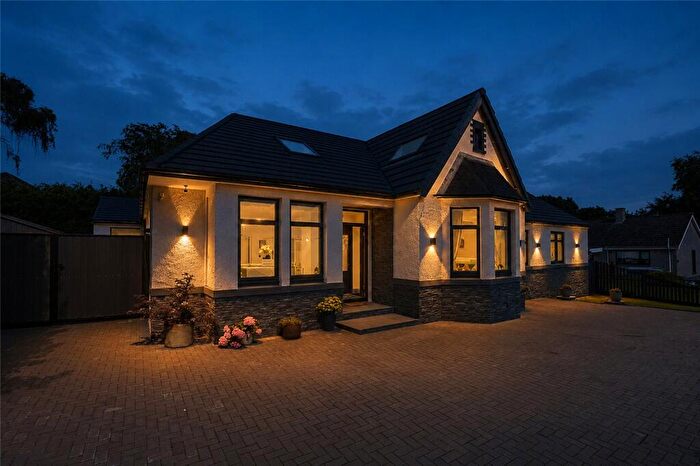
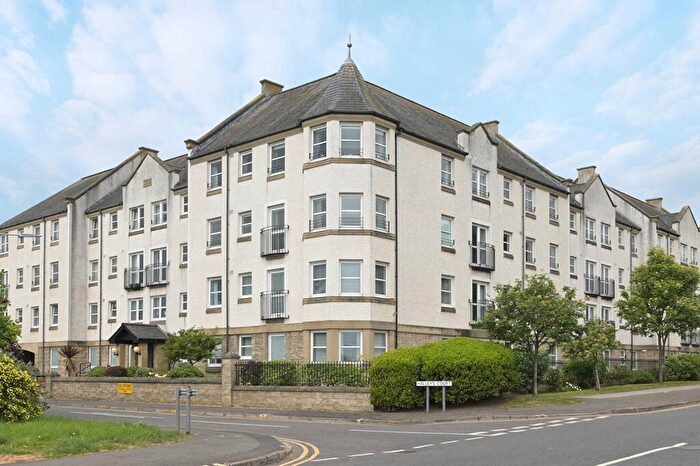
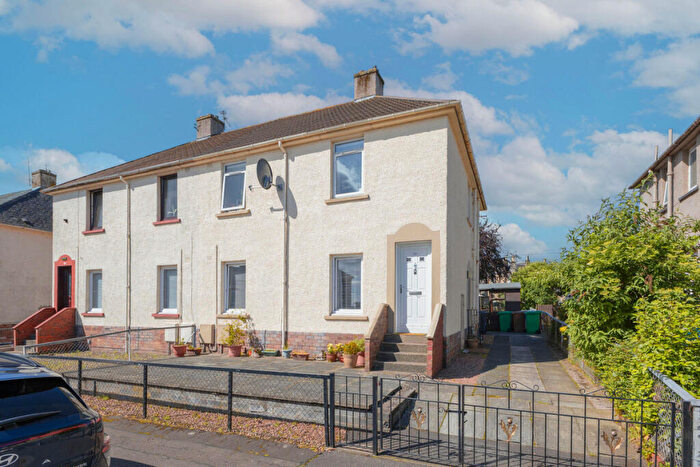
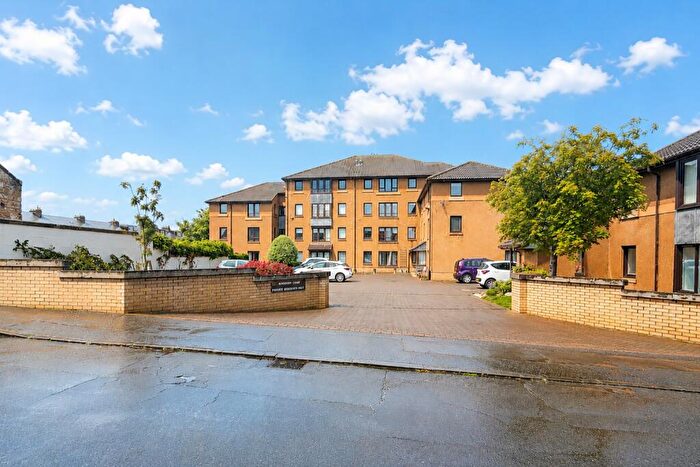
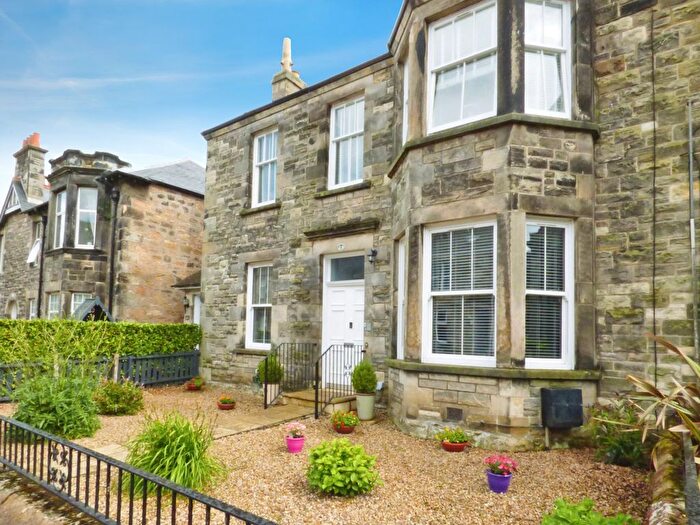
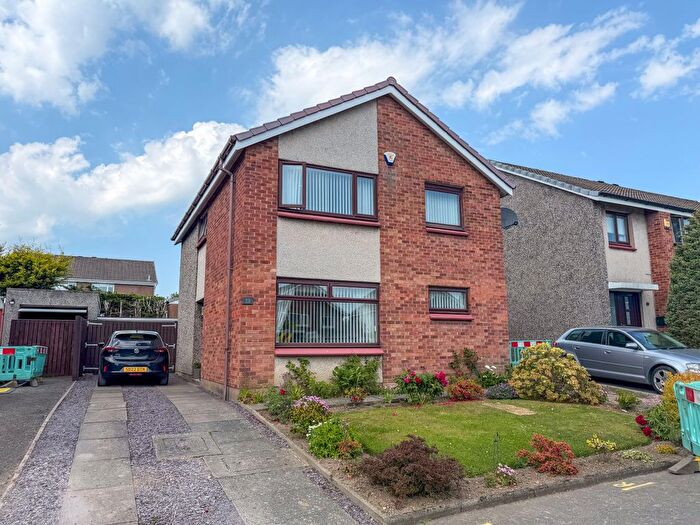
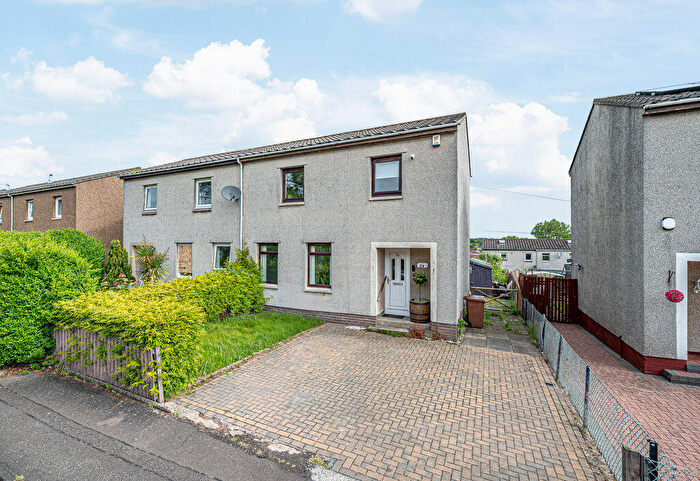
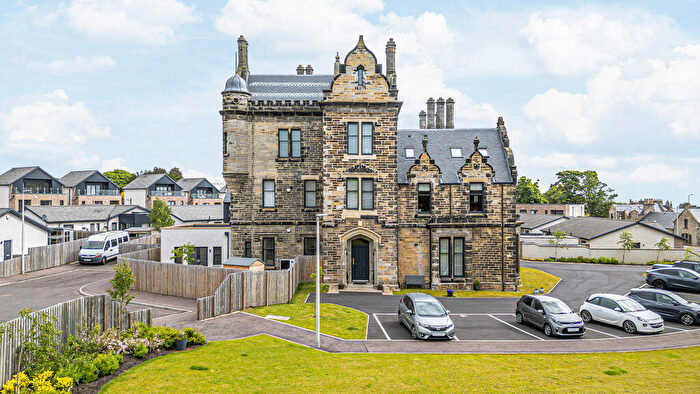
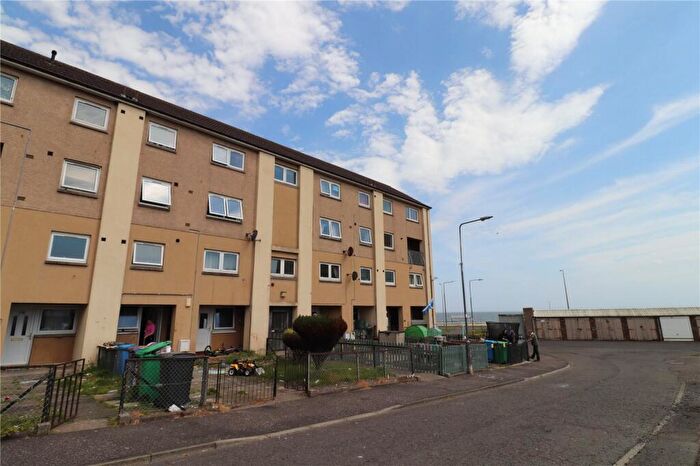
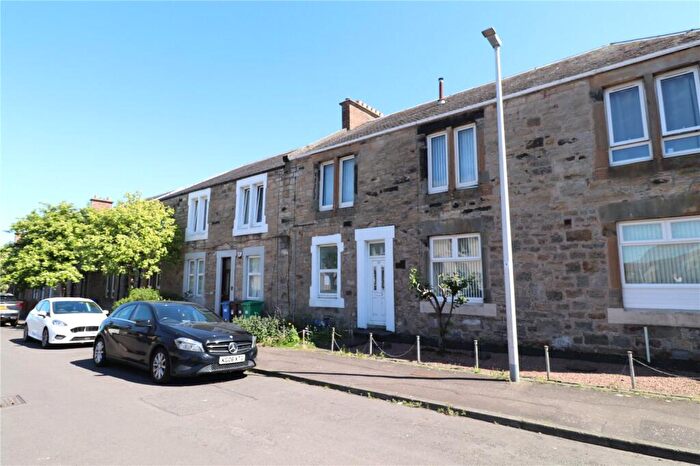
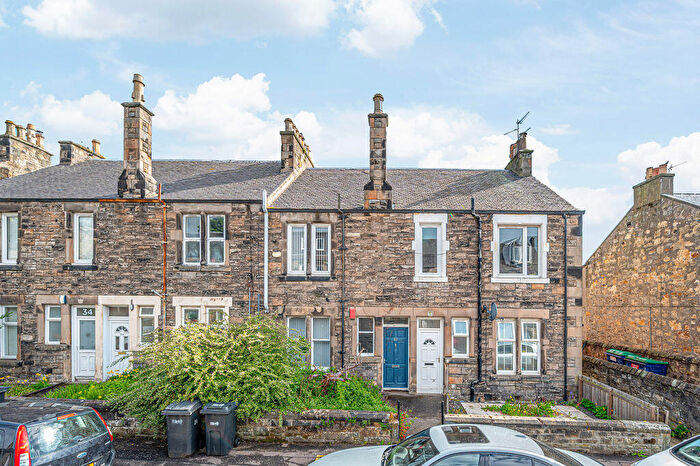
Properties for sale in Kirkcaldy

![]()
If you are looking to sell your house, let it out, or receive a property valuation, an expert can help you.
Click the button below to get started.
Neighbourhoods in Kirkcaldy
Navigate through our locations to find the location of your next house in Kirkcaldy, Fife for sale or to rent.
Property price trends in Kirkcaldy
According to the latest Registers of Scotland data, the average home in Kirkcaldy sold for £157,151 in 2025. That figure comes from a substantial record of 25,863 sales logged over the past 24 years.
Prices have moved up over the last three years. Compared with 2022, when the typical sale came in around £151,584, that's a rise of roughly 3.7%.
Looking back five years, average prices are up about 16.2% since 2020, a gain of around £21,901 in cash terms.
Zoom out to the past decade for the fuller picture. Back in 2015, homes here averaged £125,070, so the typical sold price has climbed about 25.7% since then, roughly 2.3% a year. Stretch the view to fifteen years and that annual pace edges up closer to 2.6%.
Frequently asked questions about Kirkcaldy
What is the average price for a property for sale in Kirkcaldy?
The average price for a property for sale in Kirkcaldy is £149,265. This amount is 19% lower than the average price in Fife. There are 8,116 property listings for sale in Kirkcaldy.
What locations have the most expensive properties for sale in Kirkcaldy?
The locations with the most expensive properties for sale in Kirkcaldy are Lochgelly, Cardenden and Benarty at an average of £537,000, Burntisland, Kinghorn and Western Kirkcaldy at an average of £250,405 and Kirkcaldy North at an average of £172,350.
What locations have the most affordable properties for sale in Kirkcaldy?
The locations with the most affordable properties for sale in Kirkcaldy are Kirkcaldy East at an average of £120,477, Kirkcaldy Central at an average of £132,743 and Buckhaven, Methil and Wemyss Villages at an average of £151,411.
Which train stations are available in or near Kirkcaldy?
Some of the train stations available in or near Kirkcaldy are Kirkcaldy, Glenrothes with Thornton and Kinghorn.
Property Price Paid in Kirkcaldy by Year
The average sold property price by year was:
| Year | Average Sold Price | Price Change |
Sold Properties
|
|---|---|---|---|
| 2025 | £157,151 | 8% |
626 Properties |
| 2024 | £145,018 | -0,1% |
559 Properties |
| 2023 | £145,097 | -4% |
615 Properties |
| 2022 | £151,584 | 11% |
1,066 Properties |
| 2021 | £134,778 | -0,4% |
1,100 Properties |
| 2020 | £135,250 | 1% |
901 Properties |
| 2019 | £134,505 | 3% |
1,043 Properties |
| 2018 | £130,829 | -4% |
1,046 Properties |
| 2017 | £135,598 | 6% |
1,135 Properties |
| 2016 | £128,103 | 2% |
1,139 Properties |
Transport in Kirkcaldy
Please see below transportation links in this area:
