
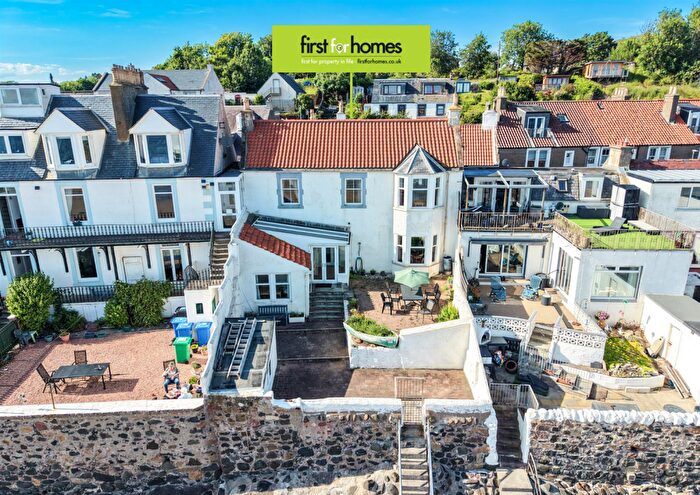
Houses for sale in Leven, Fife
House Prices in Leven
Properties in Leven have an average house price of £151k and had 1,023 Property Transactions within the last 3 years.¹
Leven is an area in Fife with 16,863 households², where the most expensive property was sold for £2.1M.
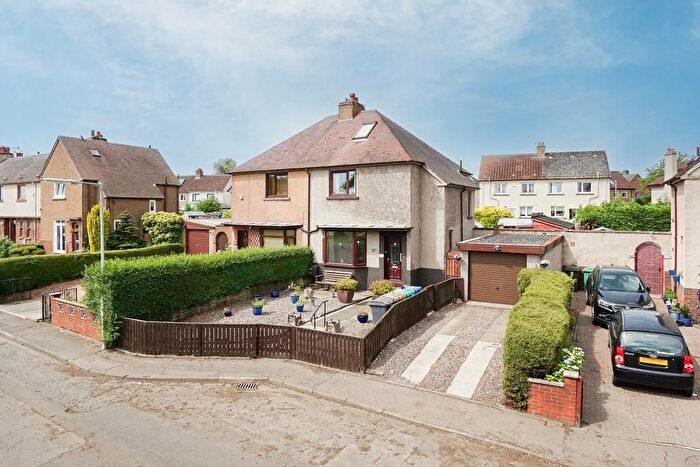
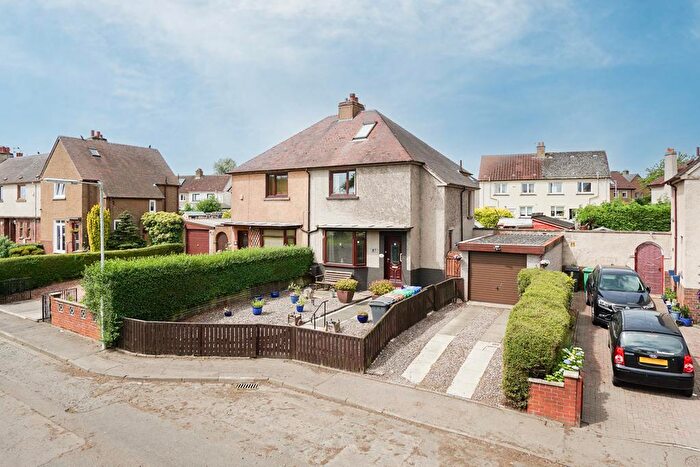
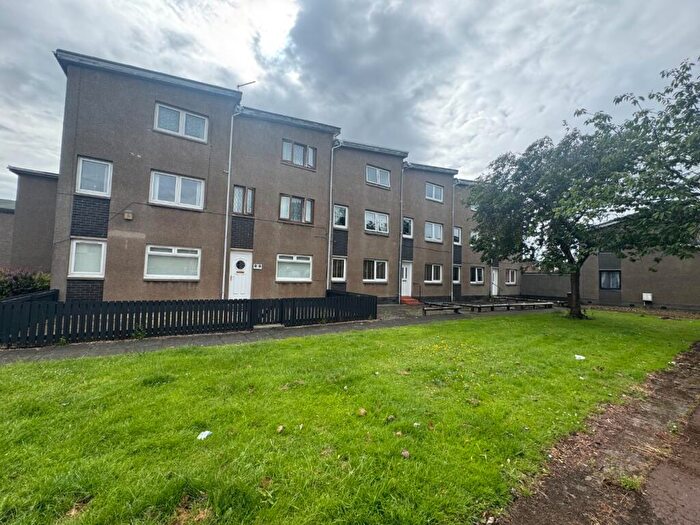
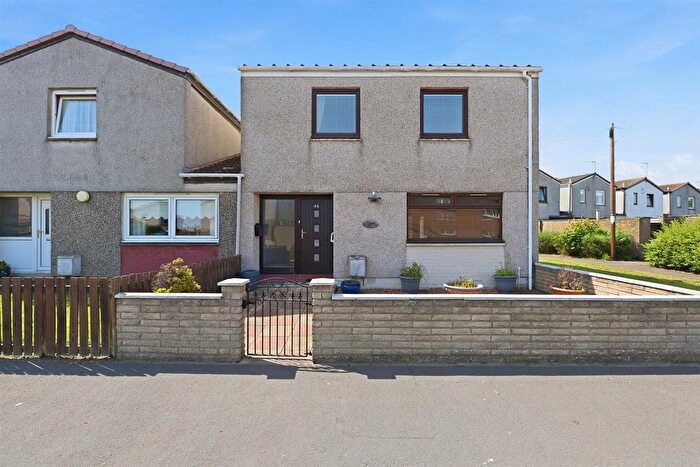
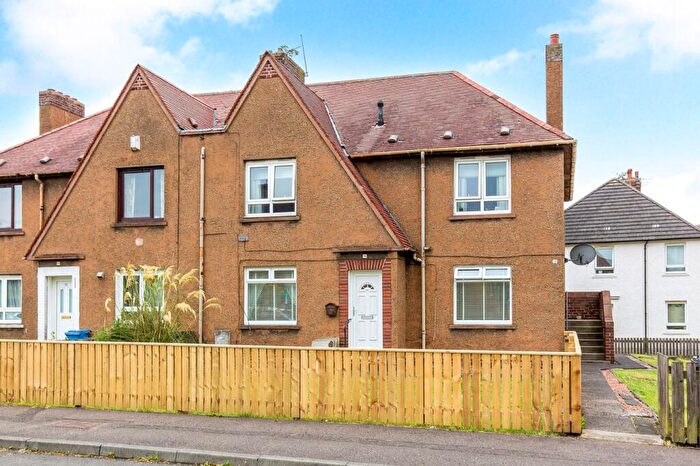
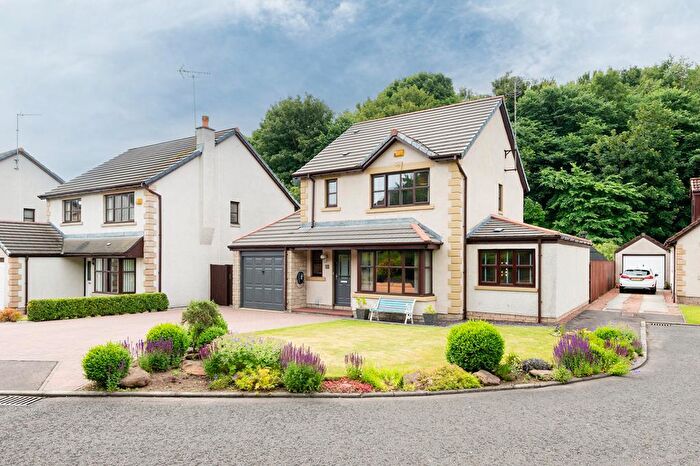
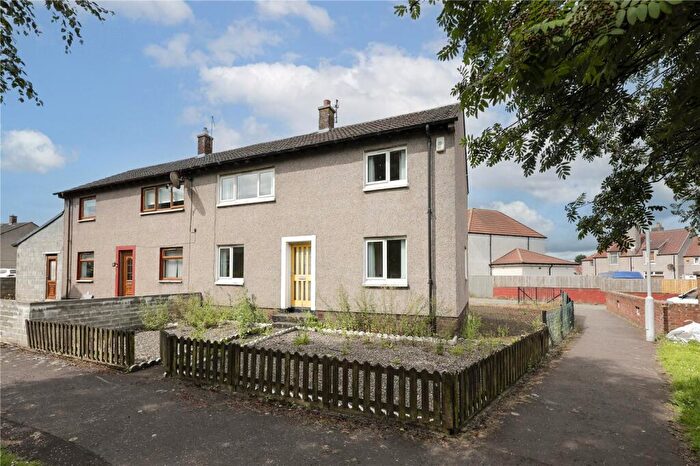
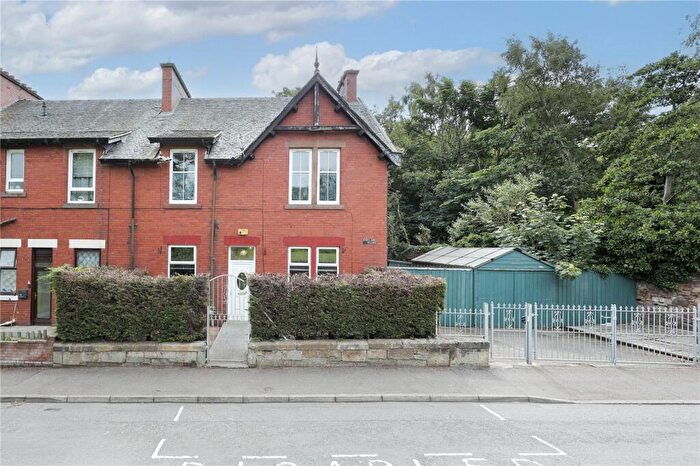
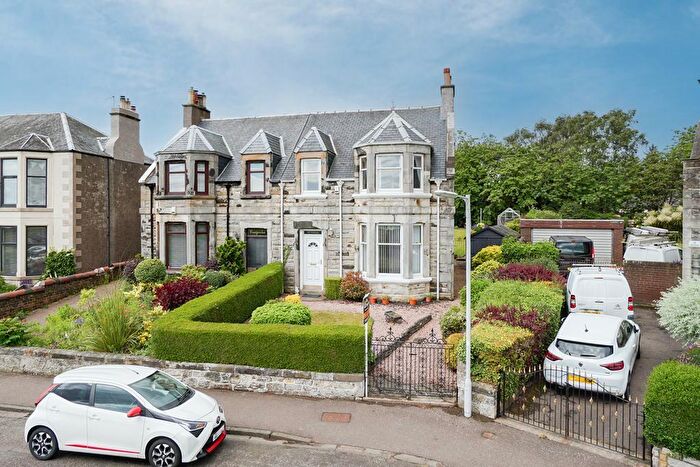
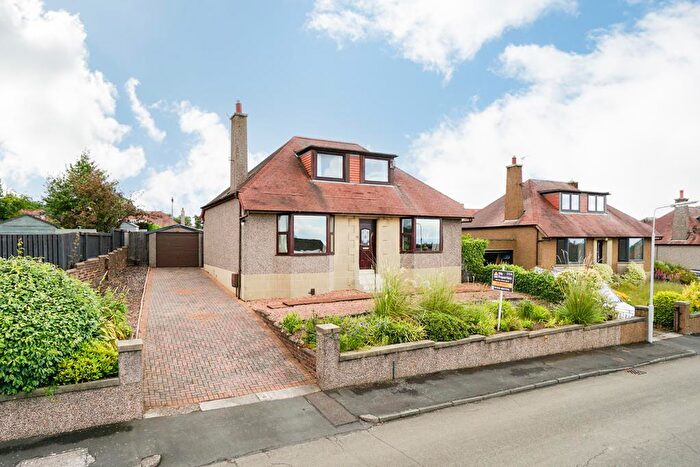
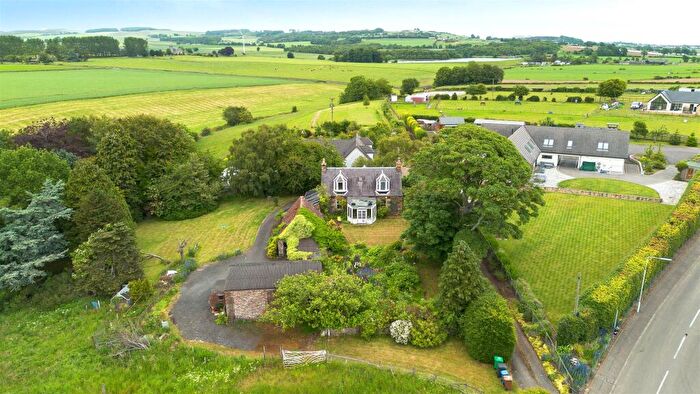
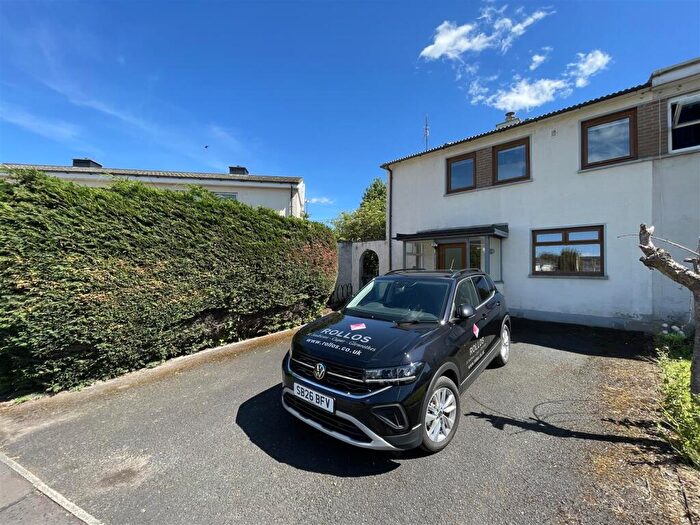
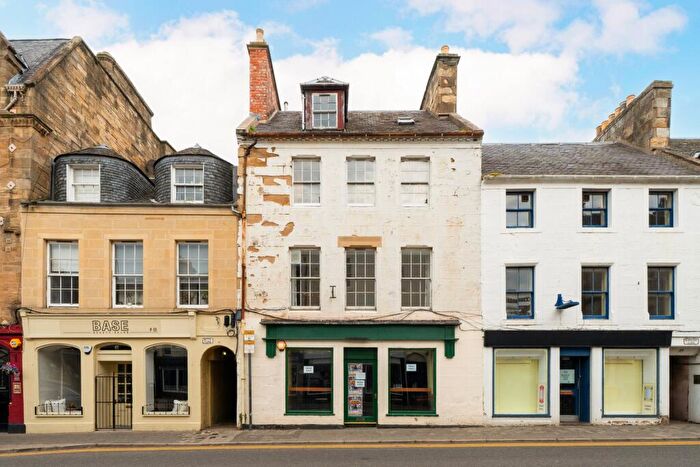
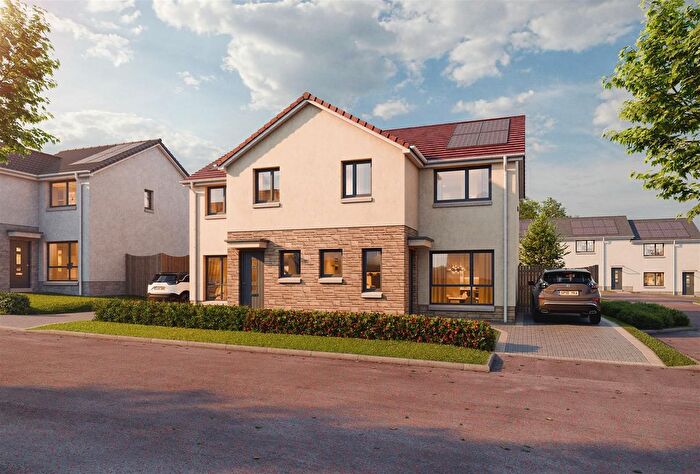
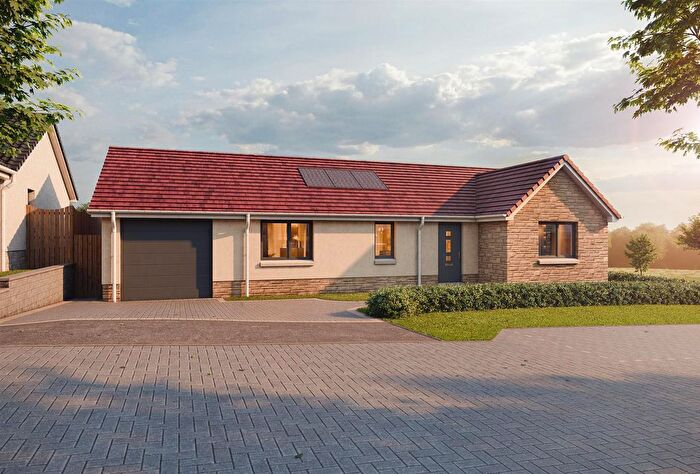
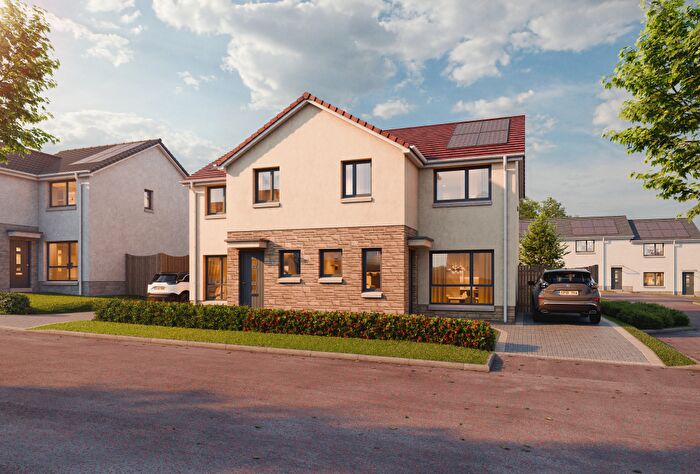
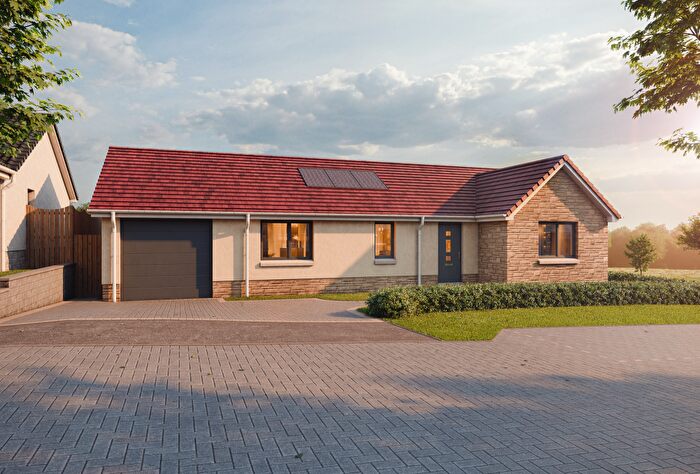
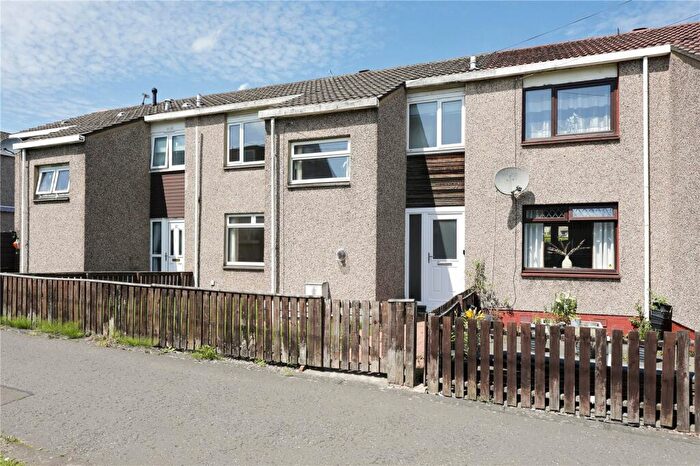
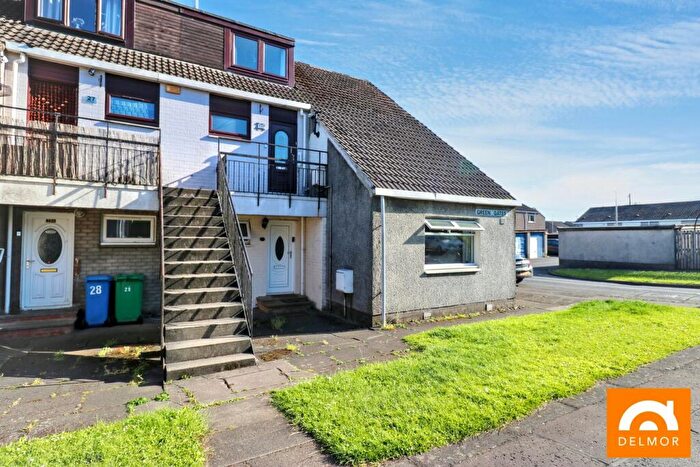
Properties for sale in Leven
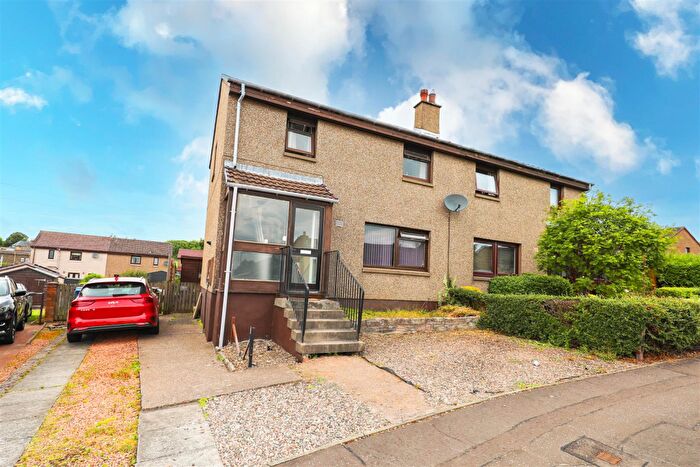
![]()
If you are looking to sell your house, let it out, or receive a property valuation, an expert can help you.
Click the button below to get started.
Neighbourhoods in Leven
Navigate through our locations to find the location of your next house in Leven, Fife for sale or to rent.
Property price trends in Leven
According to the latest Registers of Scotland data, the average home in Leven sold for £147,218 in 2025. That figure comes from a substantial record of 15,696 sales logged over the past 24 years.
Prices have fallen back over the last three years. Compared with 2022, when the typical sale came in around £163,907, that's a fall of roughly 10.2%.
Looking back five years, average prices are down about 3% since 2020, a drop of around £4,498 in cash terms.
Zoom out to the past decade for the fuller picture. Back in 2015, homes here averaged £133,018, so the typical sold price has climbed about 10.7% since then, roughly 1% a year. Stretch the view to fifteen years and that annual pace holds at about 0.9%.
Frequently asked questions about Leven
What is the average price for a property for sale in Leven?
The average price for a property for sale in Leven is £150,628. This amount is 18% lower than the average price in Fife. There are 3,276 property listings for sale in Leven.
What locations have the most expensive properties for sale in Leven?
The locations with the most expensive properties for sale in Leven are East Neuk and Landward at an average of £429,452 and Leven, Kennoway and Largo at an average of £171,357.
What locations have the most affordable properties for sale in Leven?
The location with the most affordable properties for sale in Leven is Buckhaven, Methil and Wemyss Villages at an average of £92,166.
Which train stations are available in or near Leven?
Some of the train stations available in or near Leven are Markinch, Glenrothes with Thornton and Springfield.
Property Price Paid in Leven by Year
The average sold property price by year was:
| Year | Average Sold Price | Price Change |
Sold Properties
|
|---|---|---|---|
| 2025 | £147,218 | 2% |
370 Properties |
| 2024 | £144,909 | -10% |
301 Properties |
| 2023 | £159,103 | -3% |
352 Properties |
| 2022 | £163,907 | 4% |
571 Properties |
| 2021 | £156,833 | 3% |
752 Properties |
| 2020 | £151,716 | 9% |
581 Properties |
| 2019 | £138,694 | 3% |
694 Properties |
| 2018 | £134,717 | -1% |
612 Properties |
| 2017 | £136,574 | 1% |
663 Properties |
| 2016 | £135,398 | 2% |
603 Properties |
Transport in Leven
Please see below transportation links in this area:
