
Houses for sale & to rent in KY2 5AT, Matthew Street, Kirkcaldy Central, Kirkcaldy
House Prices in KY2 5AT, Matthew Street, Kirkcaldy Central
Properties in KY2 5AT have an average house price of £238k and had 1 Property Transaction within the last 3 years.¹ KY2 5AT is a postcode in Matthew Street located in Kirkcaldy Central, an area in Kirkcaldy, Fife, with 16 households², where the most expensive property was sold for £238k.
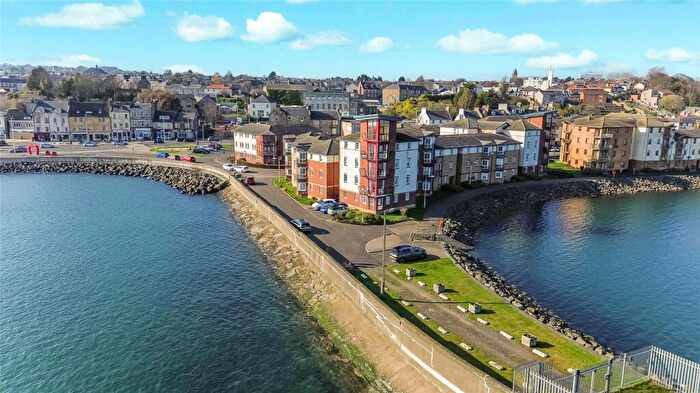
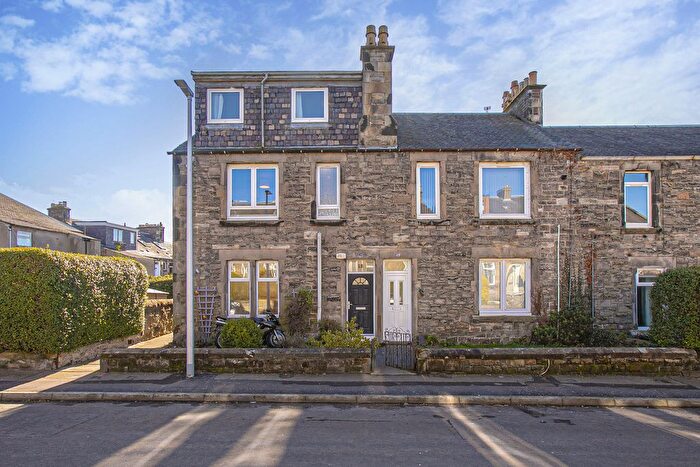
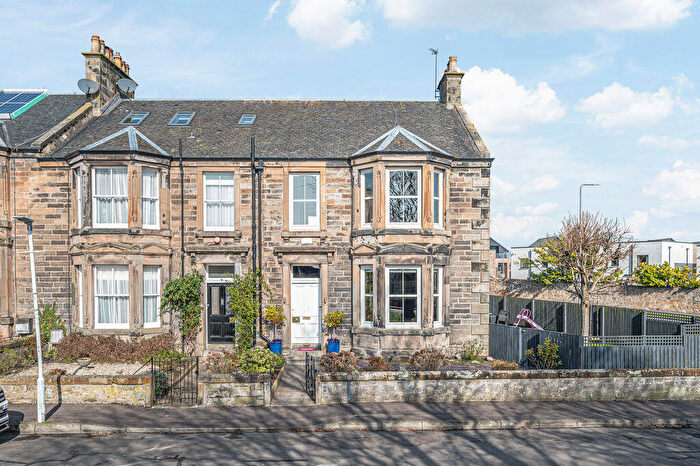
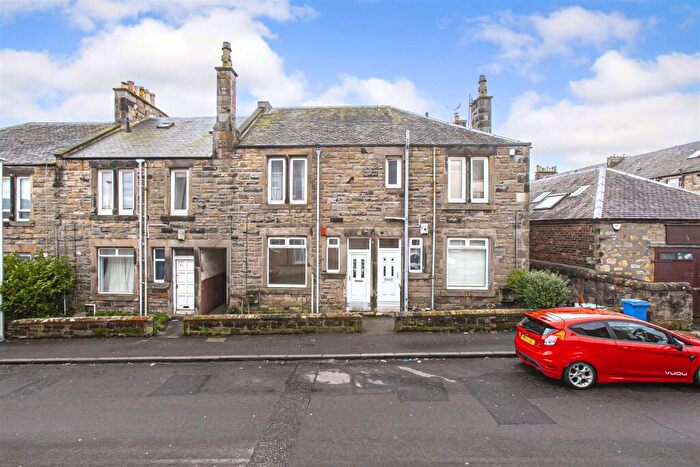
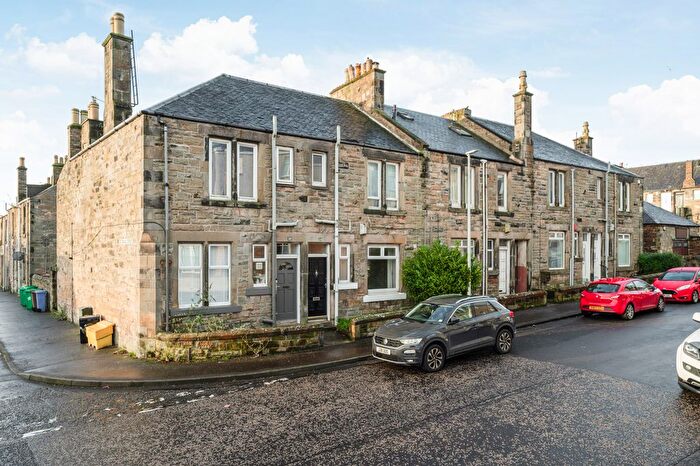
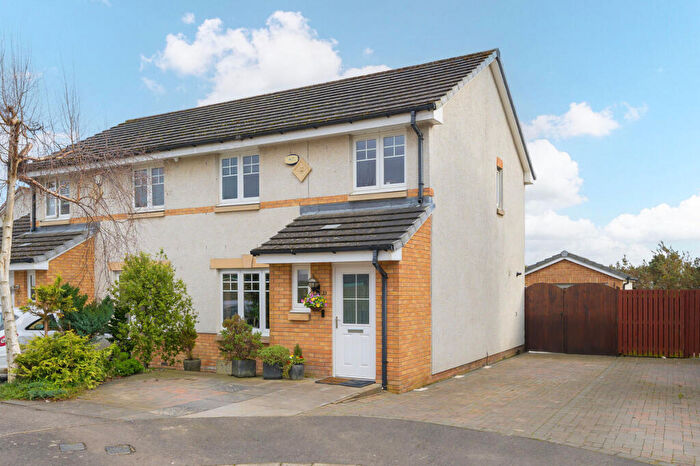
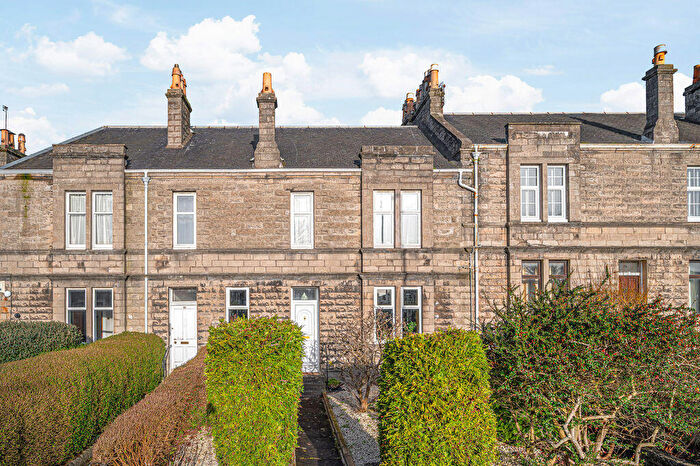
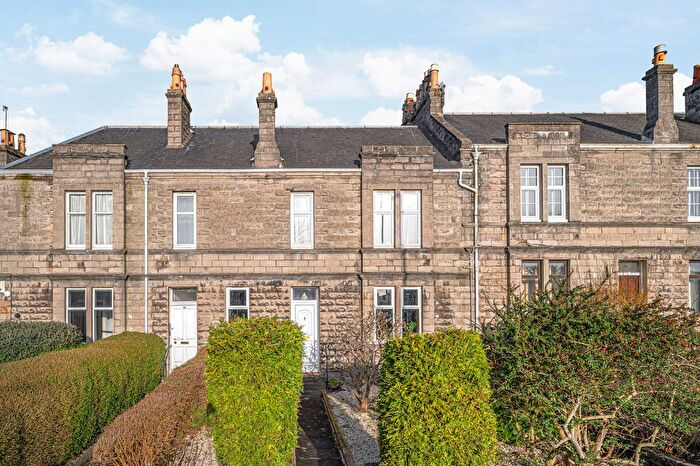
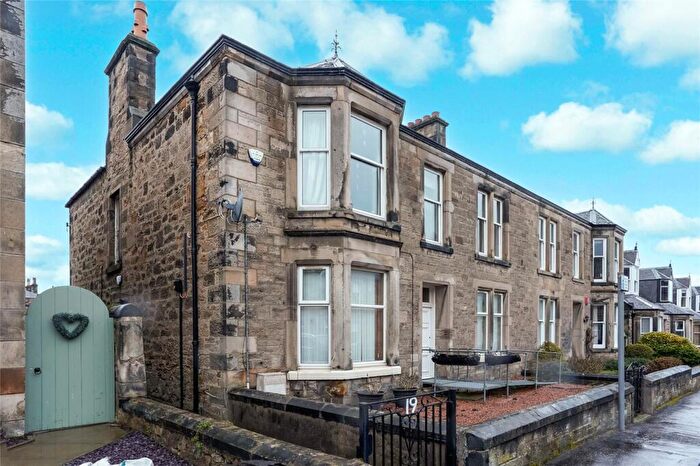
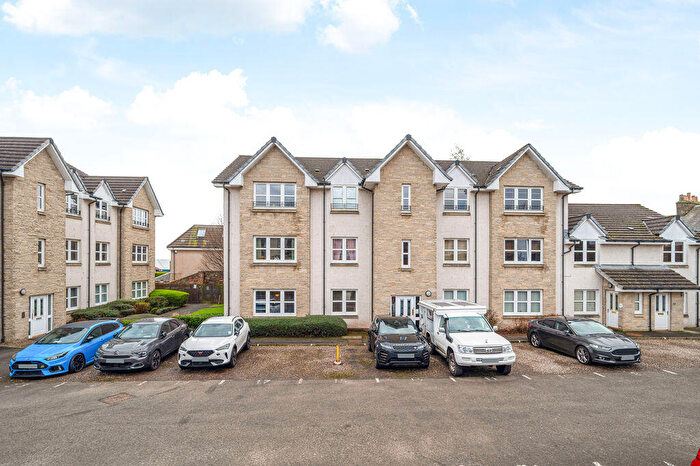
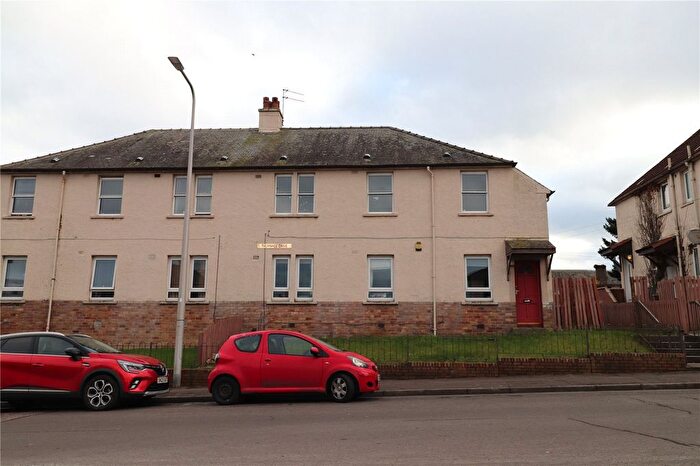
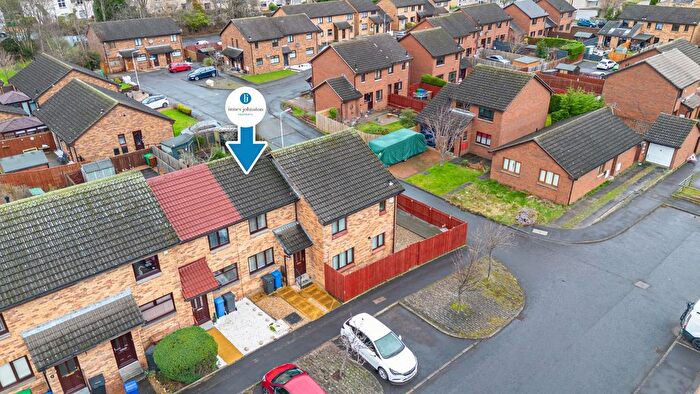
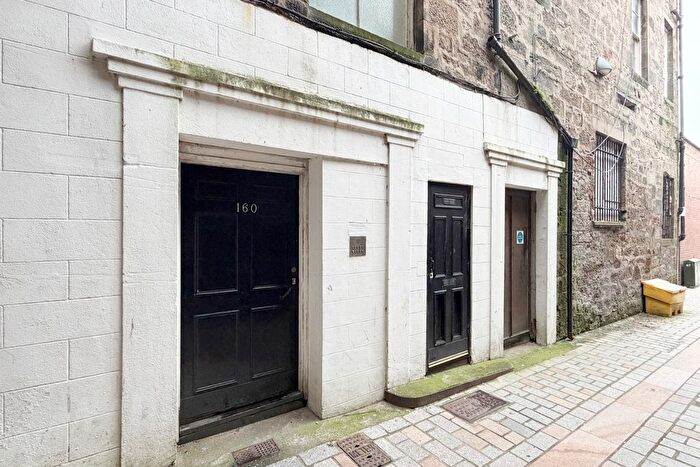
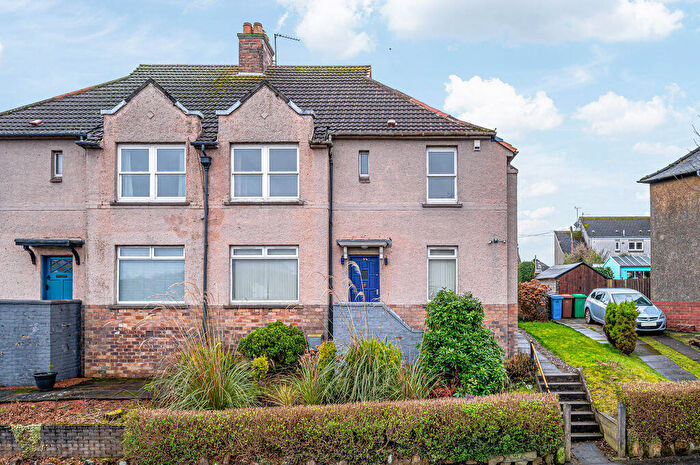
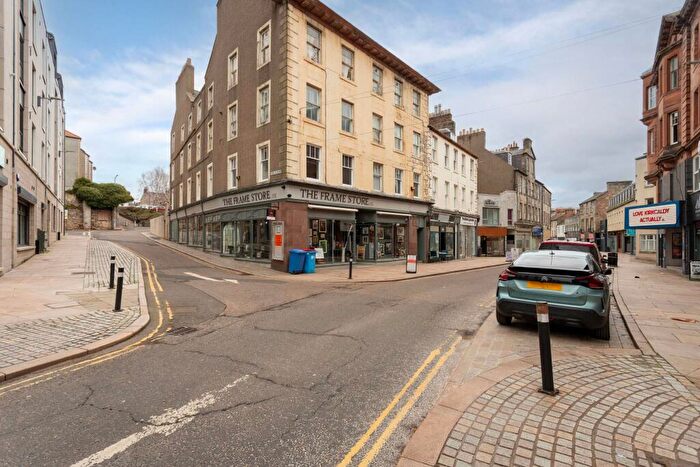
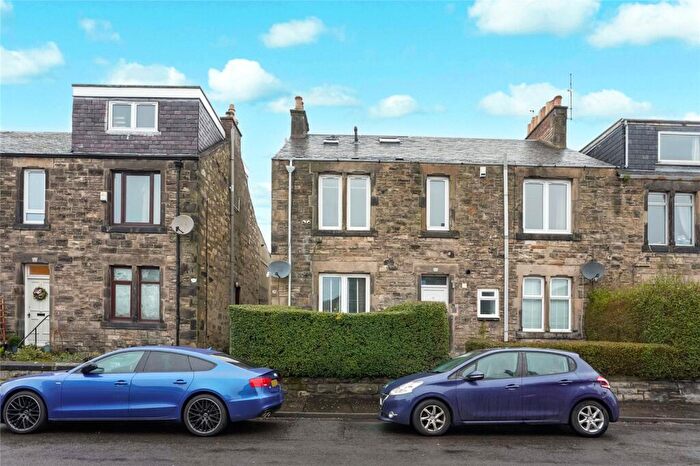
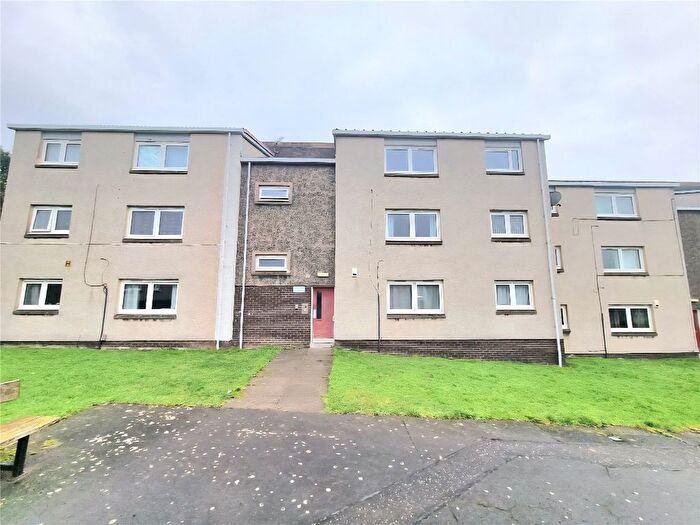
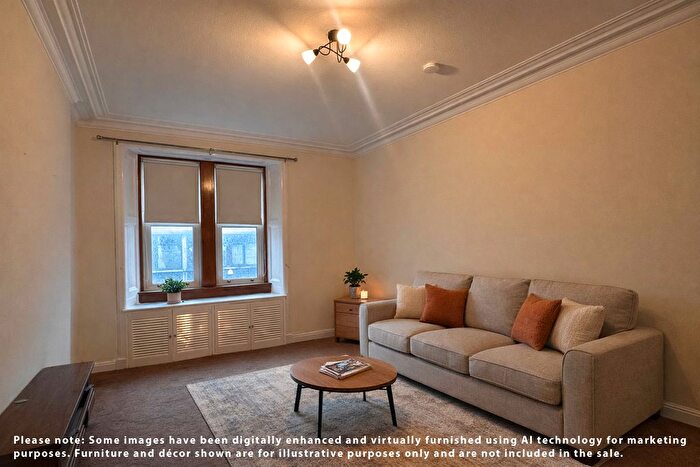
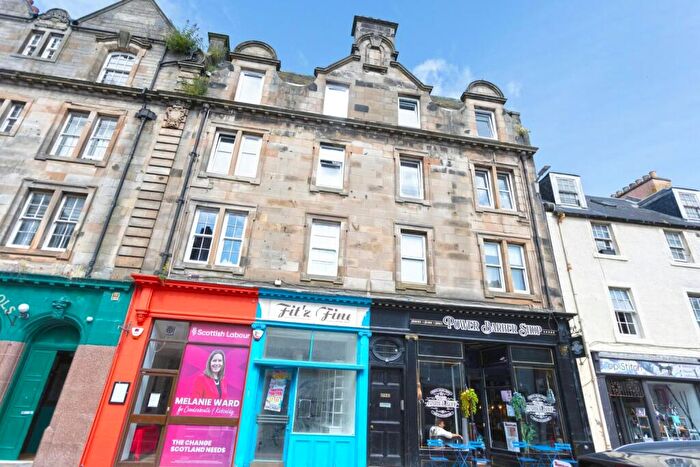
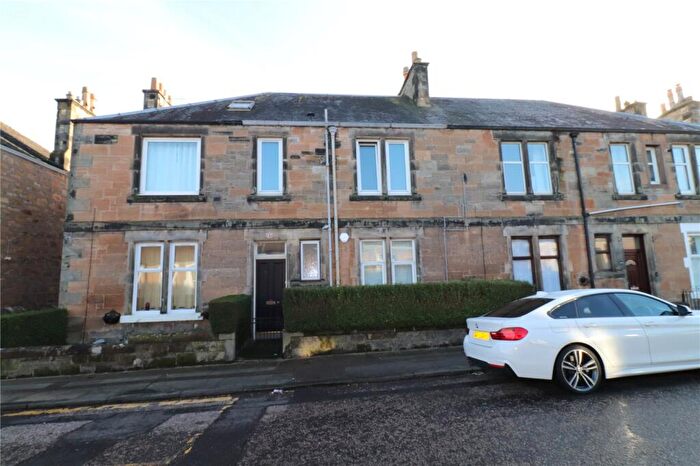
Properties for sale near KY2 5AT, Matthew Street
![]()
If you are looking to sell your house, let it out, or receive a property valuation, an expert can help you.
Click the button below to get started.


Price Paid in Matthew Street, KY2 5AT, Kirkcaldy Central
20 Matthew Street, KY2 5AT, Kirkcaldy Central Kirkcaldy
Property 20 has been sold 3 times. The last time it was sold was in 27/11/2024 and the sold price was £238,000.00.
This is a Property which was sold as a New Build in 27/11/2024
| Date | Price | Classification |
|---|---|---|
| 27/11/2024 | £238,000.00 | New Build |
| 02/10/2018 | £176,000.00 | Established Building |
| 21/07/2008 | £125,000.00 | Established Building |
5 Matthew Street, KY2 5AT, Kirkcaldy Central Kirkcaldy
Property 5 has been sold 4 times. The last time it was sold was in 16/08/2021 and the sold price was £100,500.00.
This is a Property which was sold as an Established Building in 16/08/2021
| Date | Price | Classification |
|---|---|---|
| 16/08/2021 | £100,500.00 | Established Building |
| 21/10/2020 | £105,500.00 | New Build |
| 22/01/2008 | £90,500.00 | Established Building |
| 15/08/2002 | £46,000.00 | Established Building |
5 First Floor Left Matthew Street, KY2 5AT, Kirkcaldy Central Kirkcaldy
Property 5 First Floor Left has been sold 1 time. The last time it was sold was in 16/03/2020 and the sold price was £43,000.00.
This is a Property which was sold as an Established Building in 16/03/2020
| Date | Price | Classification |
|---|---|---|
| 16/03/2020 | £43,000.00 | Established Building |
12 Matthew Street, KY2 5AT, Kirkcaldy Central Kirkcaldy
Property 12 has been sold 1 time. The last time it was sold was in 17/05/2012 and the sold price was £108,000.00.
This is a Property which was sold as an Established Building in 17/05/2012
| Date | Price | Classification |
|---|---|---|
| 17/05/2012 | £108,000.00 | Established Building |
6 Matthew Street, KY2 5AT, Kirkcaldy Central Kirkcaldy
Property 6 has been sold 2 times. The last time it was sold was in 16/12/2011 and the sold price was £154,500.00.
This is a Property which was sold as an Established Building in 16/12/2011
| Date | Price | Classification |
|---|---|---|
| 16/12/2011 | £154,500.00 | Established Building |
| 09/11/2007 | £176,500.00 | Established Building |
14 Matthew Street, KY2 5AT, Kirkcaldy Central Kirkcaldy
Property 14 has been sold 1 time. The last time it was sold was in 02/08/2007 and the sold price was £156,000.00.
This is a Property which was sold as an Established Building in 02/08/2007
| Date | Price | Classification |
|---|---|---|
| 02/08/2007 | £156,000.00 | Established Building |
24 Matthew Street, KY2 5AT, Kirkcaldy Central Kirkcaldy
Property 24 has been sold 3 times. The last time it was sold was in 05/07/2005 and the sold price was £149,950.00.
This is a Property which was sold as an Established Building in 05/07/2005
| Date | Price | Classification |
|---|---|---|
| 05/07/2005 | £149,950.00 | Established Building |
| 03/11/2003 | £110,000.00 | Established Building |
| 28/01/2002 | £46,057.00 | Established Building |
22 Matthew Street, KY2 5AT, Kirkcaldy Central Kirkcaldy
Property 22 has been sold 2 times. The last time it was sold was in 18/02/2004 and the sold price was £110,000.00.
This is a Property which was sold as an Established Building in 18/02/2004
| Date | Price | Classification |
|---|---|---|
| 18/02/2004 | £110,000.00 | Established Building |
| 21/05/2003 | £60,000.00 | Established Building |
Transport near KY2 5AT, Matthew Street

House price paid reports for KY2 5AT, Matthew Street
Click on the buttons below to see price paid reports by year or property price:
- Price Paid By Year
Property Price Paid in KY2 5AT, Matthew Street by Year
The average sold property price by year was:
| Year | Average Sold Price | Price Change |
Sold Properties
|
|---|---|---|---|
| 2024 | £238,000 | 58% |
1 Property |
| 2021 | £100,500 | 26% |
1 Property |
| 2020 | £74,250 | -137% |
2 Properties |
| 2018 | £176,000 | 39% |
1 Property |
| 2012 | £108,000 | -43% |
1 Property |
| 2011 | £154,500 | 30% |
1 Property |
| 2008 | £107,750 | -54% |
2 Properties |
| 2007 | £166,250 | 10% |
2 Properties |
| 2005 | £149,950 | 27% |
1 Property |
| 2004 | £110,000 | 23% |
1 Property |
| 2003 | £85,000 | 46% |
2 Properties |
| 2002 | £46,028 | - |
2 Properties |