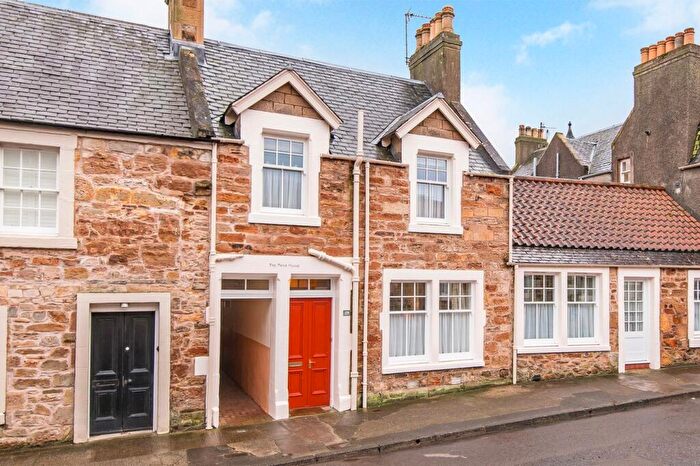
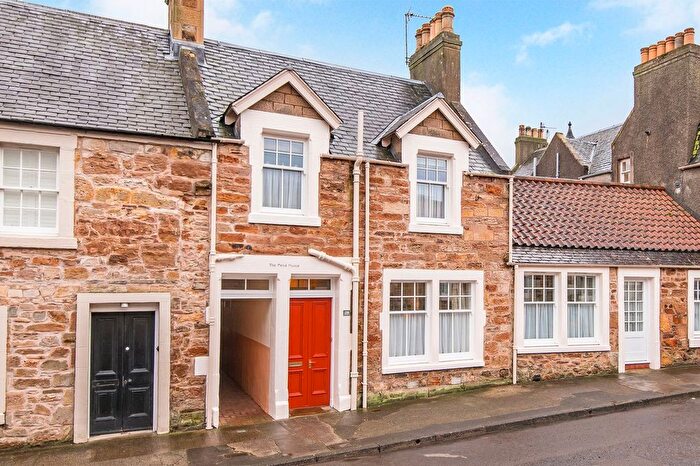
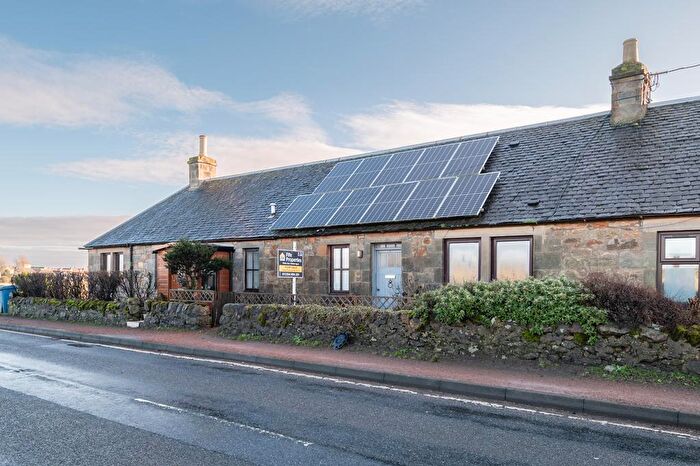
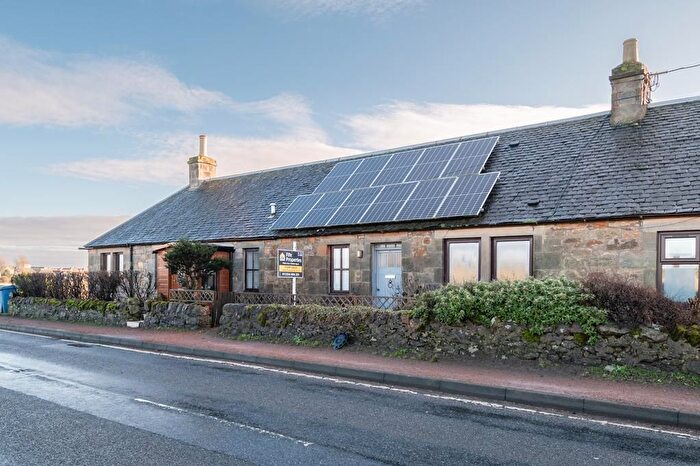
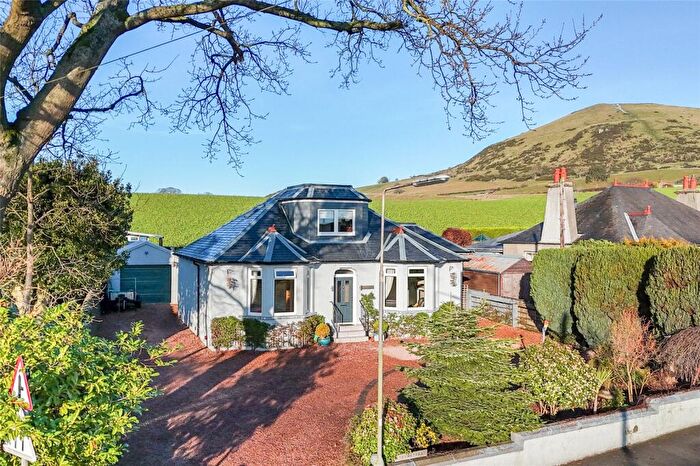
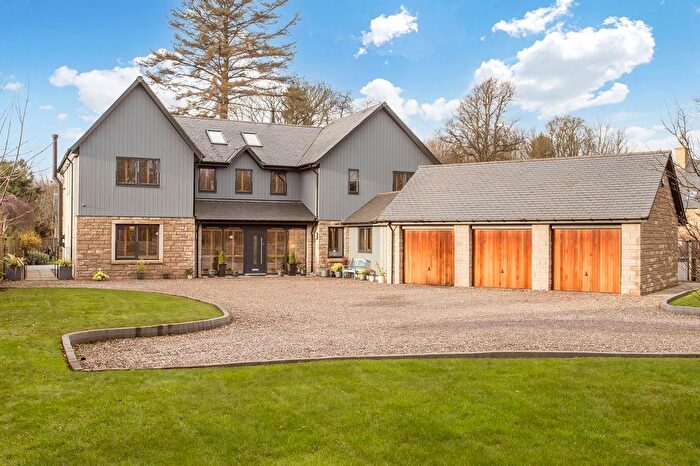
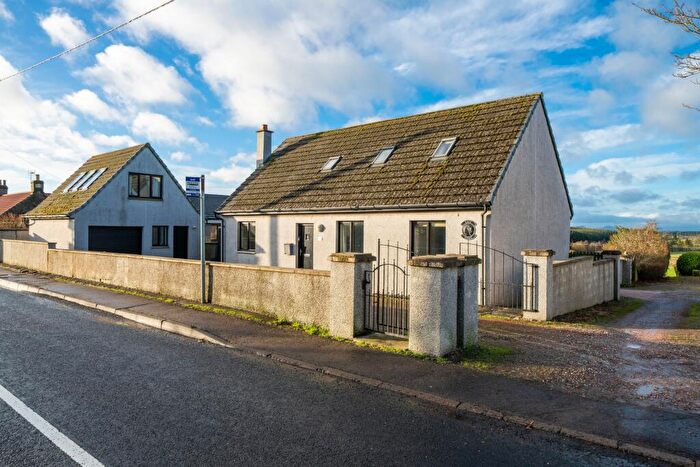
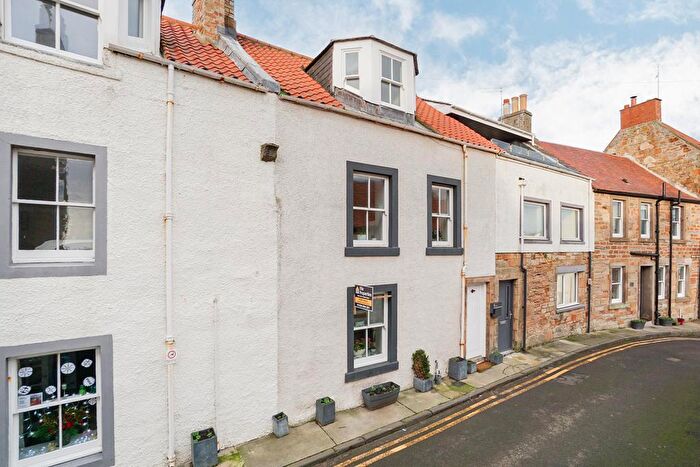
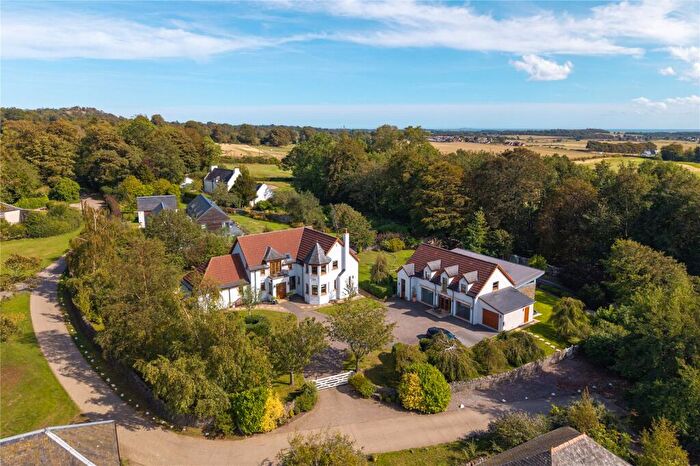
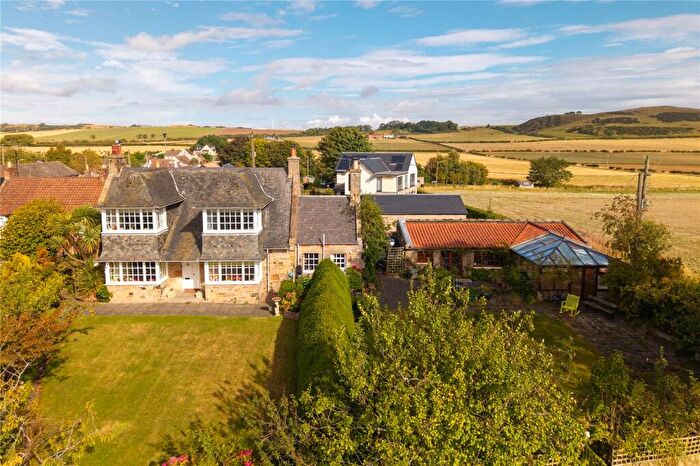
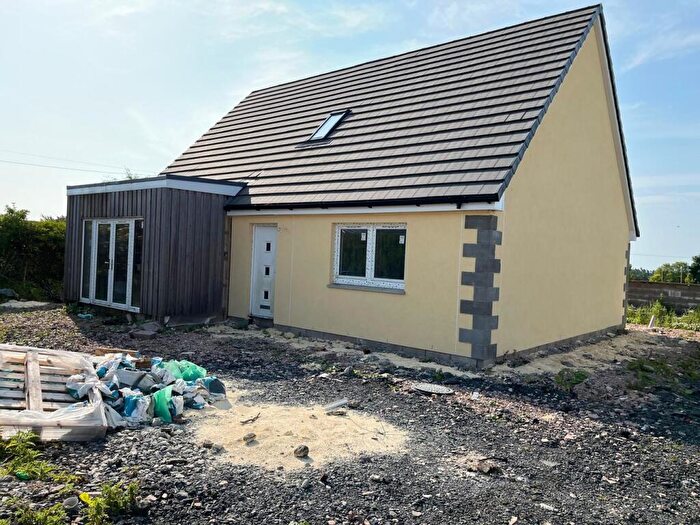
Houses for sale & to rent in East Neuk and Landward, Leven
House Prices in East Neuk and Landward
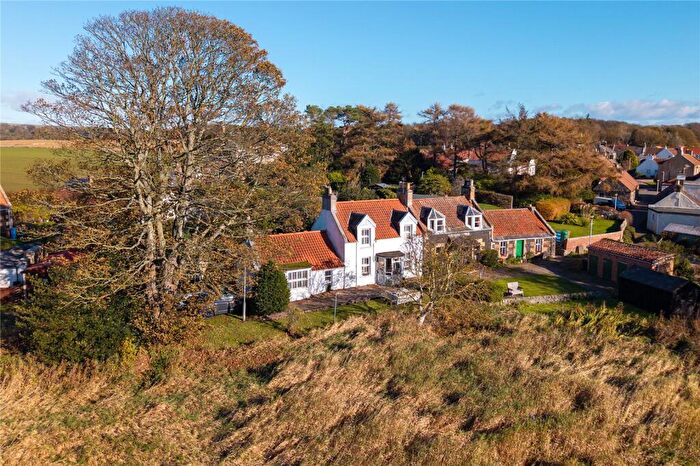
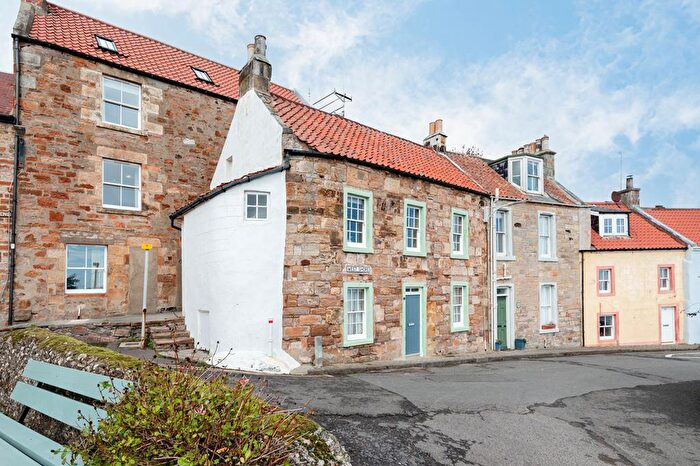
Properties in East Neuk and Landward have an average house price of £387,250.00 and had 8 Property Transactions within the last 3 years¹.
East Neuk and Landward is an area in Leven, Fife with 1,053 households², where the most expensive property was sold for £675,000.00.
Properties for sale in East Neuk and Landward
Roads and Postcodes in East Neuk and Landward
Navigate through our locations to find the location of your next house in East Neuk and Landward, Leven for sale or to rent.
| Streets | Postcodes |
|---|---|
| Admiralty Lane | KY9 1BJ |
| Admiralty Square | KY9 1BN |
| Allan Place | KY9 1AA |
| Baird Place | KY9 1EH |
| Balbuthie Road | KY9 1LE |
| Bank Street | KY9 1BL KY9 1BW KY9 1EF |
| Barnyards | KY9 1LB |
| Berryside Terrace | KY8 5TG |
| Blakely Hill Court | KY9 1JJ |
| Braehead Lane | KY9 1BS |
| Bruce Square | KY9 1LA |
| Castwell Wynd | KY9 1AB |
| Cavell Place | KY9 1AT |
| Chapel Green | KY9 1AD |
| Chapmans Place | KY9 1BT |
| Conacher Court | KY9 1JZ |
| Cupar Road | KY9 1HX |
| Durham Place | KY9 1HU |
| Fairfield Road | KY9 1LJ KY9 1LL |
| Ferry Road | KY9 1AJ |
| Fountain Road | KY9 1BX |
| Glovers Wynd | KY9 1AE |
| Grange | KY9 1AN |
| Grange Road | KY9 1AL |
| Grangehill | KY9 1AR |
| Greenbrig Road | KY9 1PA |
| Hall Park | KY9 1HF |
| High Street | KY9 1AF KY9 1AG KY9 1AH KY9 1AQ KY9 1BY KY9 1BZ KY9 1DA KY9 1DB |
| Kilconquhar Steading Way | KY9 1FB |
| Kingsloan Court | KY9 1JH |
| Kirk Park Road | KY9 1DG |
| Kirk Wynd | KY9 1PB |
| Lathones | KY9 1JE |
| Liberty | KY9 1AU |
| Links Place | KY9 1AX KY9 1EJ |
| Links Road | KY9 1AW |
| Lodge Walk | KY9 1DD KY9 1EE |
| Main Street | KY9 1LF KY9 1LG KY9 1LN KY9 1LP KY9 1LQ KY9 1LR KY9 1LS KY9 1LW KY8 5FU |
| Marine Park | KY9 1BD |
| Mayfield Terrace | KY9 1LT |
| Meadow Road | KY9 1PD |
| Mid Street | KY9 1HY |
| North Street | KY9 1DQ |
| North Wynd | KY9 1LU |
| Park Place | KY9 1DH |
| Rankeillor Street | KY9 1DJ |
| Rotten Row | KY9 1AY |
| Sahara Park | KY9 1BB |
| School Wynd | KY9 1DL |
| Siward Lane | KY9 1AZ |
| South Street | KY9 1DN |
| South Wynd | KY9 1LX |
| St Andrews Road | KY9 1HT KY9 1HZ KY9 1PE |
| Steading View | KY9 1FA |
| Stenton Row | KY9 1DP |
| The Dale | KY9 1LY |
| The Granary | KY9 1EG |
| The Shore | KY9 1AP |
| The Terrace | KY9 1DS |
| The Vennel | KY9 1DR |
| Toft | KY9 1DT |
| Wadeslea | KY9 1EA KY9 1EB |
| Williamsburgh | KY9 1BA |
| Woodside | KY8 5TE |
| Woodside Crescent | KY9 1DY |
| Woodside Place | KY9 1DZ |
| Woodside Road | KY9 1DU KY9 1DX |
| KY8 5PD KY8 5PF KY8 5PH KY8 5PJ KY8 5PL KY8 5PQ KY8 5QE KY8 5QF KY8 5QH KY8 5QJ KY8 5QL KY8 5QN KY8 5QP KY8 5QQ KY8 5QR KY8 5QW KY8 5TF KY8 6JE KY8 6JF KY8 6JG KY8 6JQ KY9 1AS KY9 1EL KY9 1ER KY9 1EU KY9 1EX KY9 1EZ KY9 1HA KY9 1HB KY9 1HD KY9 1HE KY9 1HG KY9 1HH KY9 1HJ KY9 1HL KY9 1HN KY9 1HP KY9 1HQ KY9 1HR KY9 1HS KY9 1HW KY9 1JA KY9 1JB KY9 1JD KY9 1JF KY9 1JG KY9 1JS KY9 1JT KY9 1JU KY9 1JX KY9 1JY KY9 1LH |
Transport near East Neuk and Landward
-
Cupar Station
-
Springfield Station
-
Markinch Station
-
Leuchars Station
-
Ladybank Station
-
North Berwick Station
-
Glenrothes with Thornton Station
-
Kirkcaldy Station
-
Drem Station
- FAQ
- Price Paid By Year
Frequently asked questions about East Neuk and Landward
What is the average price for a property for sale in East Neuk and Landward?
The average price for a property for sale in East Neuk and Landward is £387,250. This amount is 170% higher than the average price in Leven. There are 352 property listings for sale in East Neuk and Landward.
Which train stations are available in or near East Neuk and Landward?
Some of the train stations available in or near East Neuk and Landward are Cupar, Springfield and Markinch.
Property Price Paid in East Neuk and Landward by Year
The average sold property price by year was:
| Year | Average Sold Price | Price Change |
Sold Properties
|
|---|---|---|---|
| 2023 | £387,250 | 8% |
8 Properties |
| 2022 | £356,425 | -12% |
43 Properties |
| 2021 | £397,439 | 14% |
69 Properties |
| 2020 | £340,267 | -0,2% |
55 Properties |
| 2019 | £340,832 | 13% |
48 Properties |
| 2018 | £295,392 | -10% |
40 Properties |
| 2017 | £325,443 | 2% |
48 Properties |
| 2016 | £319,821 | 7% |
70 Properties |
| 2015 | £296,602 | 1% |
53 Properties |
| 2014 | £293,487 | 7% |
44 Properties |
| 2013 | £274,300 | 2% |
52 Properties |
| 2012 | £269,917 | -23% |
37 Properties |
| 2011 | £330,955 | -8% |
46 Properties |
| 2010 | £357,275 | 36% |
31 Properties |
| 2009 | £227,498 | -55% |
36 Properties |
| 2008 | £351,681 | 3% |
68 Properties |
| 2007 | £340,555 | 40% |
55 Properties |
| 2006 | £205,424 | -7% |
55 Properties |
| 2005 | £220,427 | 29% |
65 Properties |
| 2004 | £156,583 | -2% |
65 Properties |
| 2003 | £159,852 | 31% |
74 Properties |
| 2002 | £109,544 | -43% |
69 Properties |
| 2001 | £156,220 | - |
5 Properties |

