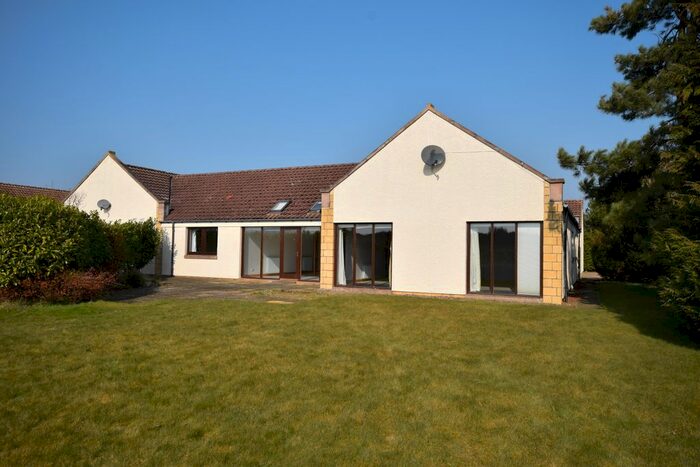
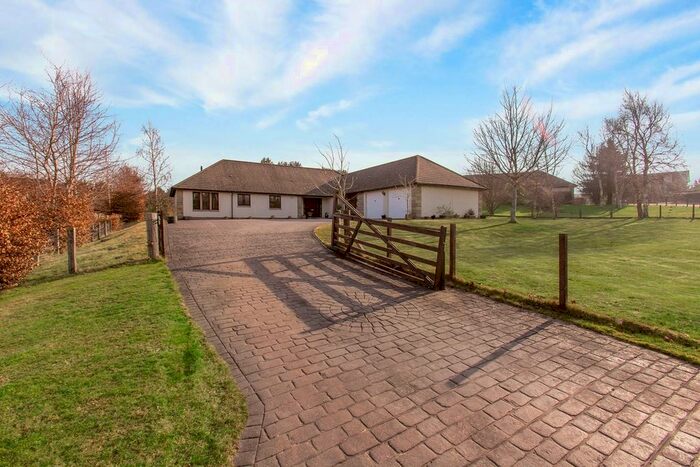
Houses for sale & to rent in KY16 0BU, Tay Bridgehead, St Andrews
House Prices in KY16 0BU, Tay Bridgehead
Properties in KY16 0BU have no sales history available within the last 3 years. KY16 0BU is a postcode in Tay Bridgehead, an area in St Andrews, Fife, with 3 households².
Properties for sale near KY16 0BU
Previously listed properties near KY16 0BU
Price Paid in KY16 0BU, Tay Bridgehead
The Bield Pickletillum KY16 0BU, Tay Bridgehead St Andrews
Property The Bield Pickletillum has been sold 5 times. The last time it was sold was in 20/04/2021 and the sold price was £210,000.00.
This is a Property which was sold as an Established Building in 20/04/2021
| Date | Price | Classification |
|---|---|---|
| 20/04/2021 | £210,000.00 | Established Building |
| 01/10/2019 | £190,000.00 | Established Building |
| 16/04/2014 | £155,000.00 | Established Building |
| 16/02/2004 | £103,000.00 | Established Building |
| 28/03/2002 | £62,265.00 | Established Building |
Wayside Cottage Pickletillum KY16 0BU, Tay Bridgehead St Andrews
Property Wayside Cottage Pickletillum has been sold 1 time. The last time it was sold was in 08/02/2017 and the sold price was £28,000.00.
This is a Property which was sold as an Established Building in 08/02/2017
| Date | Price | Classification |
|---|---|---|
| 08/02/2017 | £28,000.00 | Established Building |
Fordell Bank Pickletillum KY16 0BU, Tay Bridgehead St Andrews
Property Fordell Bank Pickletillum has been sold 1 time. The last time it was sold was in 17/12/2013 and the sold price was £173,500.00.
This is a Property which was sold as an Established Building in 17/12/2013
| Date | Price | Classification |
|---|---|---|
| 17/12/2013 | £173,500.00 | Established Building |
Transport near KY16 0BU
House price paid reports for KY16 0BU
Click on the buttons below to see price paid reports by year or property price:
- Price Paid By Year
Property Price Paid in KY16 0BU by Year
The average sold property price by year was:
| Year | Average Sold Price | Price Change |
Sold Properties
|
|---|---|---|---|
| 2021 | £210,000 | 10% |
1 Property |
| 2019 | £190,000 | 85% |
1 Property |
| 2017 | £28,000 | -454% |
1 Property |
| 2014 | £155,000 | -12% |
1 Property |
| 2013 | £173,500 | 41% |
1 Property |
| 2004 | £103,000 | 40% |
1 Property |
| 2002 | £62,265 | - |
1 Property |

