
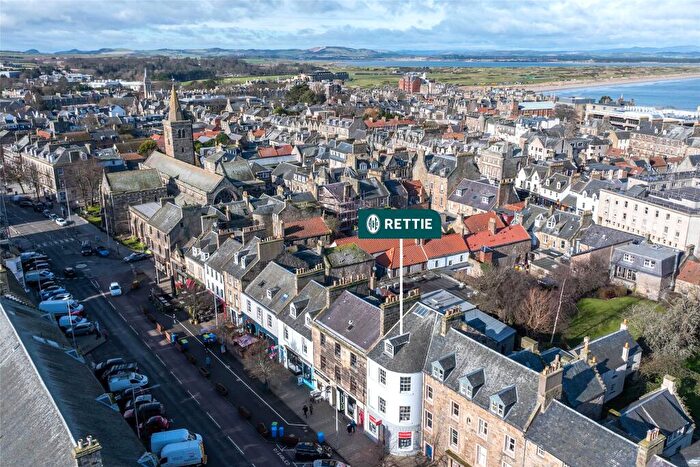
Houses for sale & to rent in St Andrews, Fife
House Prices in St Andrews
Properties in St Andrews have an average house price of £404k and had 459 Property Transactions within the last 3 years.¹
St Andrews is an area in Fife with 9,101 households², where the most expensive property was sold for £2.29M.
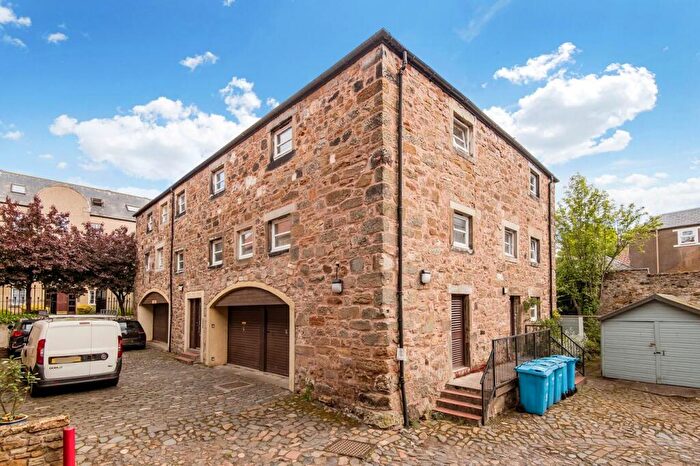
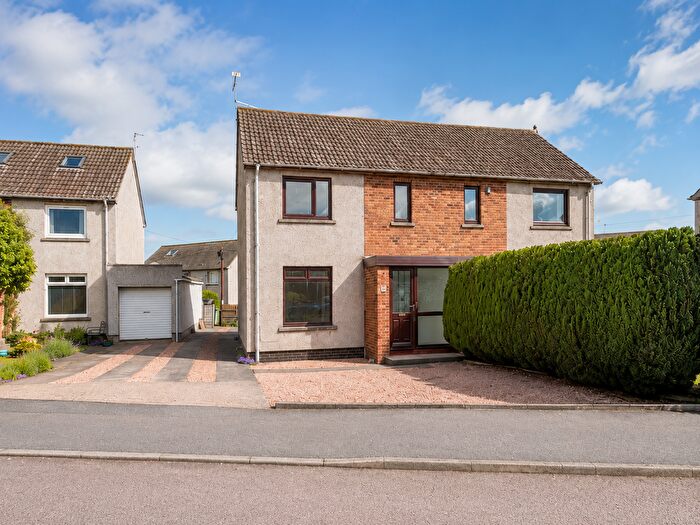
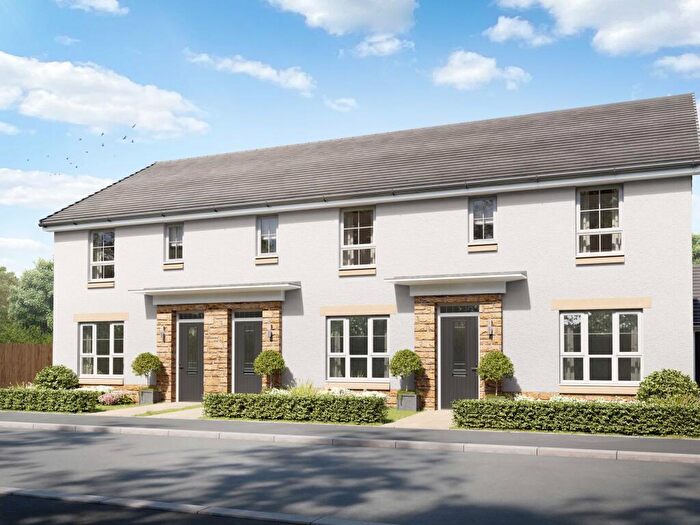
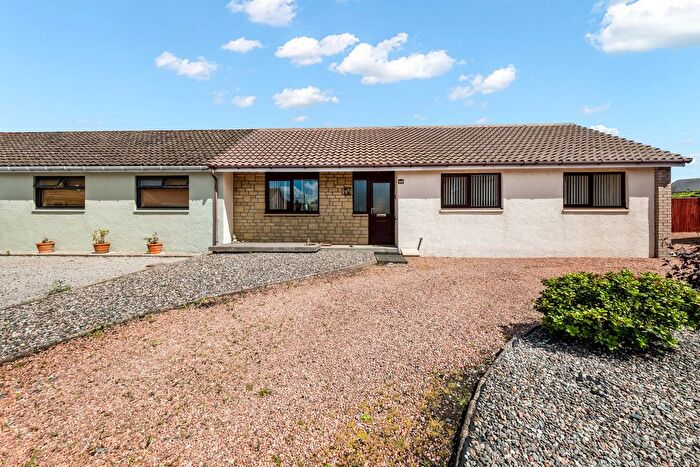
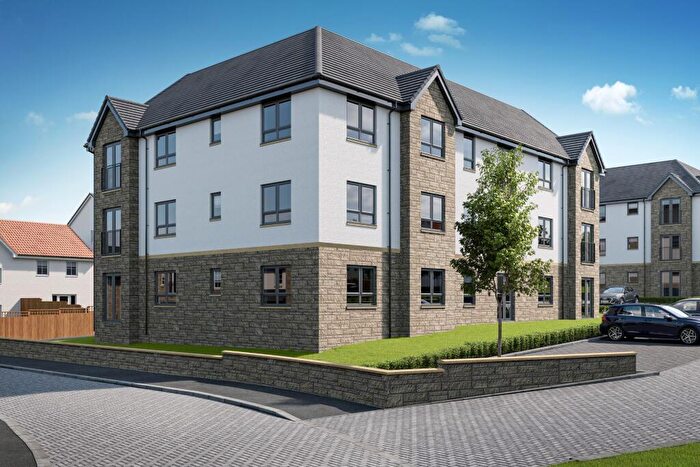
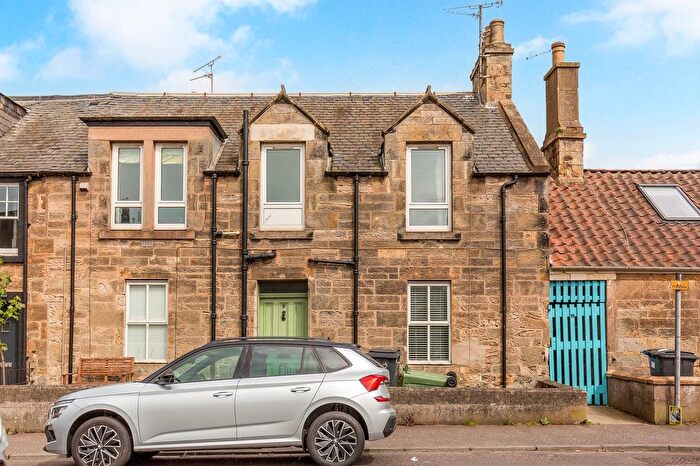
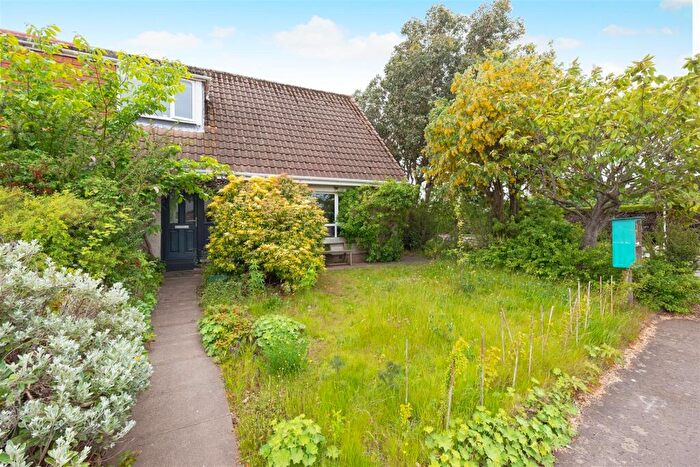
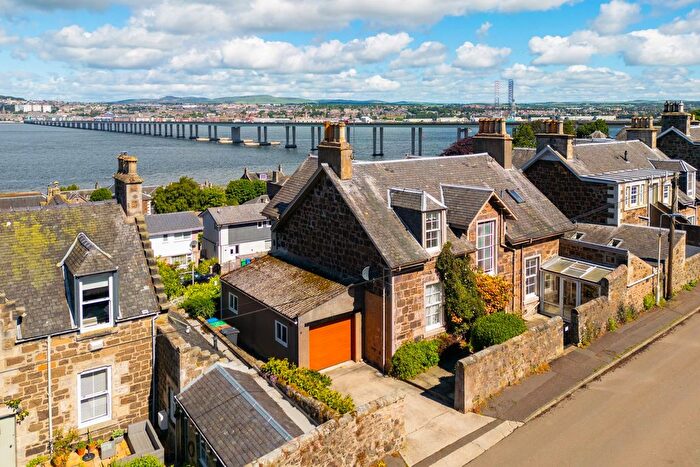
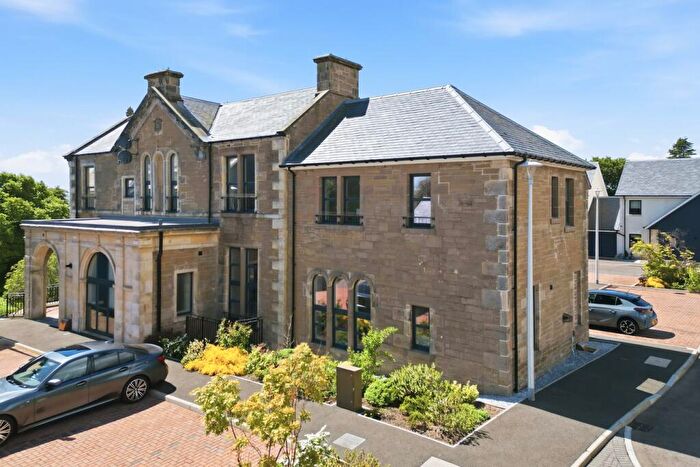
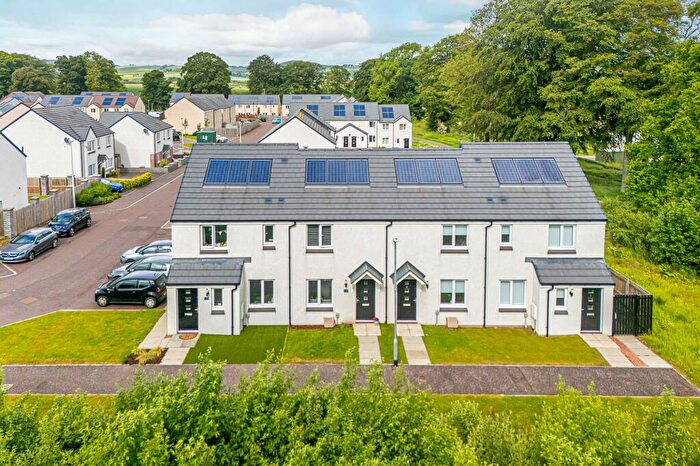
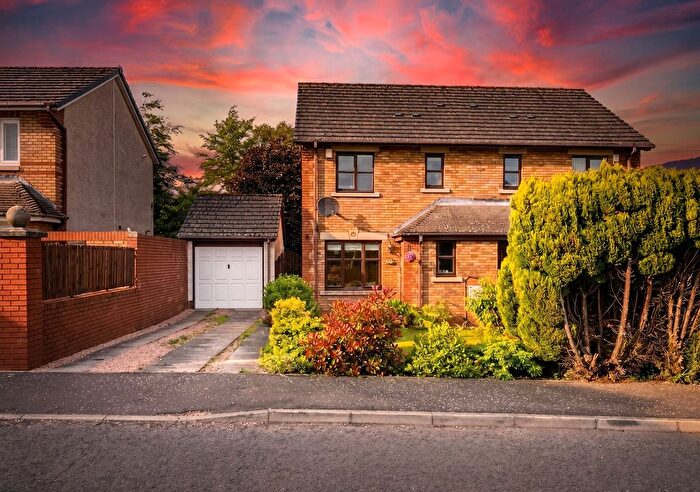
Properties for sale in St Andrews
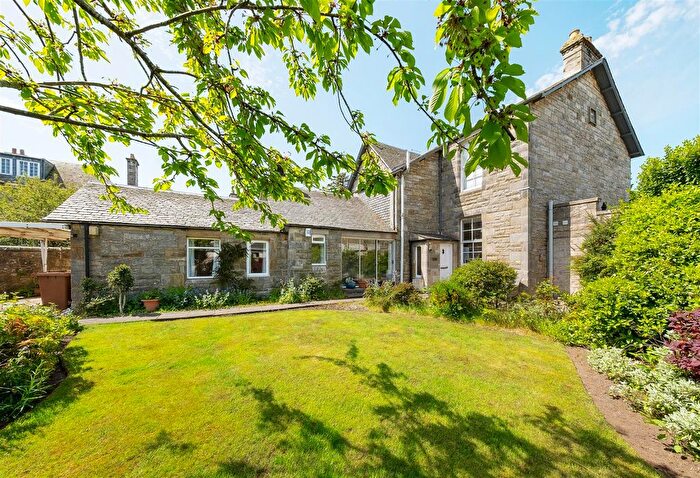
![]()
If you are looking to sell your house, let it out, or receive a property valuation, an expert can help you.
Click the button below to get started.
Neighbourhoods in St Andrews
Navigate through our locations to find the location of your next house in St Andrews, Fife for sale or to rent.
Transport in St Andrews
Please see below transportation links in this area:
-
 Leuchars Station
 -
Cupar Station
-
Broughty Ferry Station
-
Balmossie Station
-
Springfield Station
-
Monifieth Station
-
Dundee Station
- FAQ
- Price Paid By Year
Frequently asked questions about St Andrews
What is the average price for a property for sale in St Andrews?
The average price for a property for sale in St Andrews is £403,701. This amount is 120% higher than the average price in Fife. There are 2,608 property listings for sale in St Andrews.
What locations have the most expensive properties for sale in St Andrews?
The locations with the most expensive properties for sale in St Andrews are East Neuk and Landward at an average of £448,750 and St Andrews at an average of £440,706.
What locations have the most affordable properties for sale in St Andrews?
The locations with the most affordable properties for sale in St Andrews are Tay Bridgehead at an average of £268,441 and Cupar at an average of £270,000.
Which train stations are available in or near St Andrews?
Some of the train stations available in or near St Andrews are Leuchars, Cupar and Broughty Ferry.
Property Price Paid in St Andrews by Year
The average sold property price by year was:
| Year | Average Sold Price | Price Change |
Sold Properties
|
|---|---|---|---|
| 2025 | £353,972 | -19% |
137 Properties |
| 2024 | £420,964 | -2% |
138 Properties |
| 2023 | £427,781 | -4% |
184 Properties |
| 2022 | £445,690 | 14% |
363 Properties |
| 2021 | £385,204 | 6% |
443 Properties |
| 2020 | £362,883 | 9% |
289 Properties |
| 2019 | £328,811 | 5% |
327 Properties |
| 2018 | £313,573 | 6% |
387 Properties |
| 2017 | £294,849 | 0,2% |
383 Properties |
| 2016 | £294,333 | -8% |
408 Properties |
| 2015 | £317,743 | 6% |
443 Properties |
| 2014 | £299,918 | 14% |
340 Properties |
| 2013 | £256,435 | -3% |
324 Properties |
| 2012 | £263,718 | 3% |
283 Properties |
| 2011 | £256,027 | -0,4% |
260 Properties |
| 2010 | £257,173 | 16% |
255 Properties |
| 2009 | £215,658 | -36% |
324 Properties |
| 2008 | £293,019 | 11% |
313 Properties |
| 2007 | £260,283 | 9% |
402 Properties |
| 2006 | £236,775 | -17% |
443 Properties |
| 2005 | £276,999 | 36% |
522 Properties |
| 2004 | £177,276 | 15% |
496 Properties |
| 2003 | £151,516 | 17% |
536 Properties |
| 2002 | £125,248 | 26% |
549 Properties |
| 2001 | £92,283 | 57% |
40 Properties |
| 2000 | £40,000 | - |
1 Property |