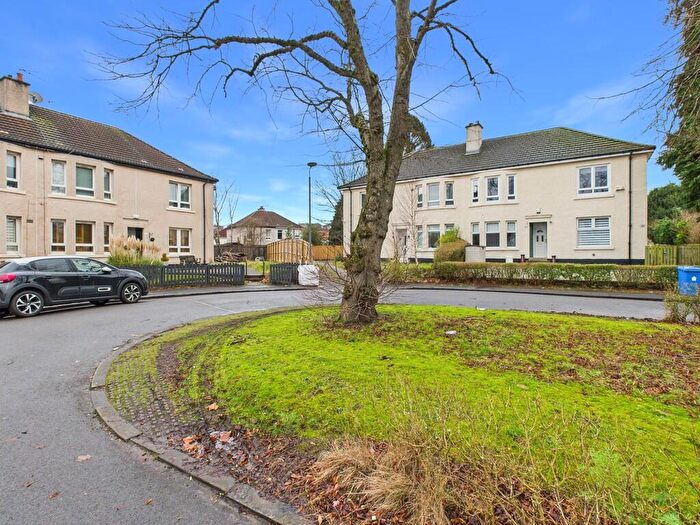
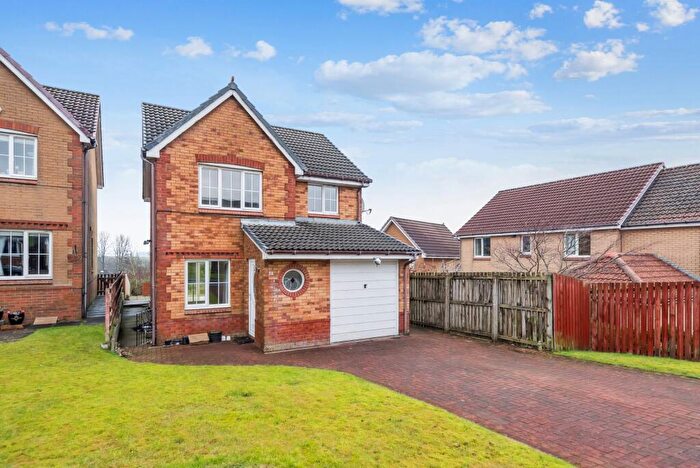
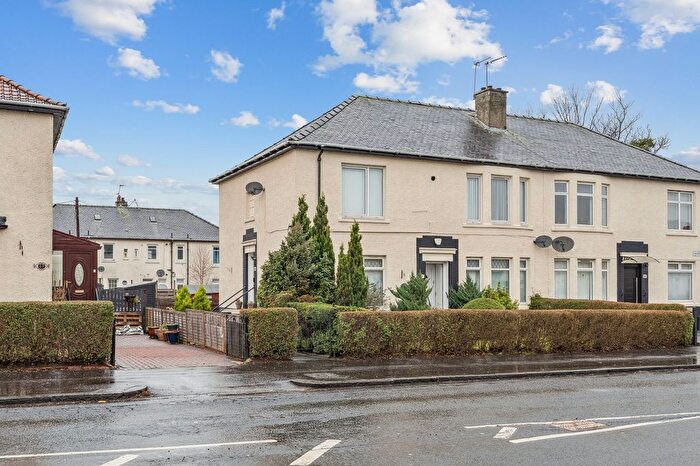
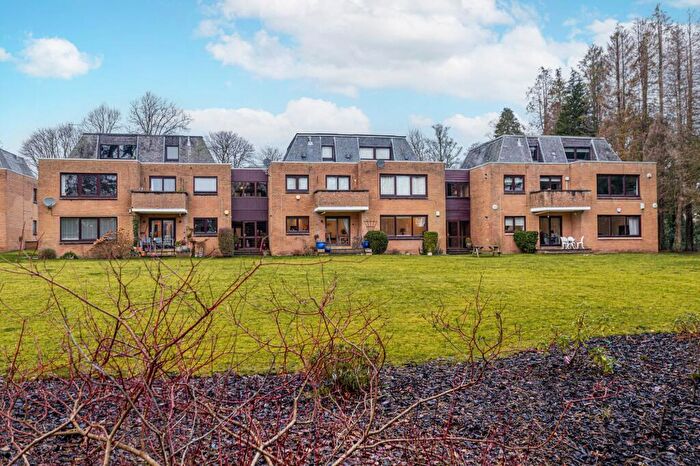
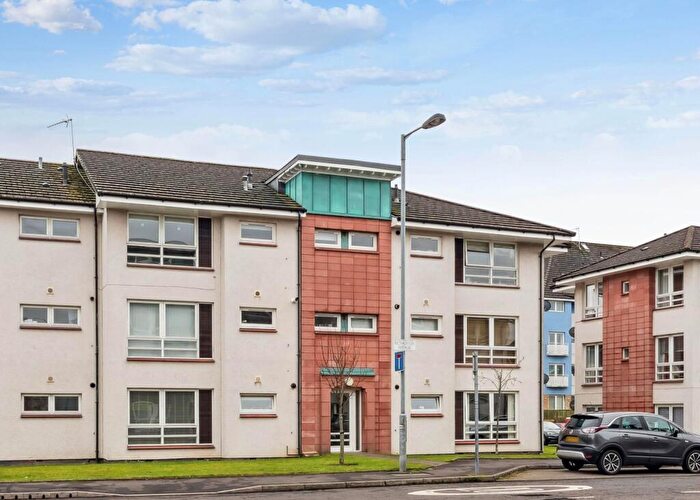
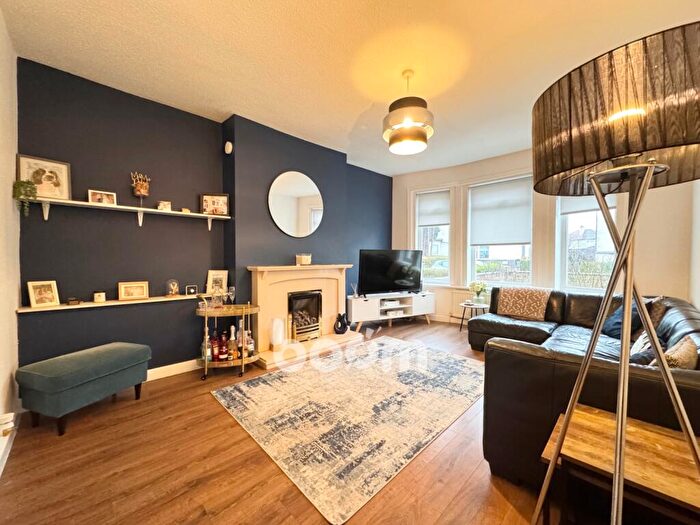
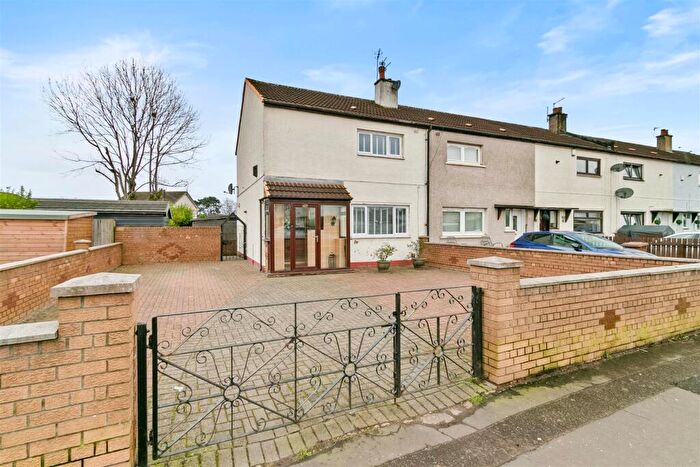
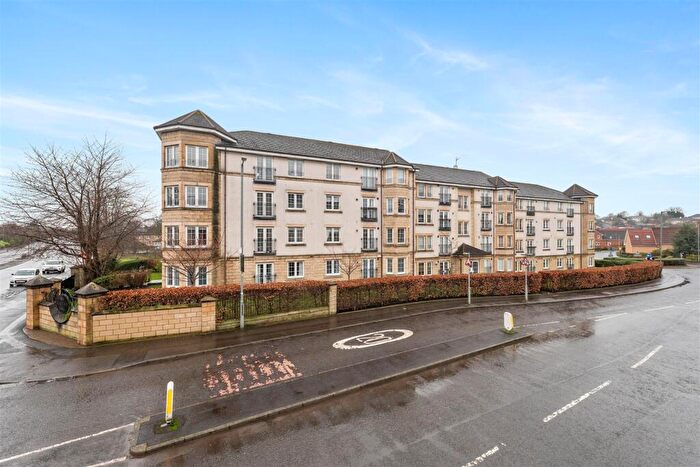
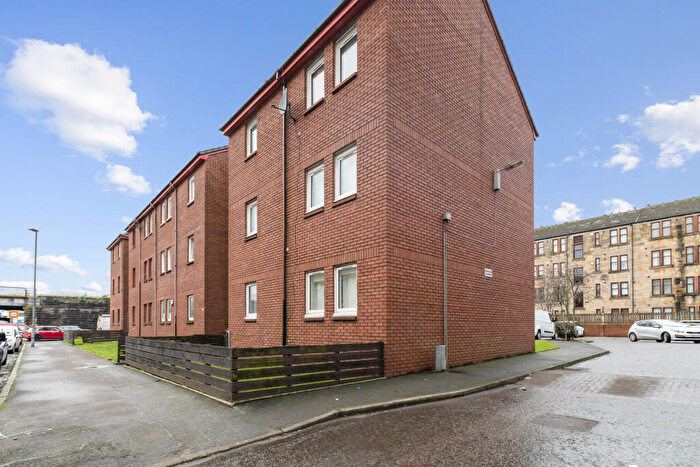
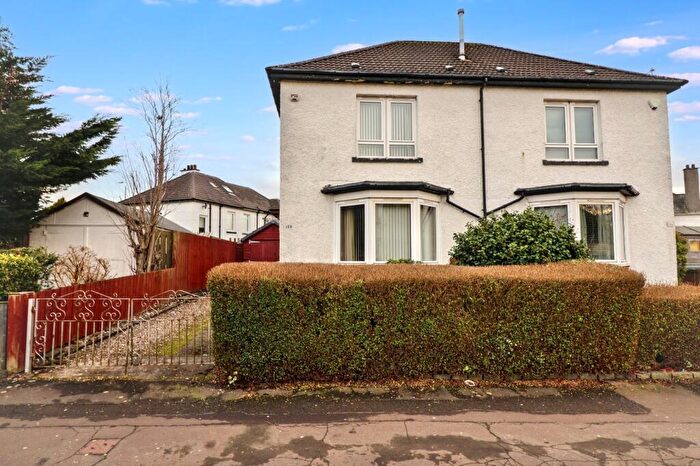
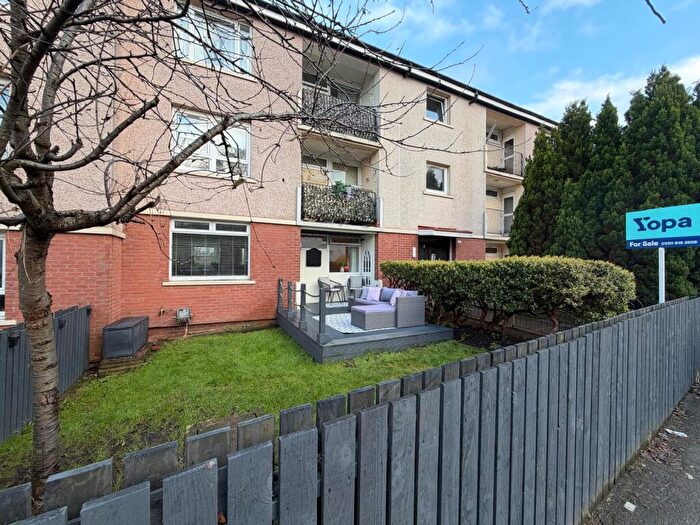
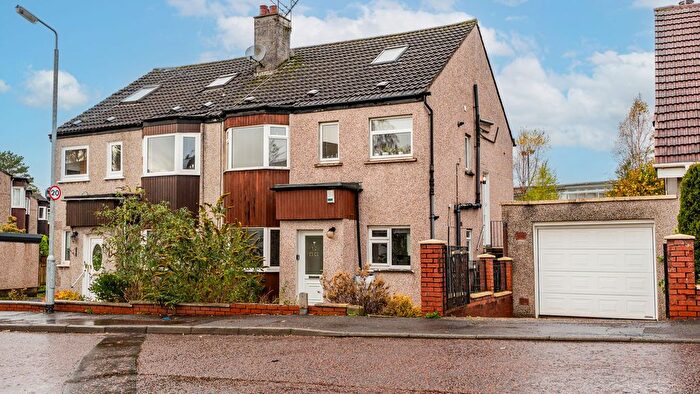
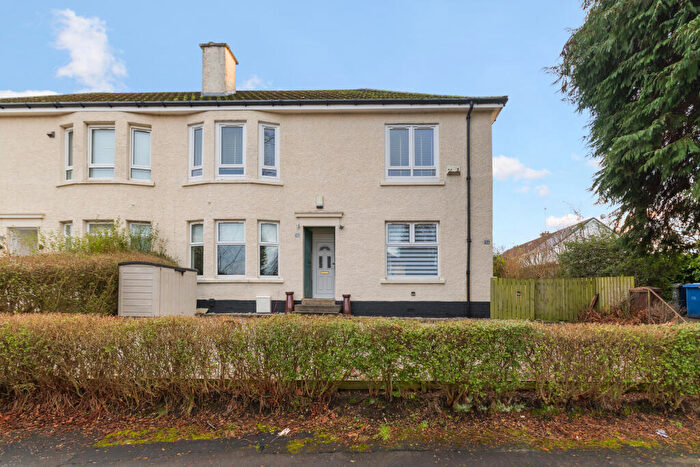
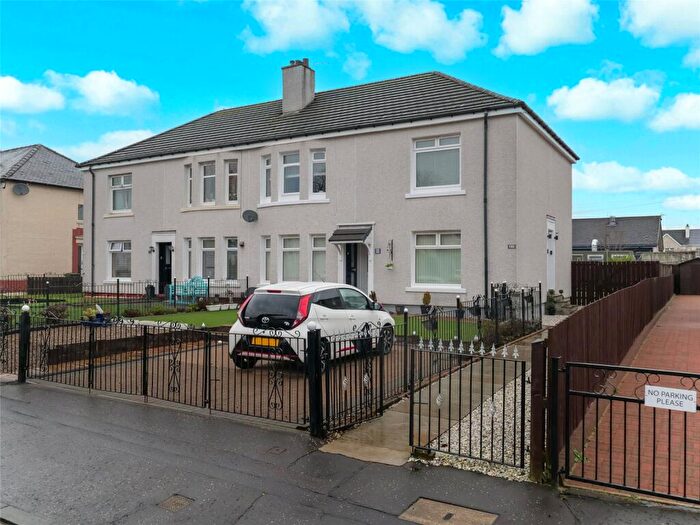
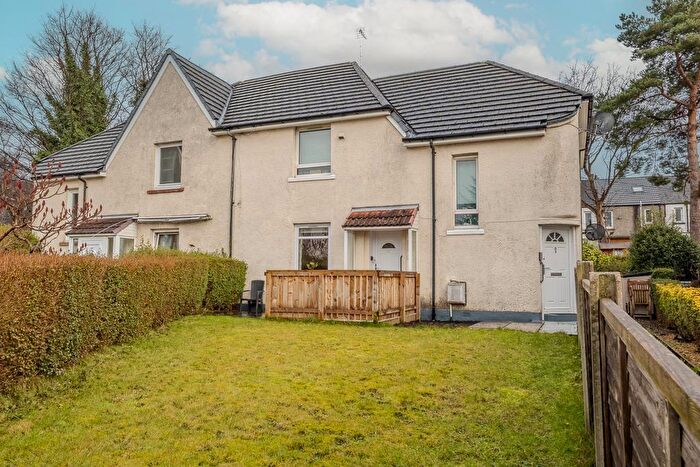
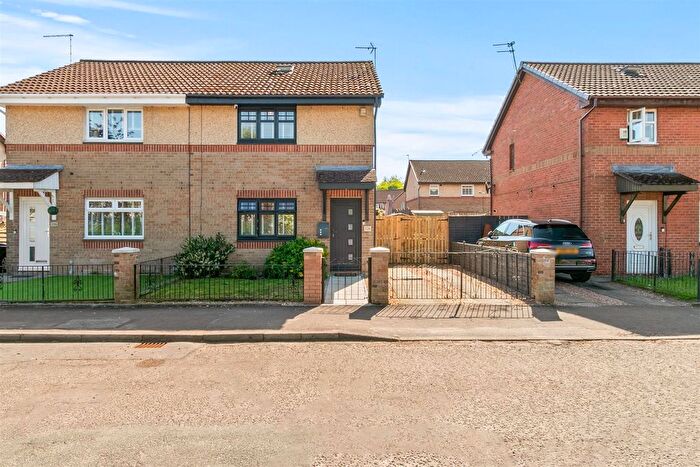
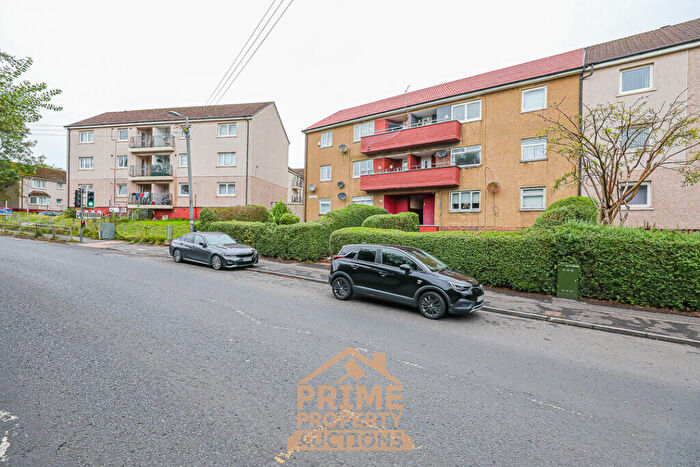
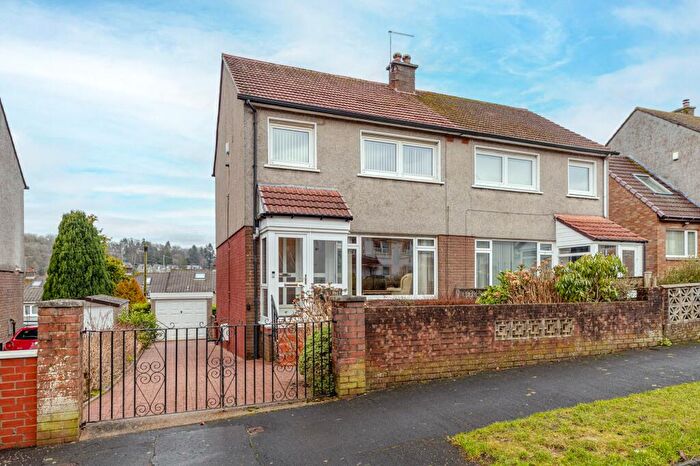
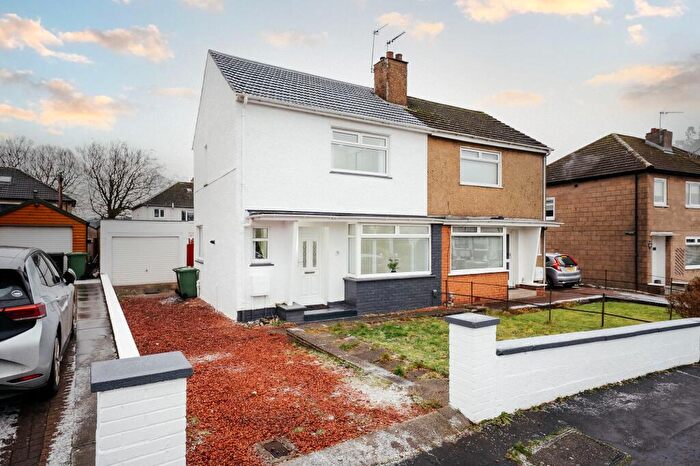
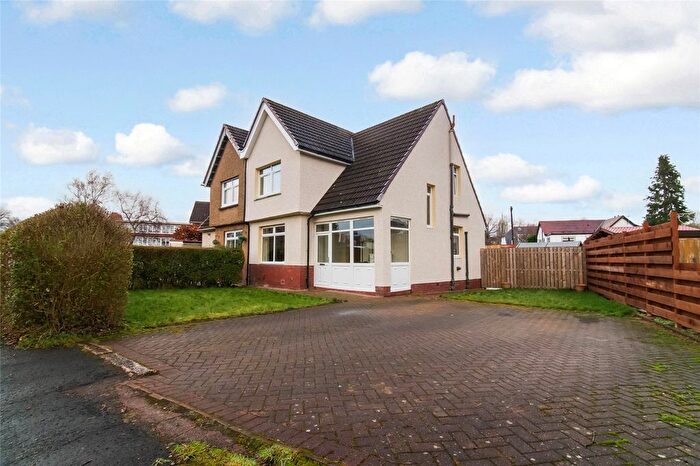
Houses for sale & to rent in Drumchapel/Anniesland, Glasgow
House Prices in Drumchapel/Anniesland
Properties in Drumchapel/Anniesland have an average house price of £152,003.00 and had 67 Property Transactions within the last 3 years¹.
Drumchapel/Anniesland is an area in Glasgow, Glasgow City with 13,550 households², where the most expensive property was sold for £403,100.00.
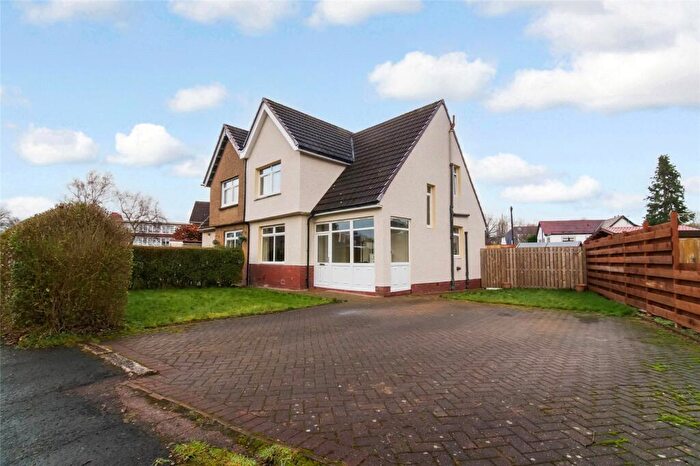
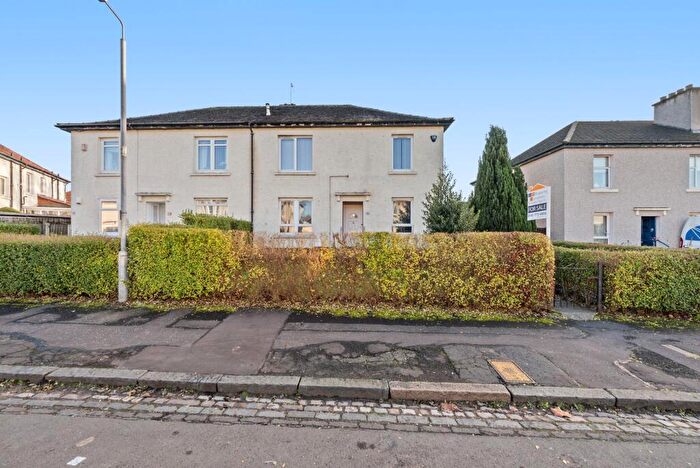
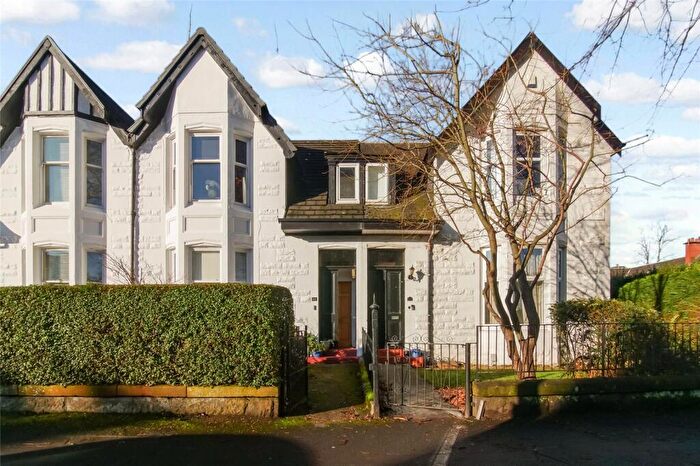
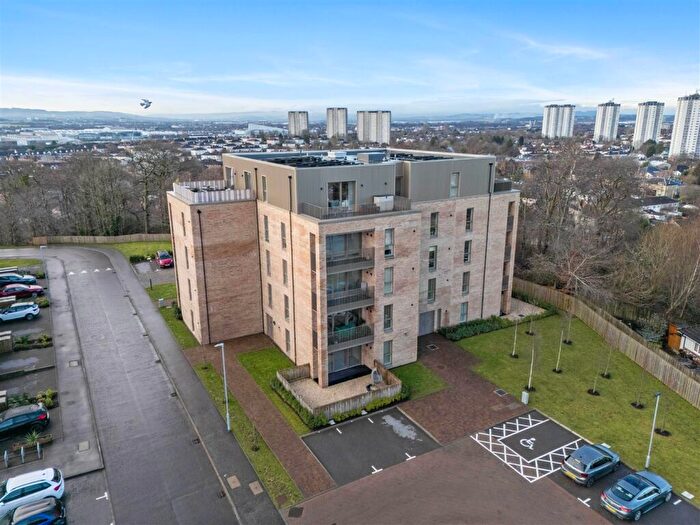
Properties for sale in Drumchapel/Anniesland
Roads and Postcodes in Drumchapel/Anniesland
Navigate through our locations to find the location of your next house in Drumchapel/Anniesland, Glasgow for sale or to rent.
Transport near Drumchapel/Anniesland
-
Drumchapel Station
-
Westerton Station
-
Bearsden Station
-
Garscadden Station
-
Scotstounhill Station
-
Drumry Station
-
Anniesland Station
-
Yoker Station
-
Hillfoot Station
-
Kelvindale Station
- FAQ
- Price Paid By Year
Frequently asked questions about Drumchapel/Anniesland
What is the average price for a property for sale in Drumchapel/Anniesland?
The average price for a property for sale in Drumchapel/Anniesland is £152,003. This amount is 18% lower than the average price in Glasgow. There are 3,241 property listings for sale in Drumchapel/Anniesland.
Which train stations are available in or near Drumchapel/Anniesland?
Some of the train stations available in or near Drumchapel/Anniesland are Drumchapel, Westerton and Bearsden.
Property Price Paid in Drumchapel/Anniesland by Year
The average sold property price by year was:
| Year | Average Sold Price | Price Change |
Sold Properties
|
|---|---|---|---|
| 2023 | £152,003 | -10% |
67 Properties |
| 2022 | £167,660 | 12% |
411 Properties |
| 2021 | £148,160 | 3% |
519 Properties |
| 2020 | £143,828 | 11% |
380 Properties |
| 2019 | £127,380 | -5% |
443 Properties |
| 2018 | £133,433 | 9% |
441 Properties |
| 2017 | £121,581 | 3% |
446 Properties |
| 2016 | £118,086 | 5% |
404 Properties |
| 2015 | £112,458 | 8% |
371 Properties |
| 2014 | £103,017 | -3% |
393 Properties |
| 2013 | £105,727 | -3% |
329 Properties |
| 2012 | £109,160 | -2% |
314 Properties |
| 2011 | £111,148 | -1% |
240 Properties |
| 2010 | £111,849 | 7% |
315 Properties |
| 2009 | £104,455 | -15% |
329 Properties |
| 2008 | £120,305 | -3% |
446 Properties |
| 2007 | £123,951 | 2% |
538 Properties |
| 2006 | £121,301 | 13% |
600 Properties |
| 2005 | £105,901 | 6% |
645 Properties |
| 2004 | £99,972 | 30% |
615 Properties |
| 2003 | £70,445 | 14% |
623 Properties |
| 2002 | £60,672 | -39% |
672 Properties |
| 2001 | £84,437 | - |
46 Properties |

