
Houses for sale in Glasgow City, Scotland
House Prices in Glasgow City
Properties in Glasgow City have
an average house price of
£216k
and had 9,343 Property Transactions
within the last 3 years.¹
Glasgow City is a location in
Scotland with
280,766 households², where the most expensive property was sold for £3.25M.
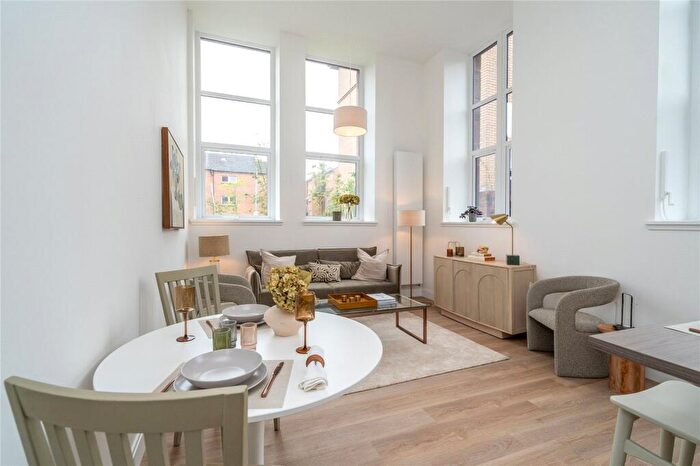
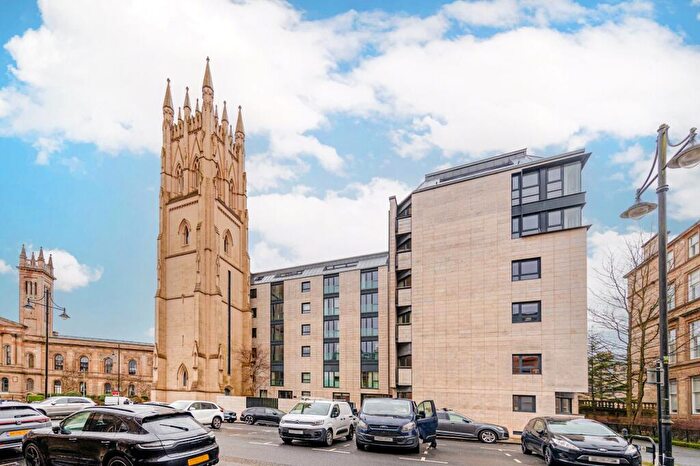
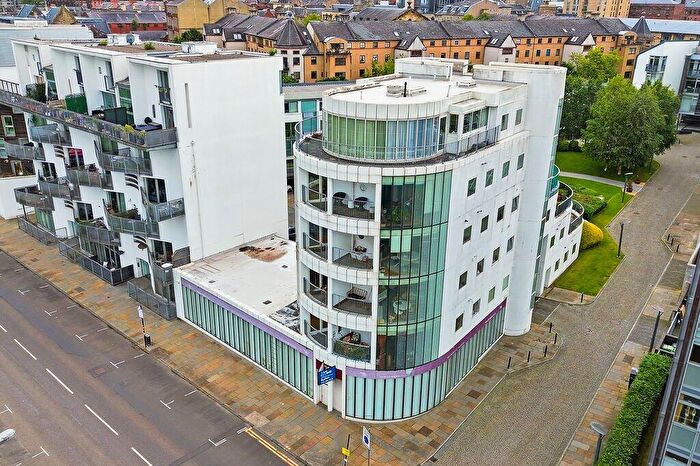
Properties for sale in Glasgow City

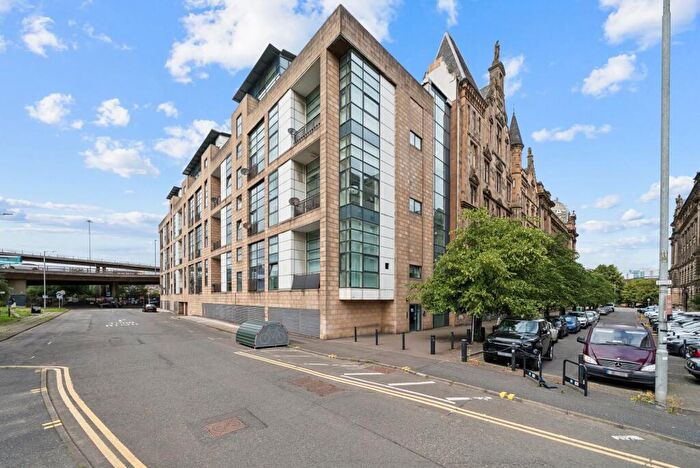
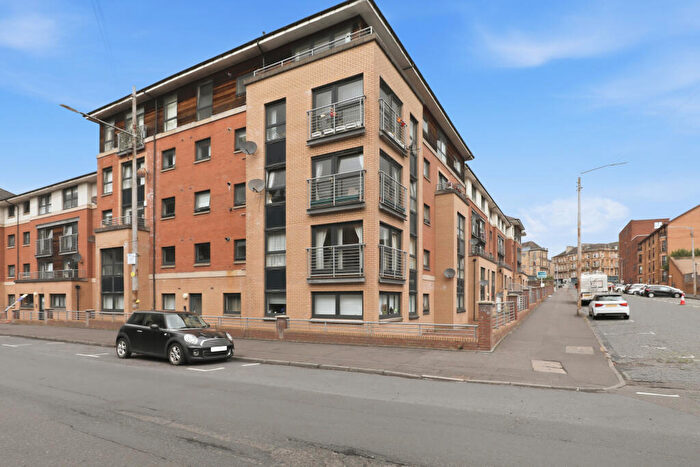
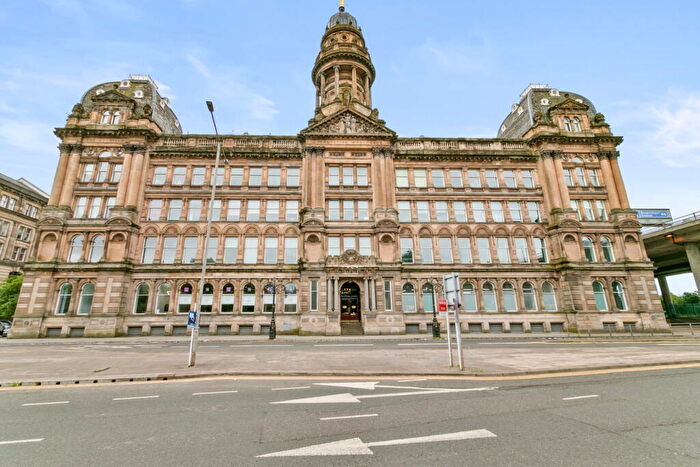
![]()
If you are looking to sell your house, let it out, or receive a property valuation, an expert can help you.
Click the button below to get started.
Towns in Glasgow City
Navigate through our locations to find the location of your next house in Glasgow City, Scotland for sale or to rent.
Property price trends in Glasgow City
According to the latest Registers of Scotland data, the average home in Glasgow City sold for £235,910 in 2026. That figure comes from a substantial record of 264,221 sales logged over the past 29 years.
Prices have continued to climb over the last three years. Compared with 2023, when the typical sale came in around £199,147, that's a rise of roughly 18.5%.
Looking back five years, average prices are up about 26.5% since 2021, a gain of around £49,413 in cash terms.
Zoom out to the past decade for the fuller picture. Back in 2016, homes here averaged £142,599, so the typical sold price has climbed about 65.4% since then, roughly 5.2% a year. Stretch the view to fifteen years and that annual pace eases back to about 3.7%.
Frequently asked questions about Glasgow City
What is the average price for a property for sale in Glasgow City?
The average price for a property for sale in Glasgow City is £215,708. This amount is 7% higher than the average price in Scotland. There are more than 10,000 property listings for sale in Glasgow City.
Which train stations are available in or near Glasgow City?
Some of the train stations available in or near Glasgow City are Anderston, Glasgow Central and Charing Cross (Glasgow).
Property Price Paid in Glasgow City by Year
The average sold property price by year was:
| Year | Average Sold Price | Price Change |
Sold Properties
|
|---|---|---|---|
| 2026 | £235,910 | -0,3% |
535 Properties |
| 2025 | £236,657 | 8% |
2,461 Properties |
| 2024 | £216,616 | 8% |
2,447 Properties |
| 2023 | £199,147 | 1% |
3,900 Properties |
| 2022 | £197,109 | 5% |
11,175 Properties |
| 2021 | £186,497 | 7% |
13,265 Properties |
| 2020 | £173,880 | 7% |
9,380 Properties |
| 2019 | £161,248 | 0,3% |
11,714 Properties |
| 2018 | £160,825 | 6% |
11,556 Properties |
| 2017 | £151,881 | 6% |
11,997 Properties |
Transport in Glasgow City
Please see below transportation links in this area:
