
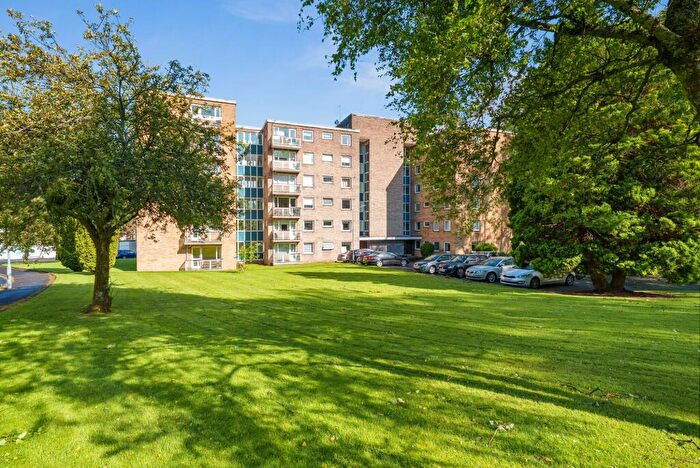
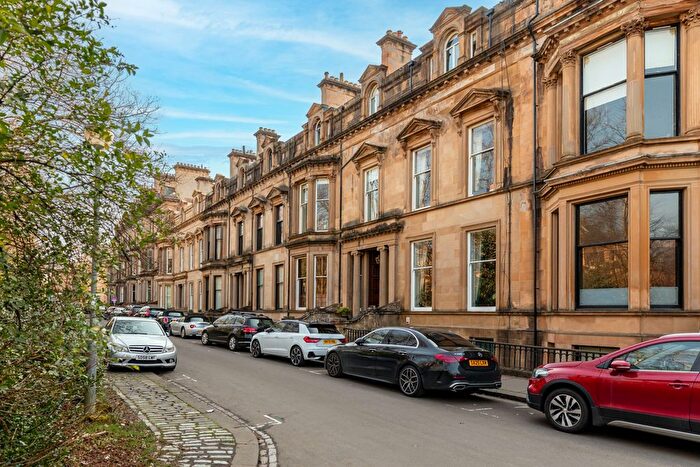
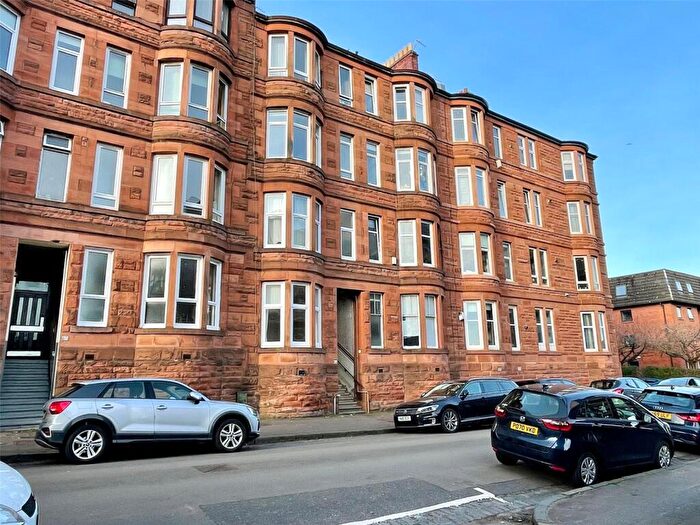
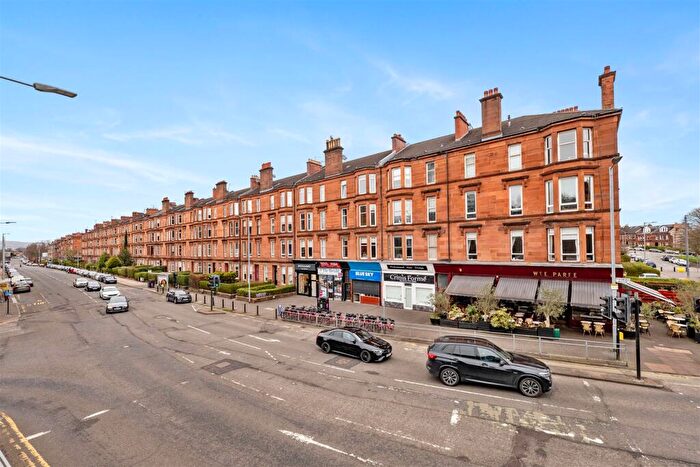
Houses for sale & to rent in Victoria Park, Glasgow
House Prices in Victoria Park
Properties in Victoria Park have an average house price of £343k and had 334 Property Transactions within the last 3 years¹.
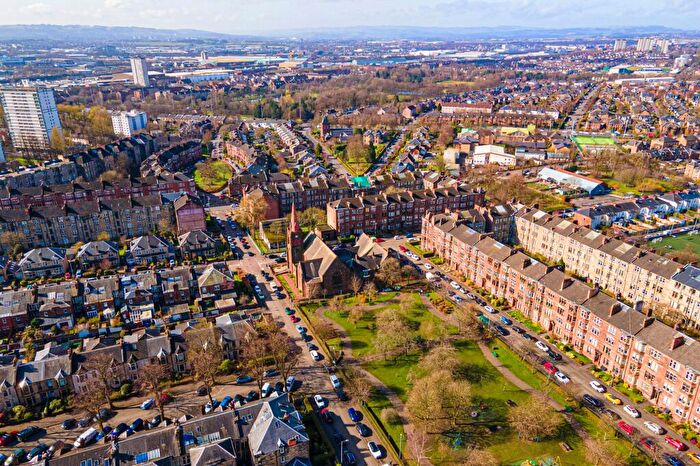
Victoria Park is an area in Glasgow, Glasgow City with 11,402 households², where the most expensive property was sold for £1.13M.
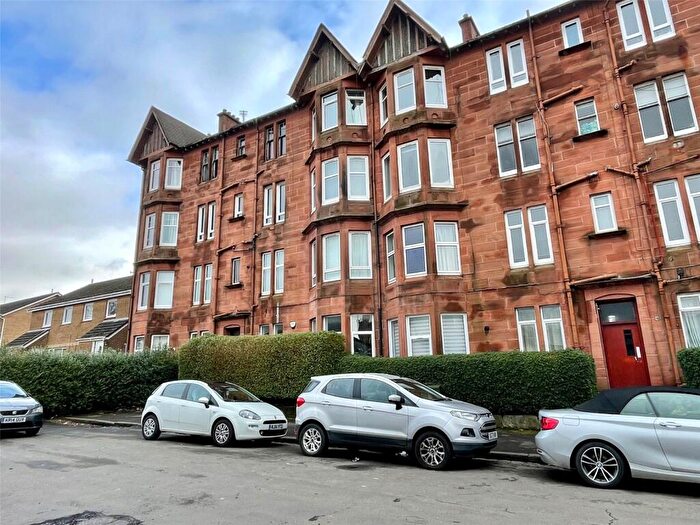
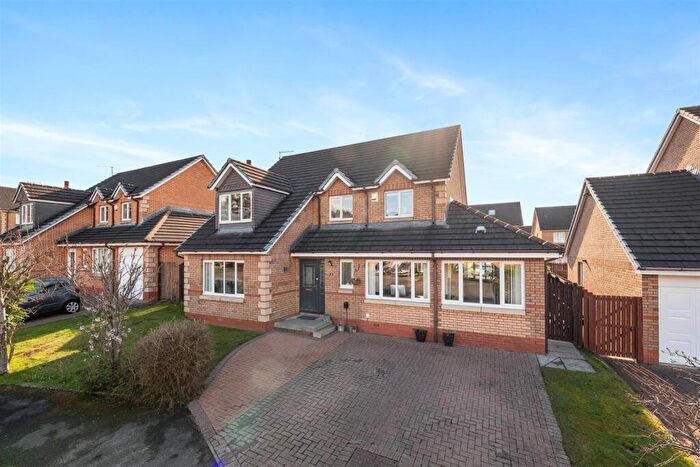
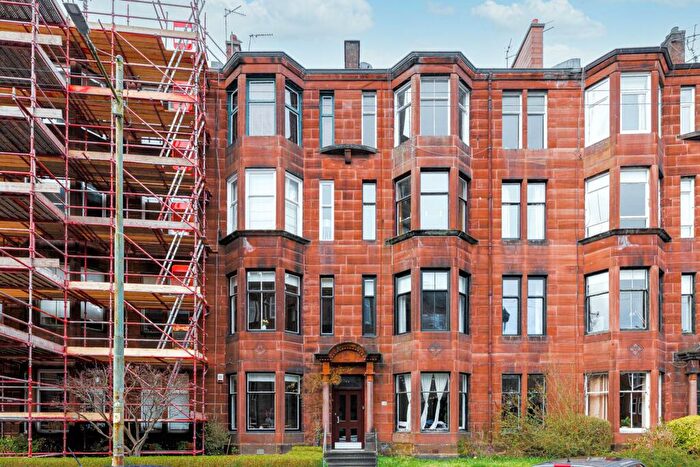
Properties for sale in Victoria Park
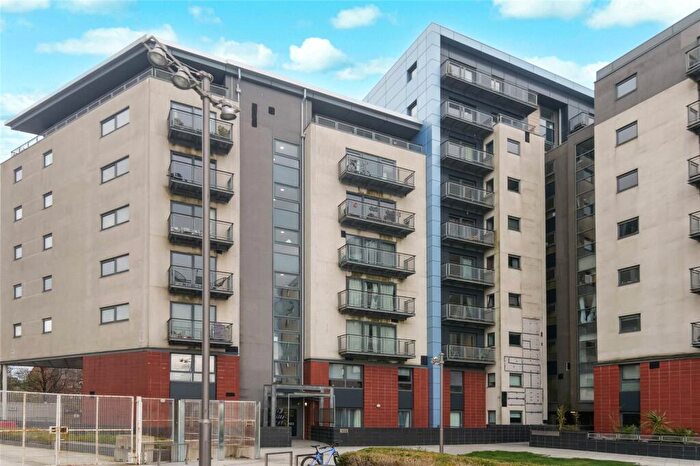
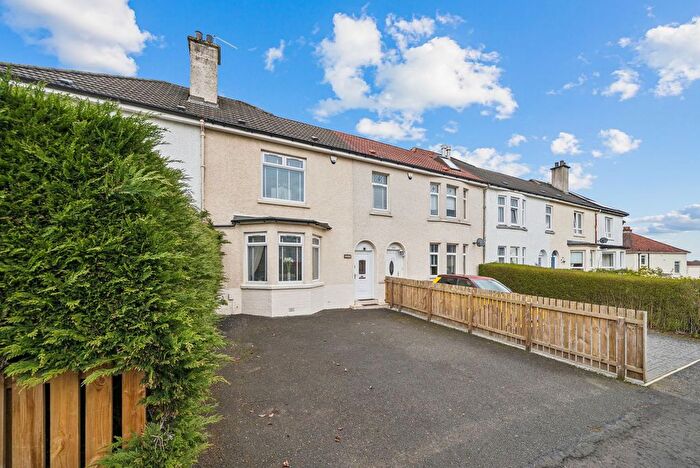
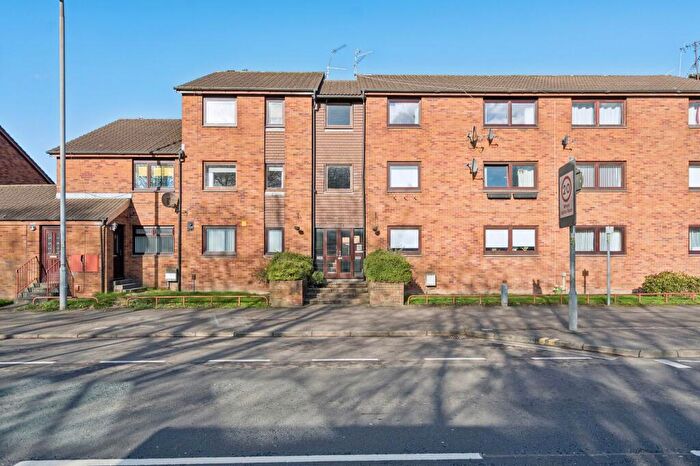
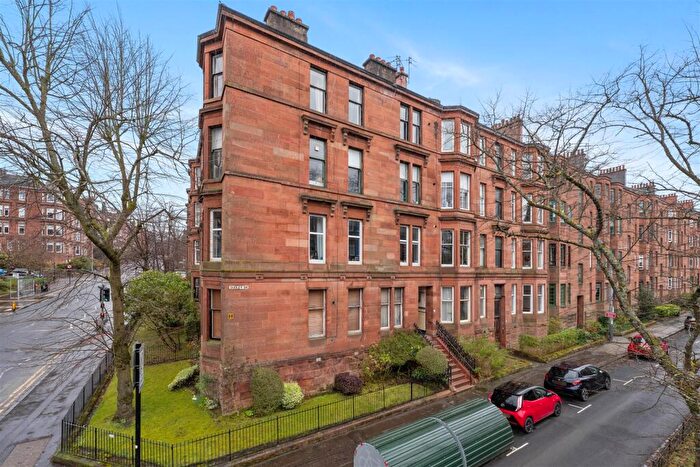
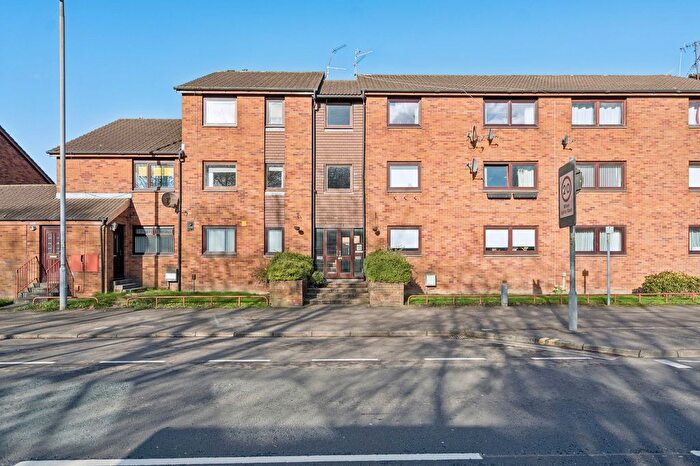
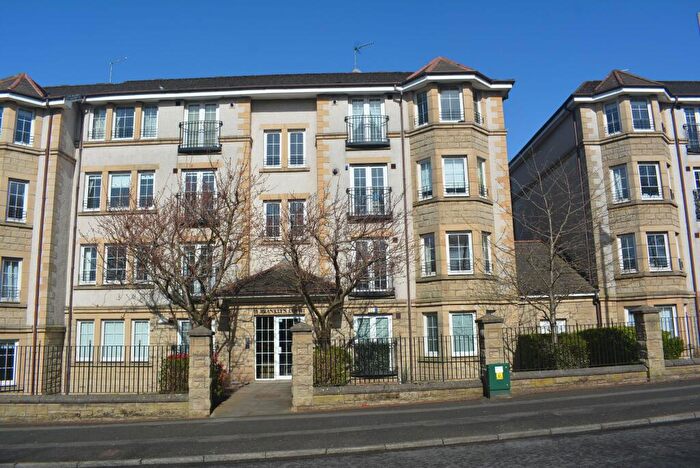
![]()
If you are looking to sell your house, let it out, or receive a property valuation, an expert can help you.
Click the button below to get started.


Roads and Postcodes in Victoria Park
Navigate through our locations to find the location of your next house in Victoria Park, Glasgow for sale or to rent.
Transport near Victoria Park
-
 Jordanhill Station
 -
Hyndland Station
-
Partick Station
-
Anniesland Station
-
Scotstounhill Station
-
Kelvindale Station
-
Garscadden Station
-
Maryhill Station
-
Cardonald Station
-
Hillington East Station
- FAQ
- Price Paid By Year
Frequently asked questions about Victoria Park
What is the average price for a property for sale in Victoria Park?
The average price for a property for sale in Victoria Park is £343,000. This amount is 60% higher than the average price in Glasgow. There are 5,589 property listings for sale in Victoria Park.
What streets have the most expensive properties for sale in Victoria Park?
The streets with the most expensive properties for sale in Victoria Park are Varna Road at an average of £973,000, Jordanhill Crescent at an average of £835,000 and Helensburgh Drive at an average of £777,314.
What streets have the most affordable properties for sale in Victoria Park?
The streets with the most affordable properties for sale in Victoria Park are Cluny Gardens at an average of £109,680, Angle Gate at an average of £132,500 and Thornwood Avenue at an average of £140,666.
Which train stations are available in or near Victoria Park?
Some of the train stations available in or near Victoria Park are Jordanhill, Hyndland and Partick.
Property Price Paid in Victoria Park by Year
The average sold property price by year was:
| Year | Average Sold Price | Price Change |
Sold Properties
|
|---|---|---|---|
| 2025 | £452,059 | 21% |
89 Properties |
| 2024 | £357,396 | 22% |
80 Properties |
| 2023 | £277,194 | 13% |
165 Properties |
| 2022 | £240,632 | 12% |
542 Properties |
| 2021 | £211,670 | -7% |
611 Properties |
| 2020 | £226,208 | 5% |
404 Properties |
| 2019 | £215,564 | 2% |
549 Properties |
| 2018 | £211,769 | 5% |
552 Properties |
| 2017 | £200,653 | 12% |
644 Properties |
| 2016 | £177,333 | -3% |
572 Properties |
| 2015 | £183,340 | 1% |
572 Properties |
| 2014 | £181,200 | 5% |
504 Properties |
| 2013 | £172,209 | -4% |
456 Properties |
| 2012 | £178,658 | 5% |
388 Properties |
| 2011 | £169,948 | -7% |
379 Properties |
| 2010 | £182,260 | 9% |
382 Properties |
| 2009 | £165,656 | -9% |
428 Properties |
| 2008 | £180,661 | -17% |
551 Properties |
| 2007 | £211,408 | 11% |
905 Properties |
| 2006 | £187,400 | 5% |
819 Properties |
| 2005 | £178,478 | 20% |
915 Properties |
| 2004 | £142,344 | 7% |
690 Properties |
| 2003 | £132,817 | 23% |
638 Properties |
| 2002 | £102,539 | 2% |
696 Properties |
| 2001 | £100,791 | - |
79 Properties |