
Houses for sale & to rent in East Centre, Glasgow
House Prices in East Centre
Properties in East Centre have an average house price of £135k and had 458 Property Transactions within the last 3 years¹.
East Centre is an area in Glasgow, Glasgow City with 12,269 households², where the most expensive property was sold for £310k.
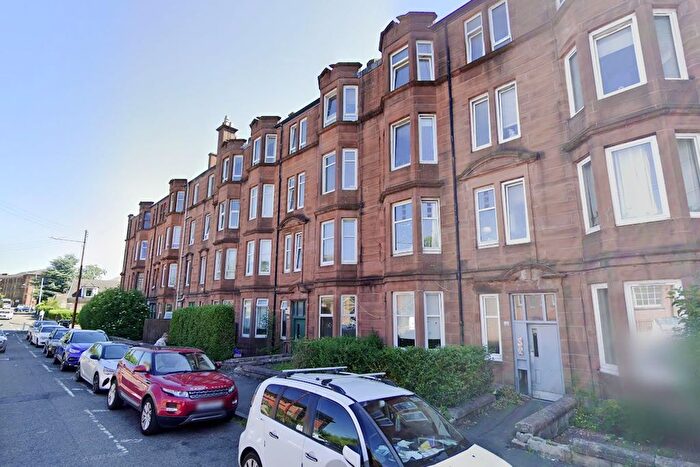
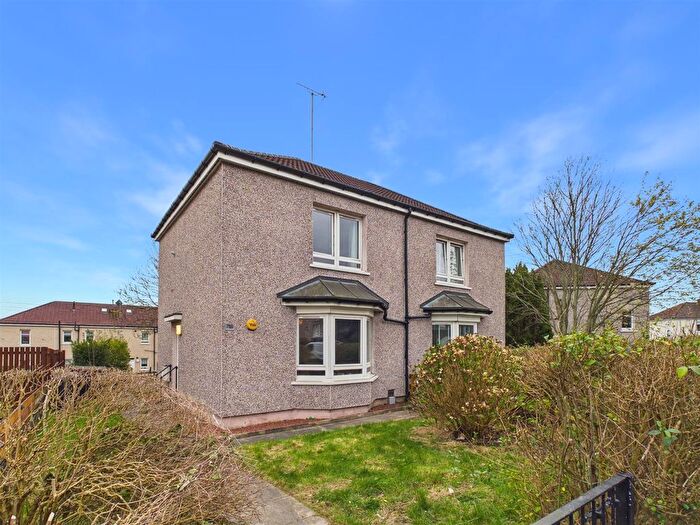
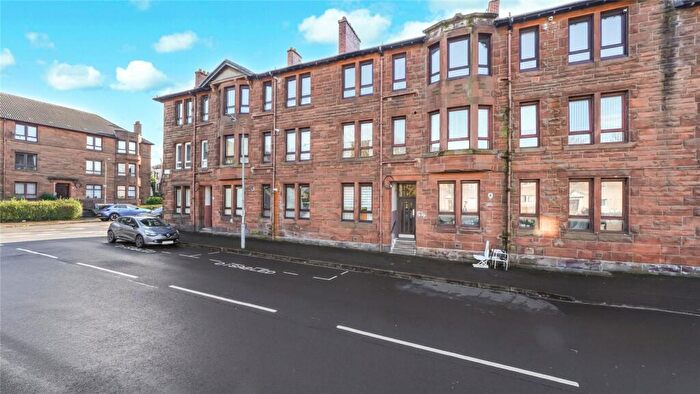
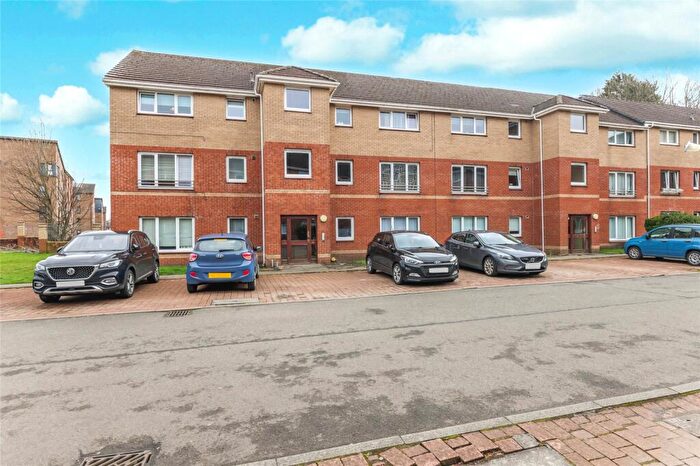
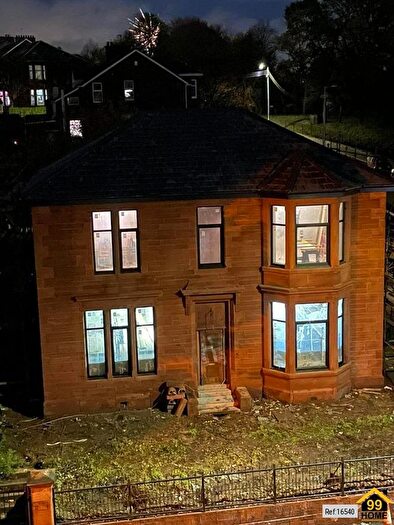
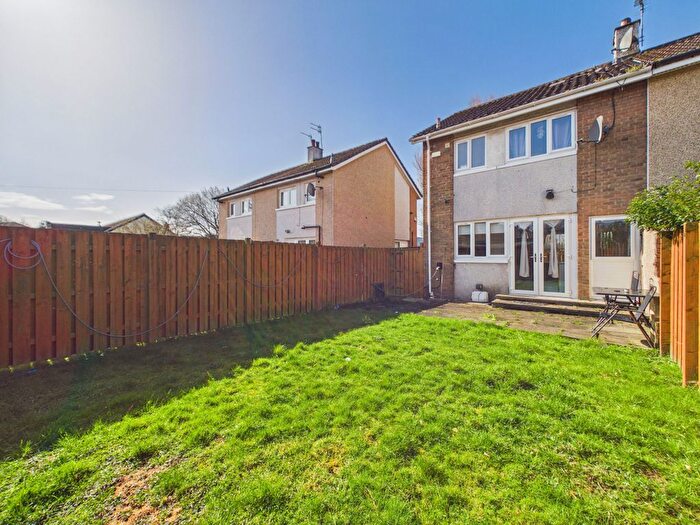
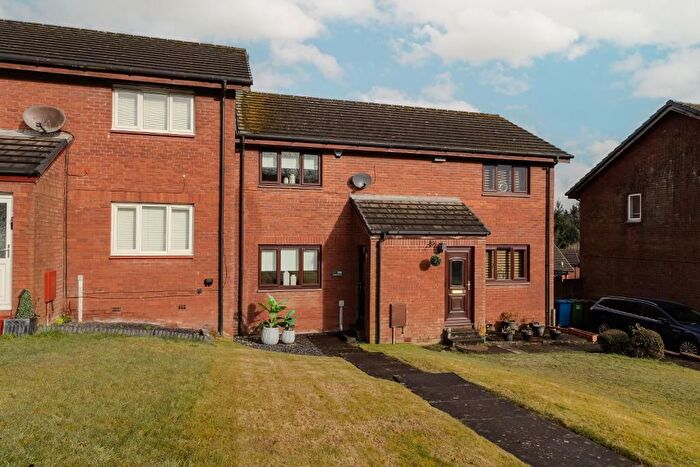
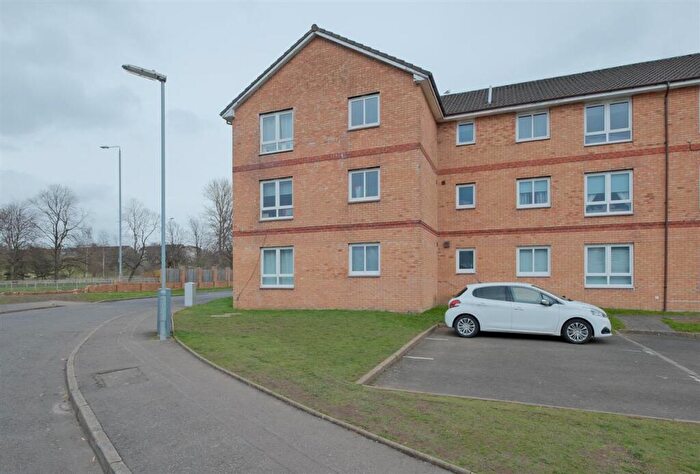
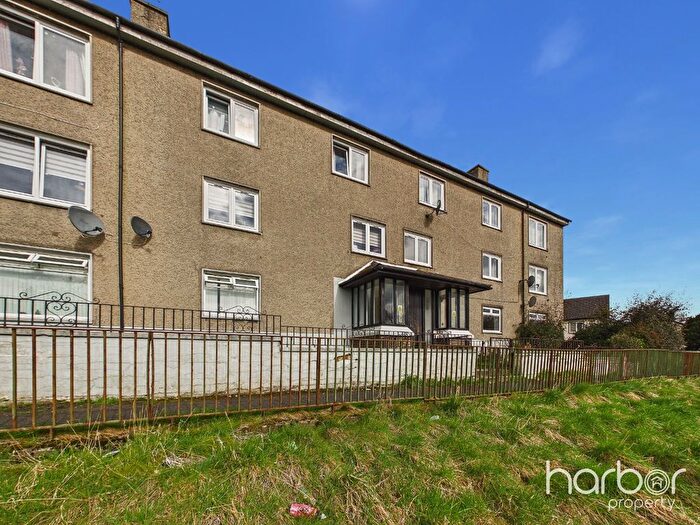
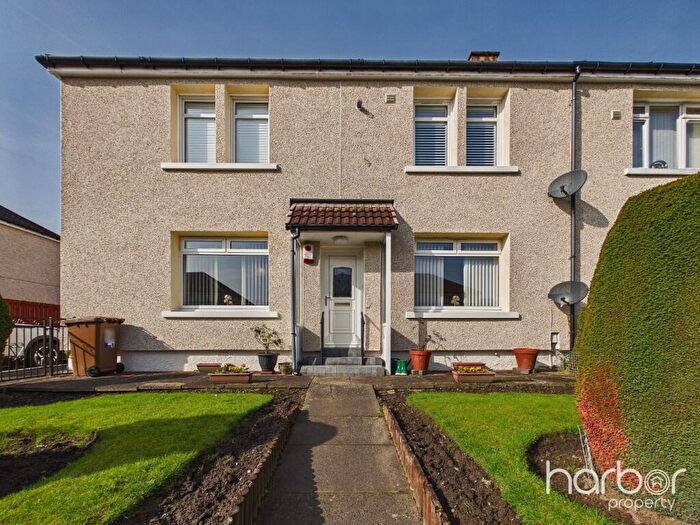
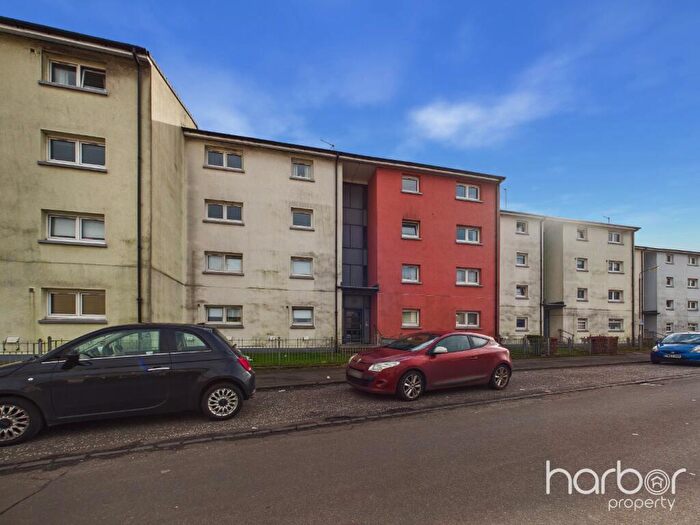
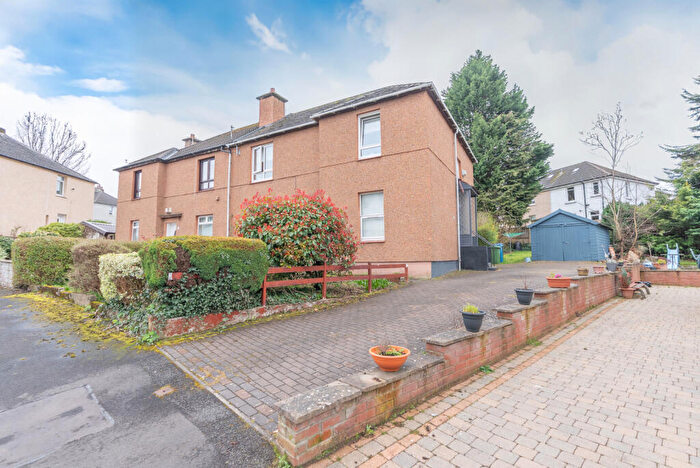
Properties for sale in East Centre
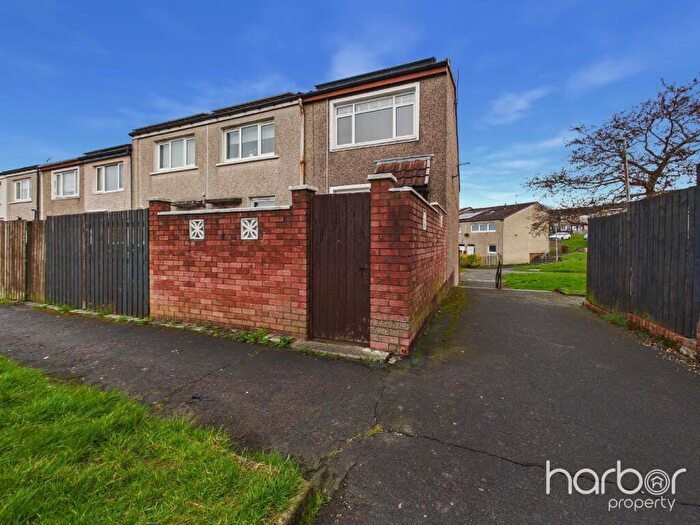

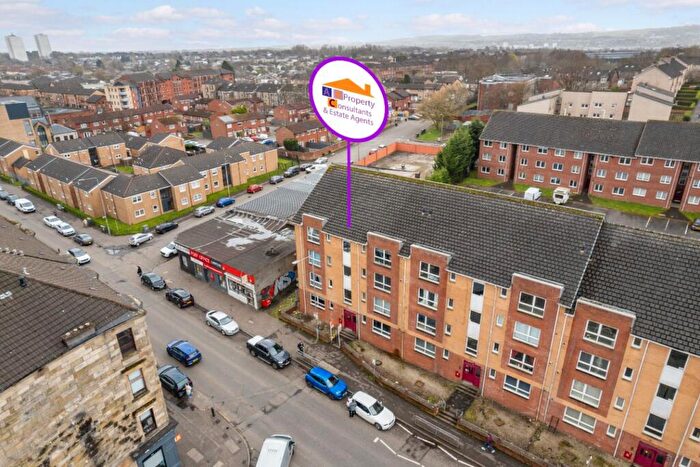

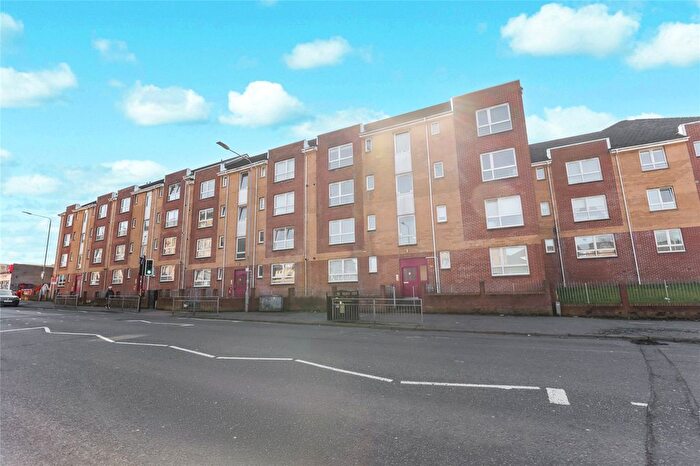
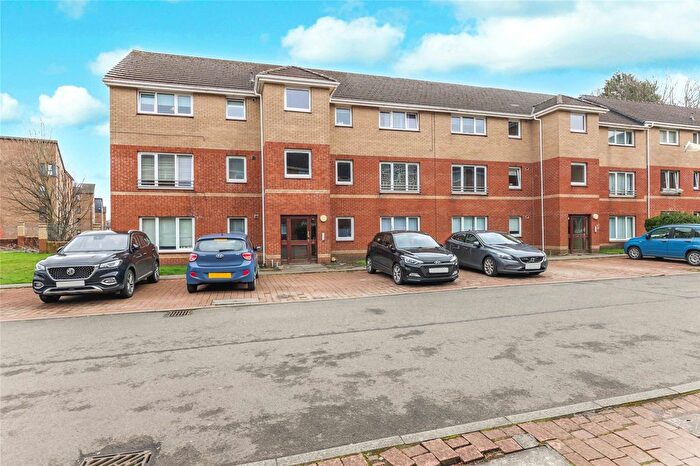
![]()
If you are looking to sell your house, let it out, or receive a property valuation, an expert can help you.
Click the button below to get started.


Roads and Postcodes in East Centre
Navigate through our locations to find the location of your next house in East Centre, Glasgow for sale or to rent.
Transport near East Centre
-
 Carntyne Station
 -
Shettleston Station
-
Alexandra Parade Station
-
Duke Street Station
-
Garrowhill Station
-
Carmyle Station
-
Bellgrove Station
-
Mt. Vernon Station
-
Dalmarnock Station
-
Barnhill Station
- FAQ
- Price Paid By Year
Frequently asked questions about East Centre
What is the average price for a property for sale in East Centre?
The average price for a property for sale in East Centre is £134,999. This amount is 37% lower than the average price in Glasgow. There are 2,603 property listings for sale in East Centre.
What streets have the most expensive properties for sale in East Centre?
The streets with the most expensive properties for sale in East Centre are Penicuik Drive at an average of £277,500, Gartocher Road at an average of £265,000 and Crowhall Drive at an average of £252,500.
What streets have the most affordable properties for sale in East Centre?
The streets with the most affordable properties for sale in East Centre are Arniston Street at an average of £39,650, Longstone Road at an average of £57,750 and Whitburn Street at an average of £77,500.
Which train stations are available in or near East Centre?
Some of the train stations available in or near East Centre are Carntyne, Shettleston and Alexandra Parade.
Property Price Paid in East Centre by Year
The average sold property price by year was:
| Year | Average Sold Price | Price Change |
Sold Properties
|
|---|---|---|---|
| 2025 | £143,331 | 2% |
134 Properties |
| 2024 | £141,094 | 12% |
144 Properties |
| 2023 | £123,919 | 3% |
180 Properties |
| 2022 | £119,861 | 3% |
342 Properties |
| 2021 | £116,388 | 2% |
364 Properties |
| 2020 | £113,575 | 3% |
291 Properties |
| 2019 | £110,474 | 3% |
429 Properties |
| 2018 | £107,215 | 12% |
411 Properties |
| 2017 | £94,351 | 2% |
382 Properties |
| 2016 | £92,457 | -1% |
384 Properties |
| 2015 | £92,949 | 10% |
343 Properties |
| 2014 | £83,838 | 7% |
349 Properties |
| 2013 | £78,090 | 6% |
266 Properties |
| 2012 | £73,168 | -6% |
213 Properties |
| 2011 | £77,372 | -10% |
241 Properties |
| 2010 | £84,930 | -3% |
257 Properties |
| 2009 | £87,064 | -1% |
242 Properties |
| 2008 | £88,109 | 2% |
431 Properties |
| 2007 | £86,385 | -1% |
437 Properties |
| 2006 | £87,269 | 24% |
477 Properties |
| 2005 | £66,204 | 20% |
456 Properties |
| 2004 | £53,063 | 13% |
393 Properties |
| 2003 | £46,377 | 31% |
485 Properties |
| 2002 | £32,077 | -12% |
510 Properties |
| 2001 | £36,066 | - |
42 Properties |