
Houses for sale & to rent in Dennistoun, Glasgow
House Prices in Dennistoun
Properties in Dennistoun have an average house price of £177k and had 152 Property Transactions within the last 3 years¹.
Dennistoun is an area in Glasgow, Glasgow City with 11,000 households², where the most expensive property was sold for £660k.
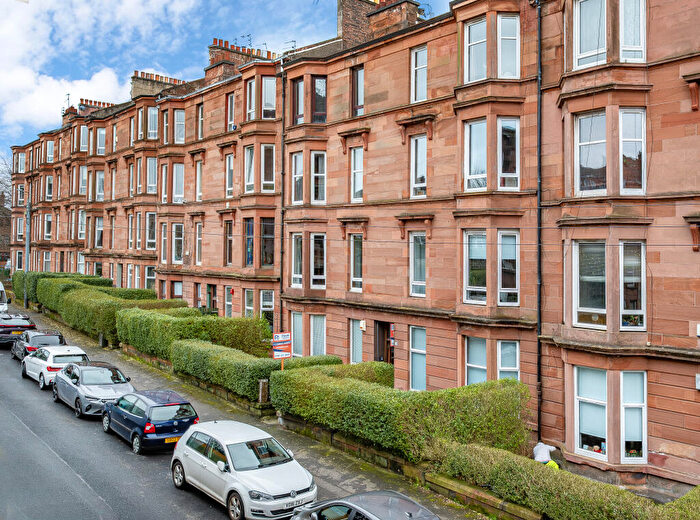
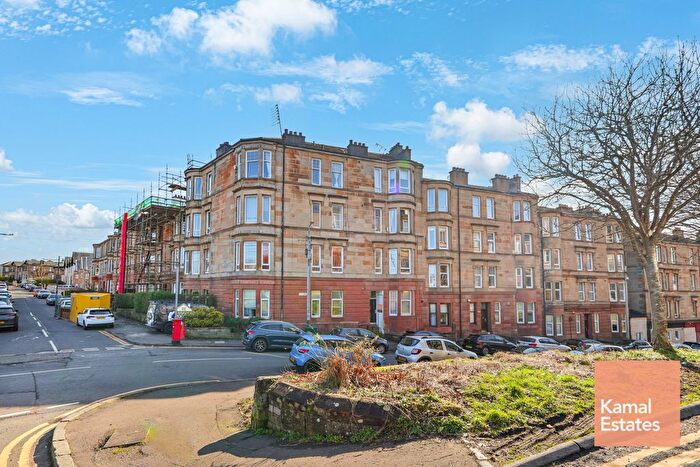
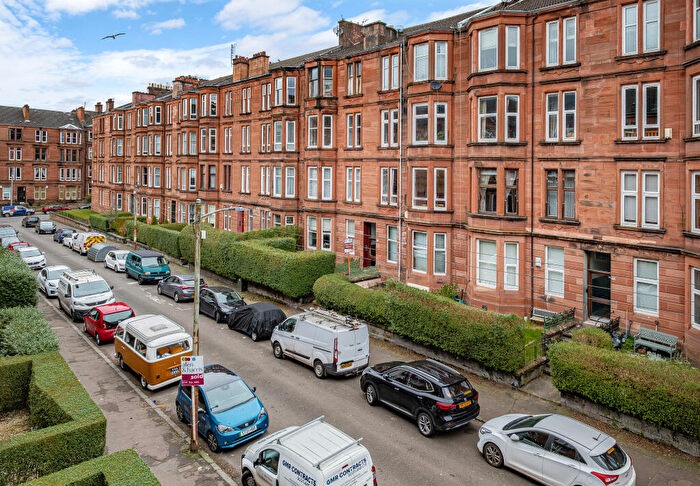
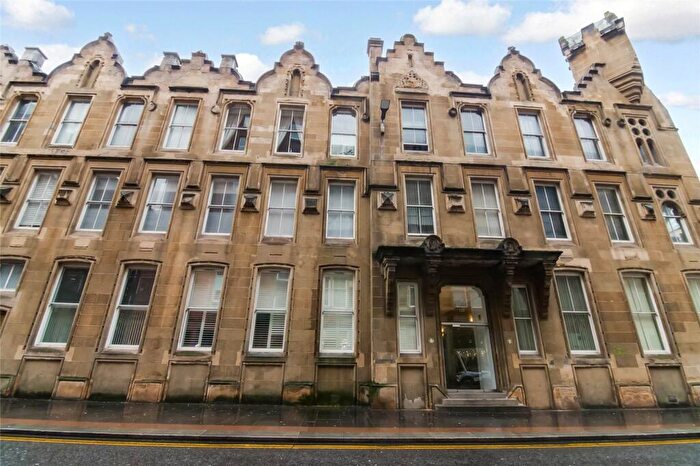
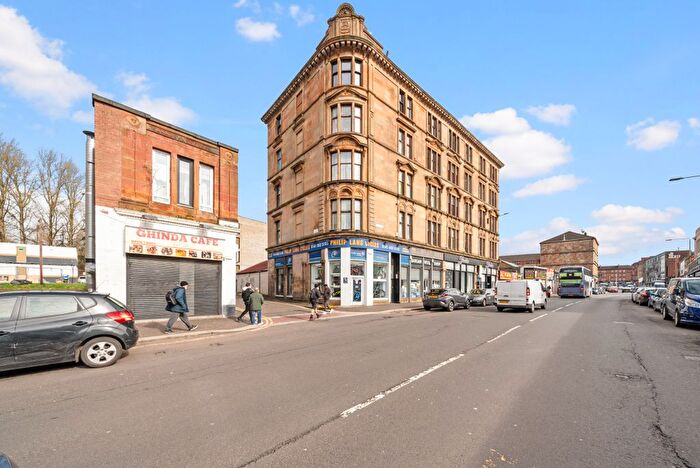
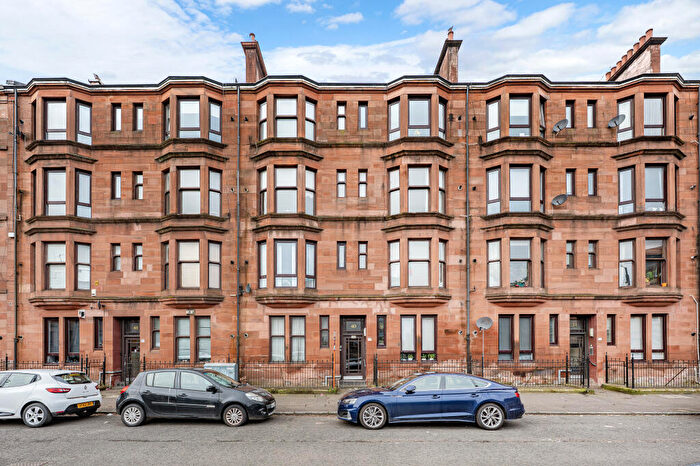
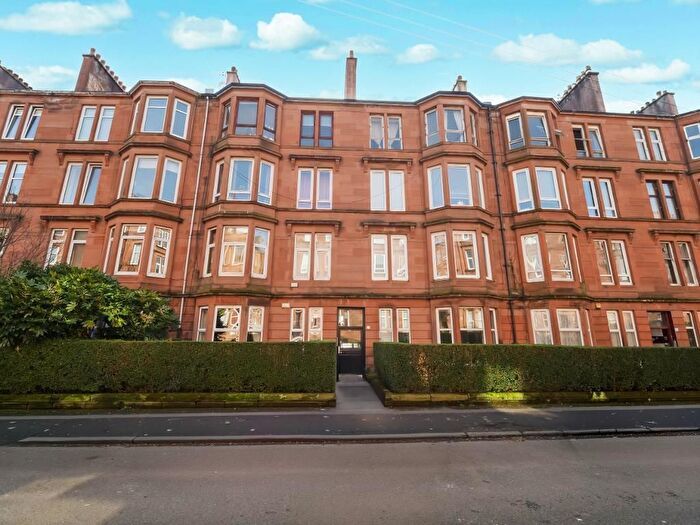
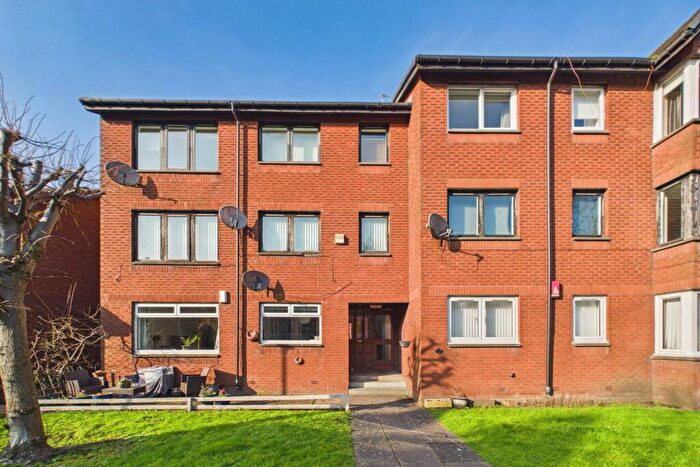
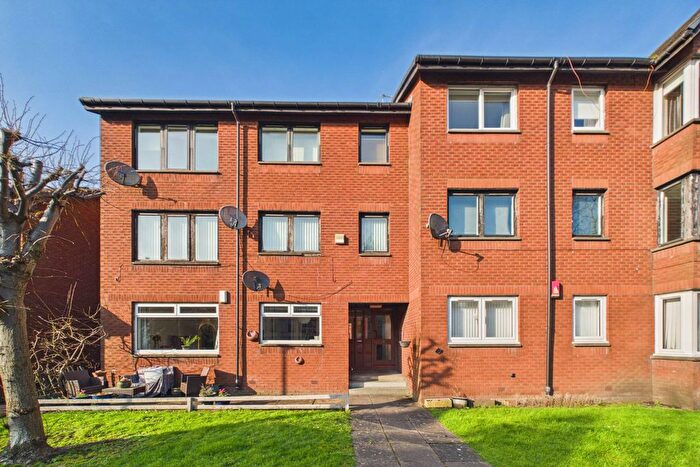
Properties for sale in Dennistoun
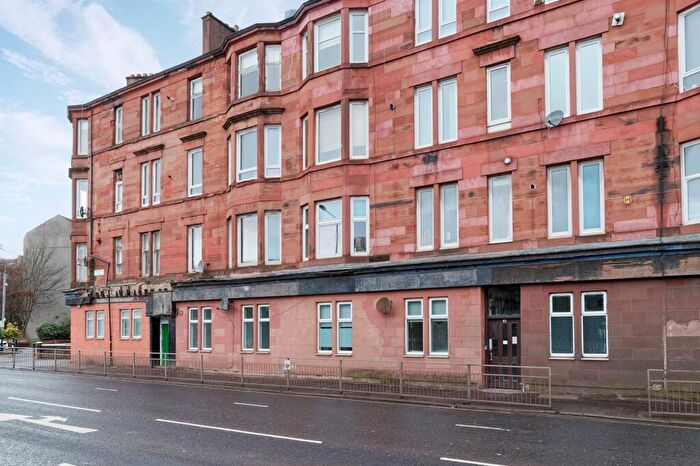

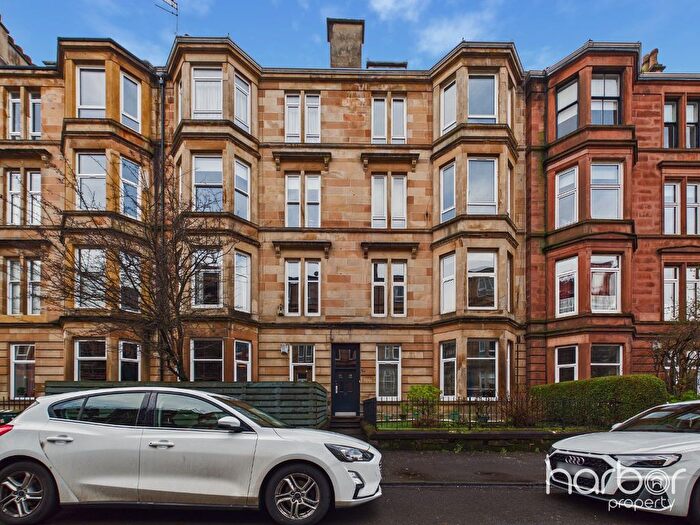
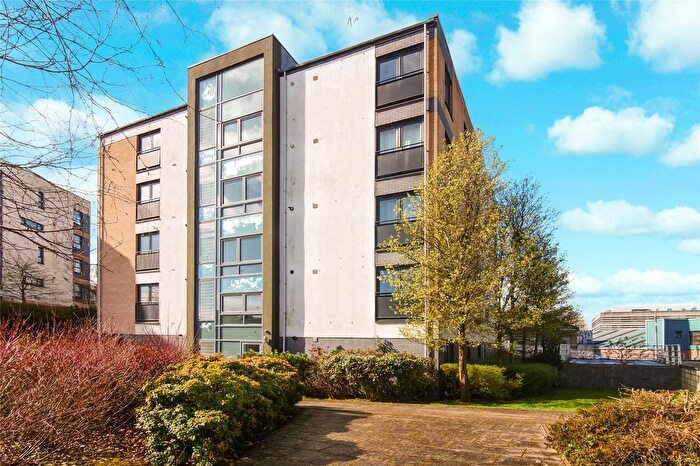
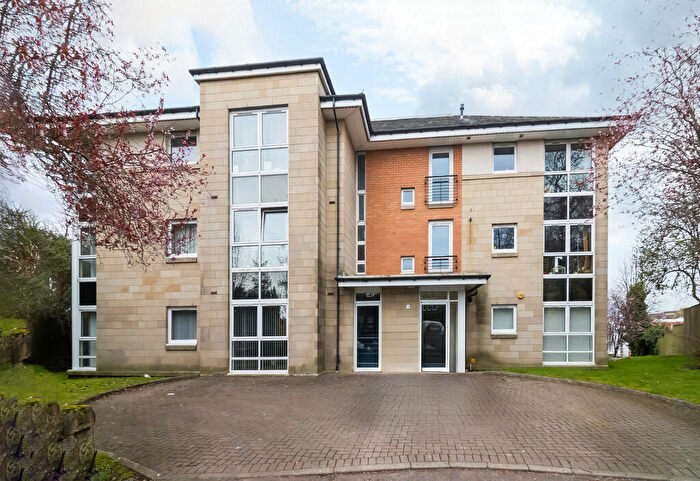
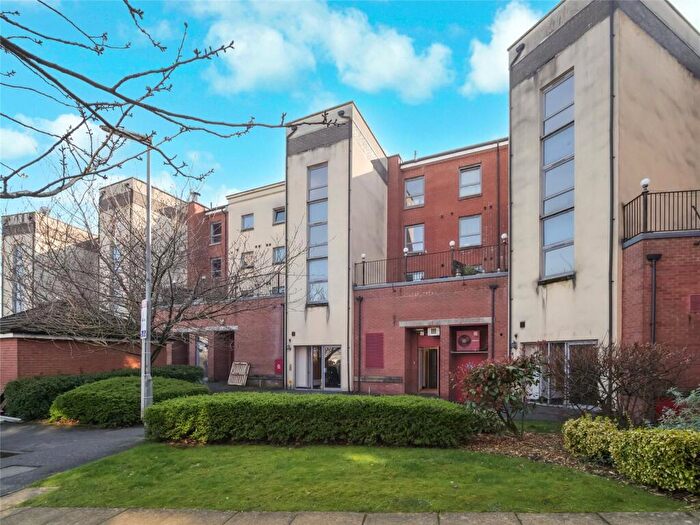
![]()
If you are looking to sell your house, let it out, or receive a property valuation, an expert can help you.
Click the button below to get started.


Roads and Postcodes in Dennistoun
Navigate through our locations to find the location of your next house in Dennistoun, Glasgow for sale or to rent.
Transport near Dennistoun
-
 Alexandra Parade Station
 -
Duke Street Station
-
Bellgrove Station
-
Barnhill Station
-
High Street Station
-
Bridgeton Station
-
Springburn Station
-
Glasgow Queen Street Station
-
Argyle Street Station
-
Dalmarnock Station
- FAQ
- Price Paid By Year
Frequently asked questions about Dennistoun
What is the average price for a property for sale in Dennistoun?
The average price for a property for sale in Dennistoun is £176,845. This amount is 18% lower than the average price in Glasgow. There are 3,905 property listings for sale in Dennistoun.
What streets have the most expensive properties for sale in Dennistoun?
The streets with the most expensive properties for sale in Dennistoun are Oakley Terrace at an average of £488,000, Circus Drive at an average of £403,500 and Whitehill Court at an average of £331,575.
What streets have the most affordable properties for sale in Dennistoun?
The streets with the most affordable properties for sale in Dennistoun are Royston Road at an average of £64,573, Dinwiddie Street at an average of £74,366 and Royston Square at an average of £82,000.
Which train stations are available in or near Dennistoun?
Some of the train stations available in or near Dennistoun are Alexandra Parade, Duke Street and Bellgrove.
Property Price Paid in Dennistoun by Year
The average sold property price by year was:
| Year | Average Sold Price | Price Change |
Sold Properties
|
|---|---|---|---|
| 2025 | £227,070 | 16% |
21 Properties |
| 2024 | £191,423 | 13% |
13 Properties |
| 2023 | £166,301 | 3% |
118 Properties |
| 2022 | £160,679 | 8% |
477 Properties |
| 2021 | £147,642 | 7% |
541 Properties |
| 2020 | £136,812 | 5% |
332 Properties |
| 2019 | £129,600 | 7% |
433 Properties |
| 2018 | £120,147 | 10% |
447 Properties |
| 2017 | £108,502 | 8% |
451 Properties |
| 2016 | £100,256 | 4% |
429 Properties |
| 2015 | £96,624 | 9% |
427 Properties |
| 2014 | £87,754 | 6% |
335 Properties |
| 2013 | £82,755 | -3% |
249 Properties |
| 2012 | £85,649 | -2% |
255 Properties |
| 2011 | £87,682 | 2% |
252 Properties |
| 2010 | £86,115 | -127% |
250 Properties |
| 2009 | £195,824 | 44% |
308 Properties |
| 2008 | £110,521 | 1% |
509 Properties |
| 2007 | £109,639 | 7% |
683 Properties |
| 2006 | £101,945 | 19% |
741 Properties |
| 2005 | £82,513 | -17% |
741 Properties |
| 2004 | £96,166 | 18% |
694 Properties |
| 2003 | £78,685 | 31% |
807 Properties |
| 2002 | £54,155 | 32% |
616 Properties |
| 2001 | £36,704 | - |
41 Properties |