
Houses for sale & to rent in Black Isle, Fortrose
House Prices in Black Isle
Properties in Black Isle have an average house price of £227k and had 50 Property Transactions within the last 3 years¹.
Black Isle is an area in Fortrose, Highland with 1,078 households², where the most expensive property was sold for £445k.
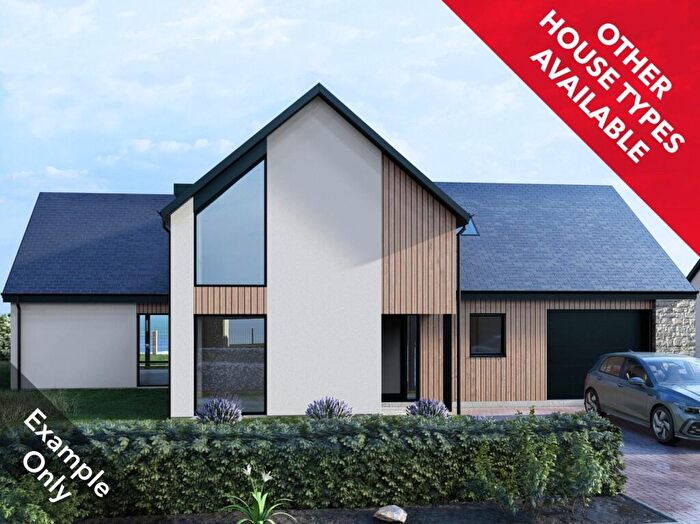
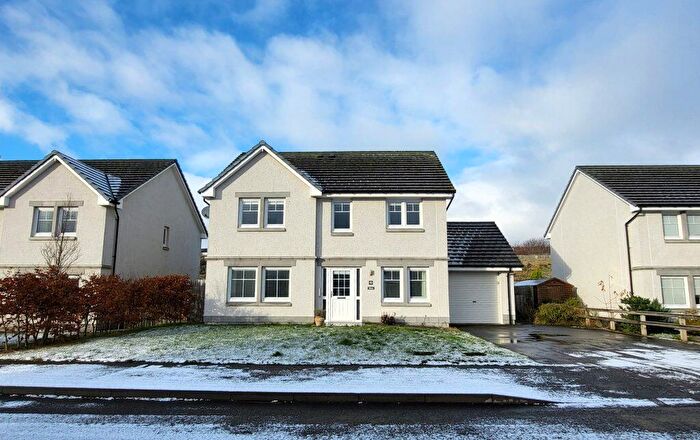
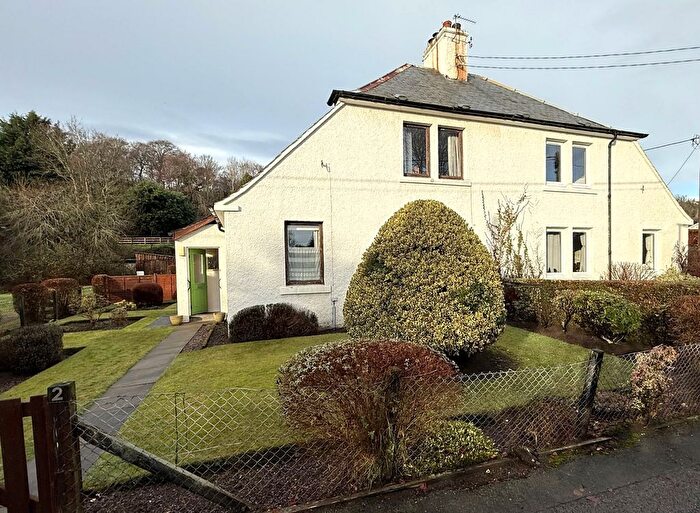
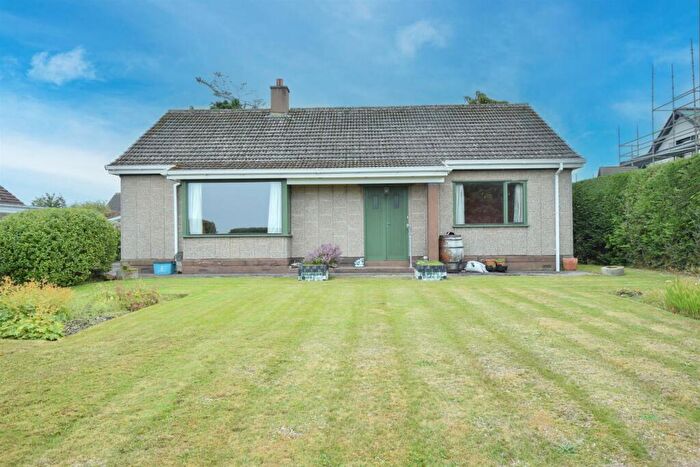
Properties for sale in Black Isle
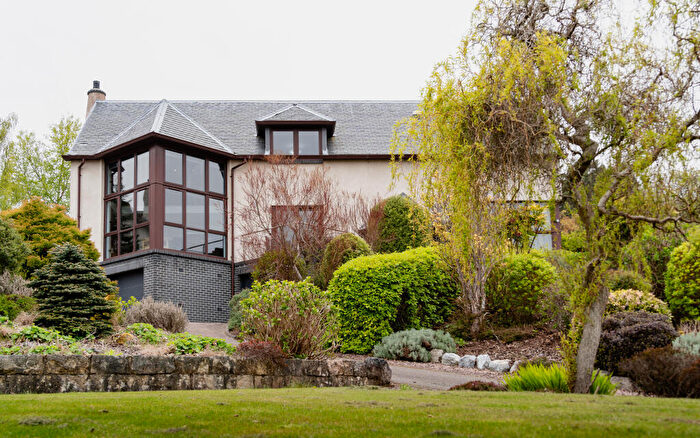
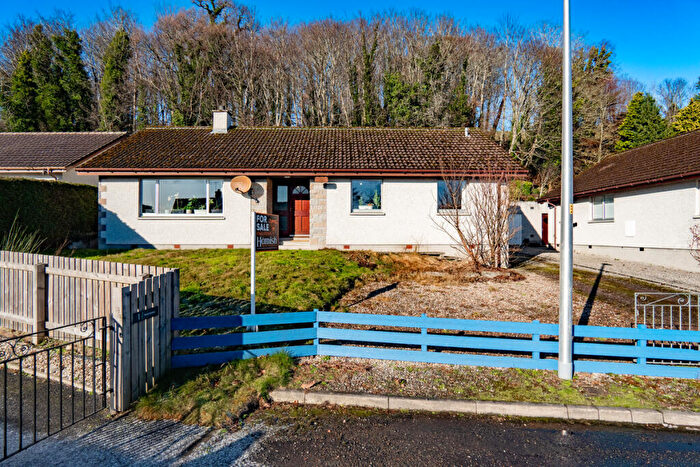
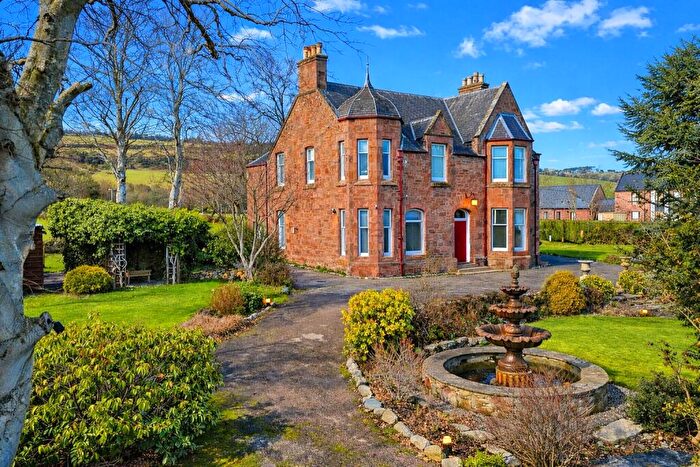
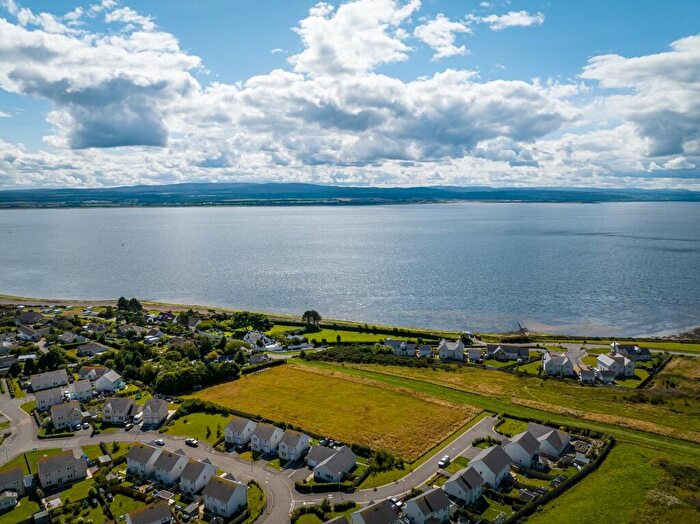
![]()
If you are looking to sell your house, let it out, or receive a property valuation, an expert can help you.
Click the button below to get started.


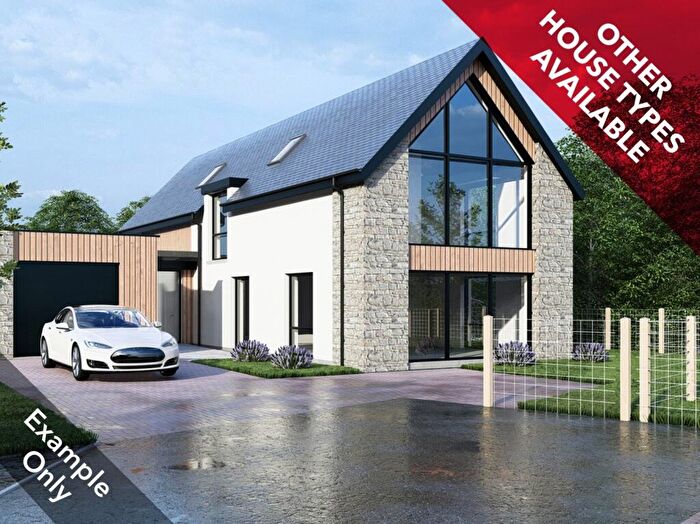
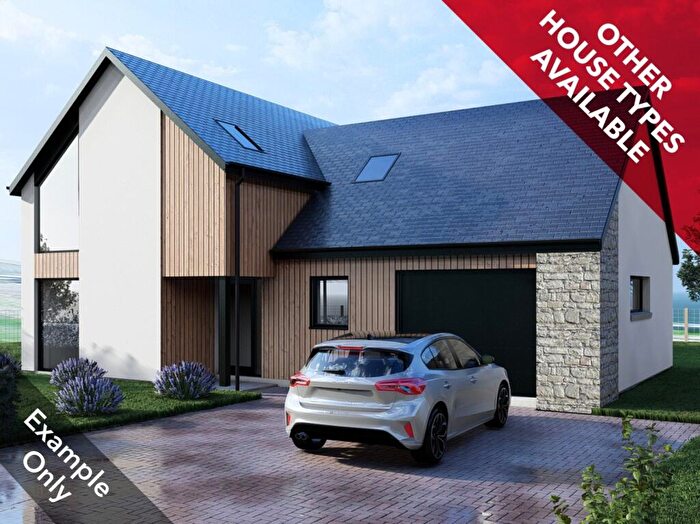
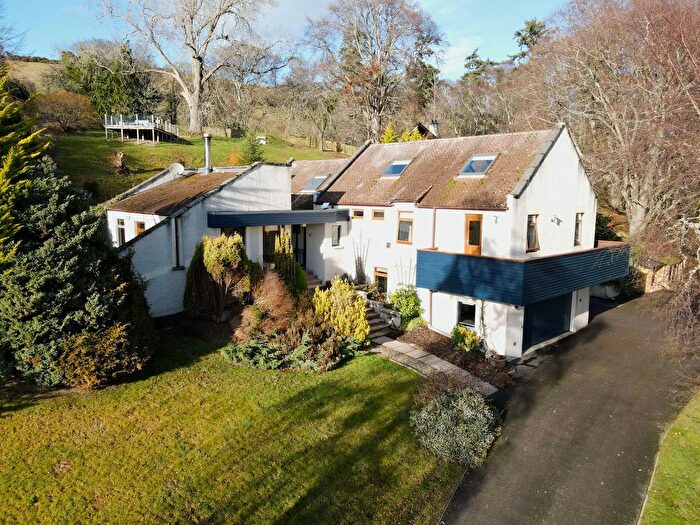
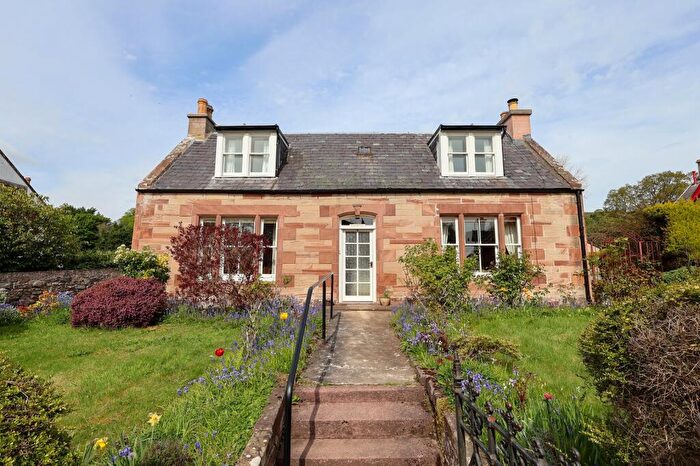
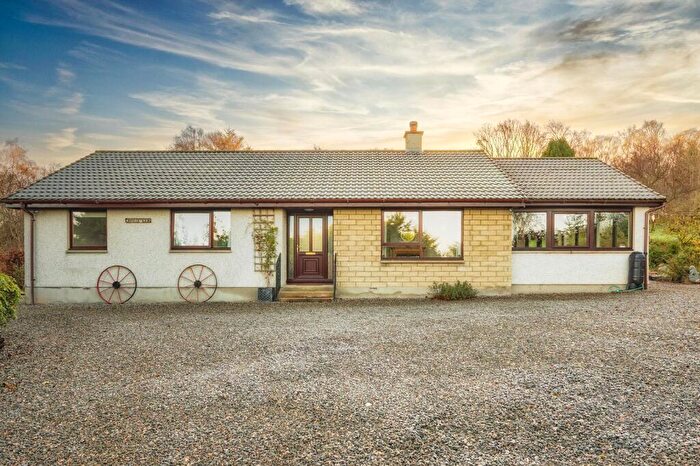
Previously listed properties in Black Isle
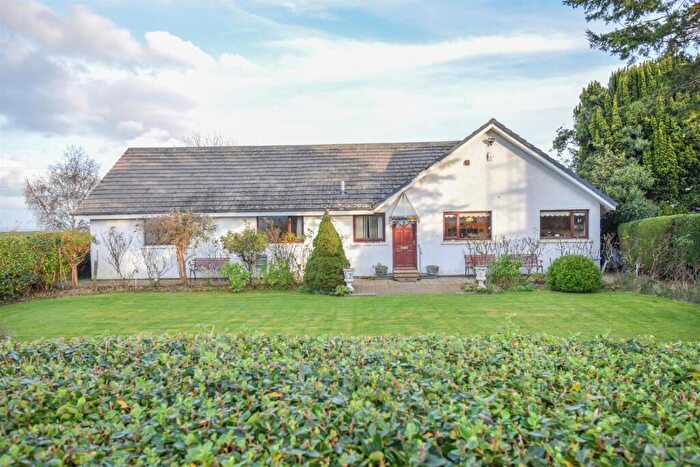
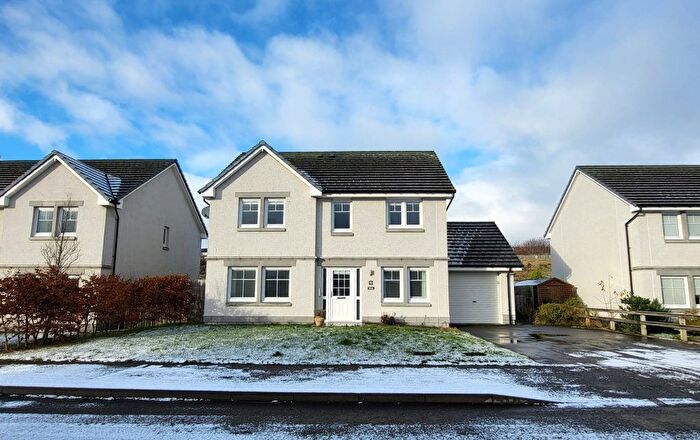
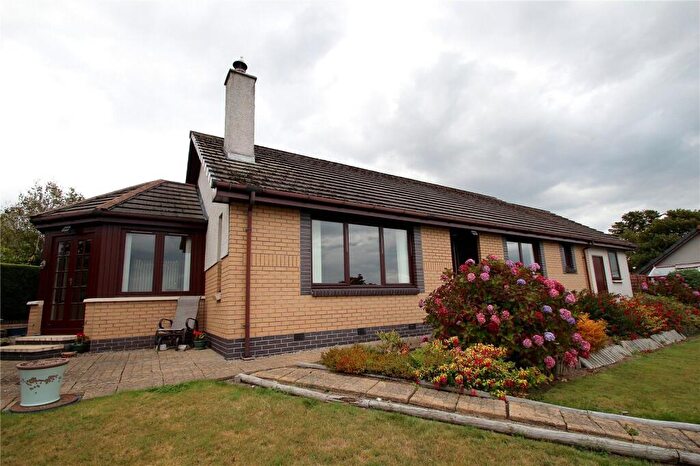
![]()
If you are looking to sell your house, let it out, or receive a property valuation, an expert can help you.
Click the button below to get started.
Roads and Postcodes in Black Isle
Navigate through our locations to find the location of your next house in Black Isle, Fortrose for sale or to rent.
| Streets | Postcodes |
|---|---|
| Academy Street | IV10 8TW |
| Alexander Court | IV10 8TZ |
| Anderson Drive | IV10 8TG |
| Balfour Court | IV10 8SB |
| Barclay Drive | IV10 8AA |
| Bishops Road | IV10 8TR |
| Boniface Gardens | IV10 8RP |
| Bridge Street | IV10 8UP |
| Canonbury Terrace | IV10 8TT |
| Castle Street | IV10 8TH |
| Cathedral Square | IV10 8TB |
| Chanonry Crescent | IV10 8RH |
| Church Street | IV10 8TE |
| Cornwell Crescent | IV10 8AB |
| Courthill Road | IV10 8UE |
| Crawford Avenue | IV10 8UX |
| Deans Road | IV10 8TJ |
| Dolphin Drive | IV10 8AE |
| Doupac Gardens | IV10 8WD |
| East Watergate | IV10 8SF IV10 8TQ |
| Feddon Hill | IV10 8SP IV10 8SR |
| Golf Course Road | IV10 8AJ |
| Gollanhead Avenue | IV10 8UG |
| Gowanbrae Crescent | IV10 8UQ |
| Greengates Place | IV10 8RY |
| Greenside Avenue | IV10 8XA |
| Greenside Street | IV10 8AG |
| Harbour Road | IV10 8TY |
| Hawkhill Road | IV10 8UJ |
| High Street | IV10 8SU IV10 8SX IV10 8TA IV10 8TF IV10 8TX IV10 8UF |
| Lumsden Gardens | IV10 8RS |
| Macdowall Court | IV10 8RW |
| Mackeddie Drive | IV10 8RJ |
| Mackenzie Terrace | IV10 8UH |
| Manse Brae | IV10 8UD |
| Marine Terrace | IV10 8UL |
| Mario Place | IV10 8RR |
| Matheson Drive | IV10 8AD |
| Mill Road | IV10 8UN |
| Miller Arch | IV10 8UZ |
| Munro Terrace | IV10 8UR |
| Ness Road | IV10 8SD IV10 8AH |
| Ness Road East | IV10 8SE |
| Ness Way | IV10 8SS |
| Platcock Wynd | IV10 8SQ |
| Precincts Road | IV10 8TS |
| Rodger Close | IV10 8SA |
| Rodger Court | IV10 8UA |
| Rose Street | IV10 8TN |
| Rosemarkie Road | IV10 8UB |
| Ross Crescent | IV10 8RT |
| Ryebank | IV10 8XB |
| Ryebank Court | IV10 8XD |
| Seaforth Drive | IV10 8RQ |
| St Andrews Walk | IV10 8TP |
| Station Crescent | IV10 8SZ |
| Station Road | IV10 8SY |
| Station Square | IV10 8WA |
| The Glebe | IV10 8US |
| The Orchard | IV10 8ST |
| Union Street | IV10 8TD |
| Well Road | IV10 8UW |
| Young Court | IV10 8UY |
| IV10 8RA IV10 8RX IV10 8RZ IV10 8SG IV10 8SH IV10 8SJ IV10 8SL IV10 8SN IV10 8SW IV10 8TL IV10 8TU IV10 8WZ IV10 8YF IV10 8WX |
Transport near Black Isle

- FAQ
- Price Paid By Year
Frequently asked questions about Black Isle
What is the average price for a property for sale in Black Isle?
The average price for a property for sale in Black Isle is £227,204. There are 175 property listings for sale in Black Isle.
What streets have the most expensive properties for sale in Black Isle?
The streets with the most expensive properties for sale in Black Isle are Greenside Avenue at an average of £335,000, Courthill Road at an average of £328,166 and Ross Crescent at an average of £328,000.
What streets have the most affordable properties for sale in Black Isle?
The streets with the most affordable properties for sale in Black Isle are Station Square at an average of £95,500, Rose Street at an average of £137,500 and Platcock Wynd at an average of £145,000.
Which train stations are available in or near Black Isle?
Some of the train stations available in or near Black Isle are Invergordon, Inverness and Alness.
Property Price Paid in Black Isle by Year
The average sold property price by year was:
| Year | Average Sold Price | Price Change |
Sold Properties
|
|---|---|---|---|
| 2025 | £218,690 | -0,1% |
11 Properties |
| 2024 | £218,869 | -9% |
18 Properties |
| 2023 | £238,807 | -14% |
21 Properties |
| 2022 | £272,750 | -2% |
47 Properties |
| 2021 | £278,898 | 25% |
52 Properties |
| 2020 | £210,010 | -11% |
40 Properties |
| 2019 | £232,301 | -5% |
58 Properties |
| 2018 | £243,360 | 4% |
71 Properties |
| 2017 | £234,012 | 12% |
61 Properties |
| 2016 | £204,816 | -3% |
68 Properties |
| 2015 | £210,202 | 7% |
77 Properties |
| 2014 | £194,955 | -11% |
56 Properties |
| 2013 | £215,878 | 22% |
56 Properties |
| 2012 | £168,384 | -23% |
48 Properties |
| 2011 | £207,640 | 2% |
35 Properties |
| 2010 | £203,606 | 11% |
32 Properties |
| 2009 | £181,207 | 13% |
47 Properties |
| 2008 | £156,781 | -7% |
42 Properties |
| 2007 | £168,445 | 13% |
65 Properties |
| 2006 | £146,691 | -15% |
60 Properties |
| 2005 | £169,019 | 33% |
51 Properties |
| 2004 | £113,446 | -11% |
58 Properties |
| 2003 | £125,533 | 34% |
41 Properties |
| 2002 | £83,372 | 26% |
12 Properties |
| 2001 | £61,886 | - |
15 Properties |