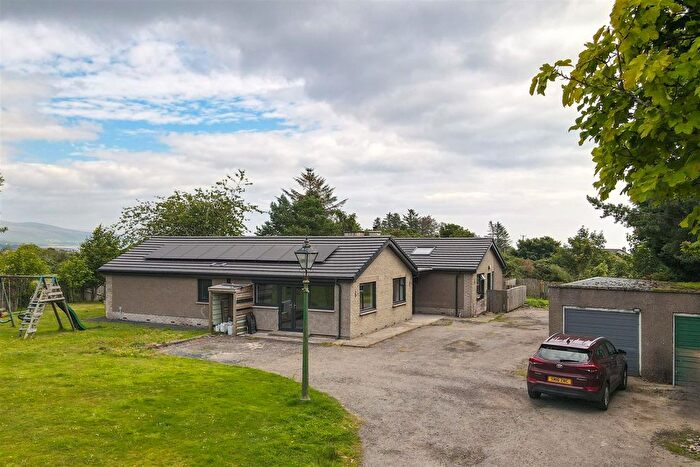
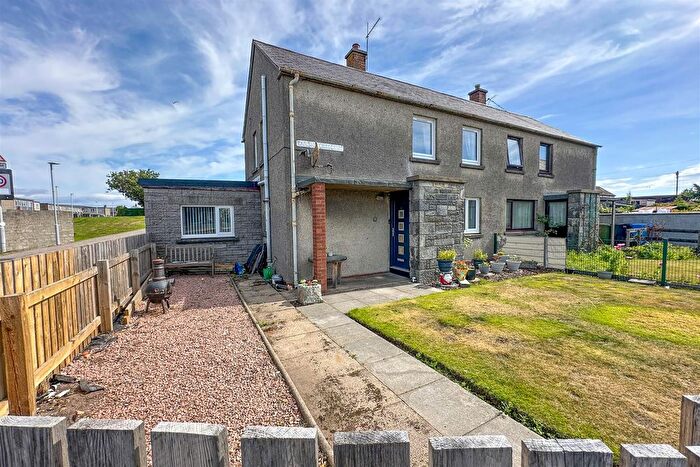
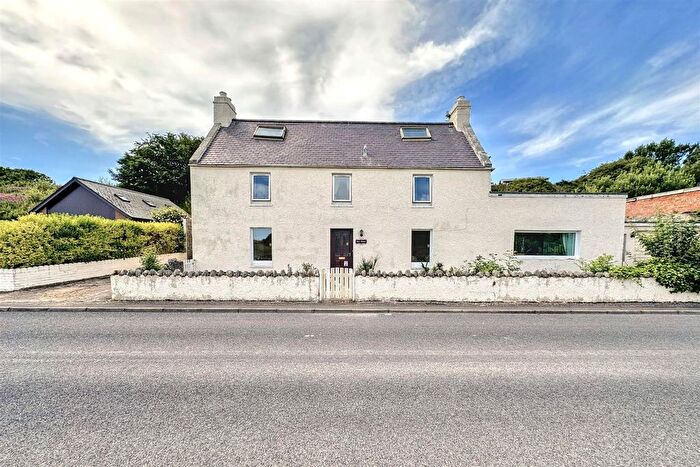
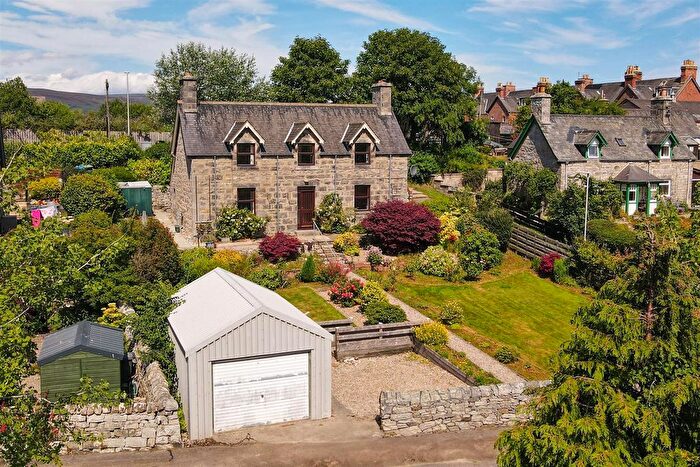
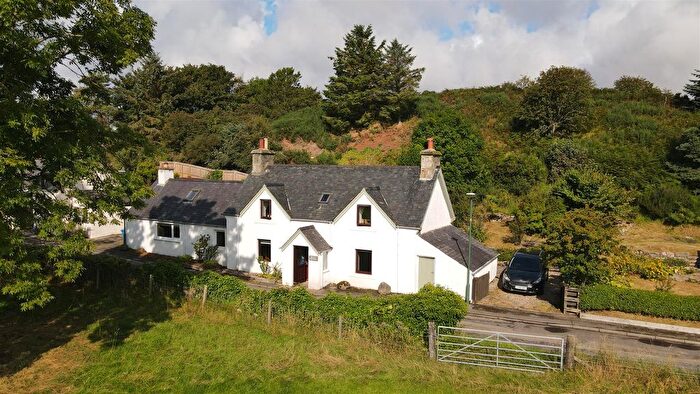
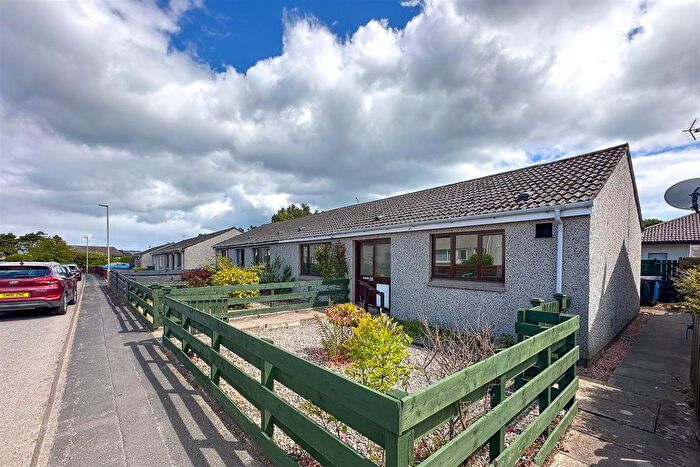
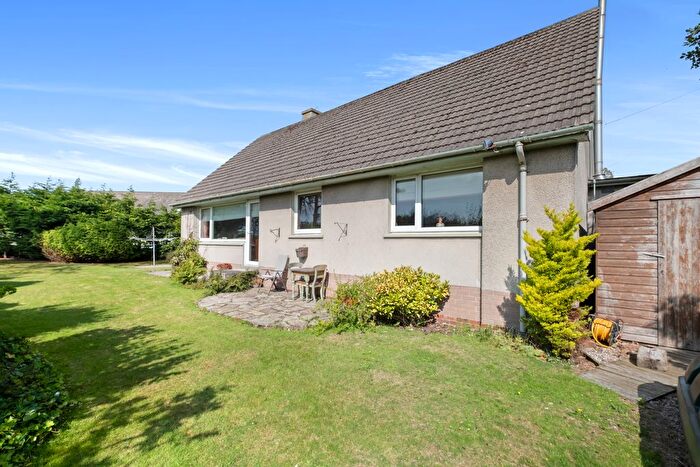
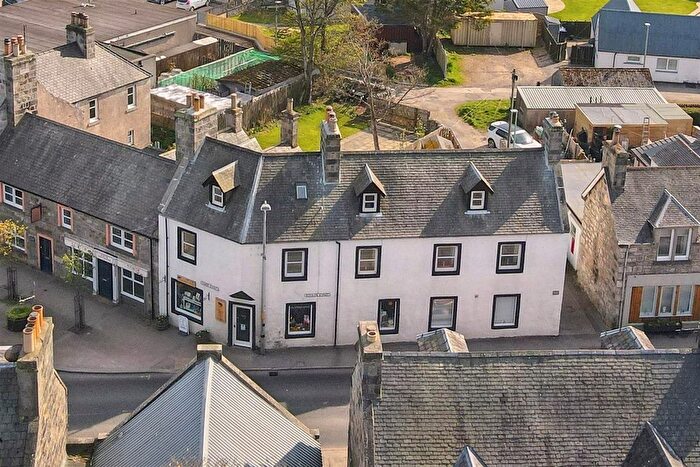
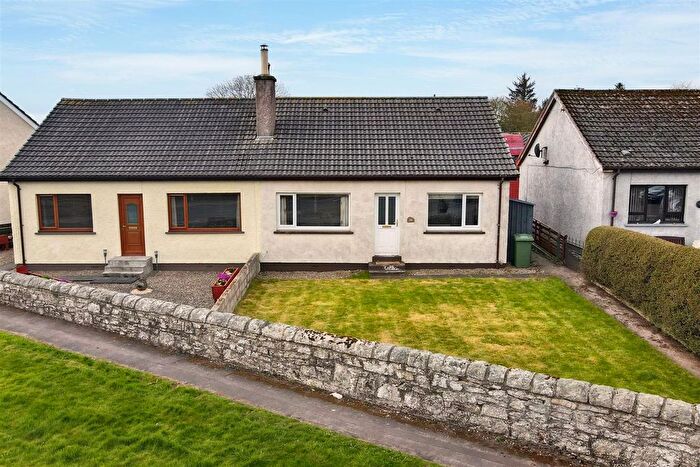
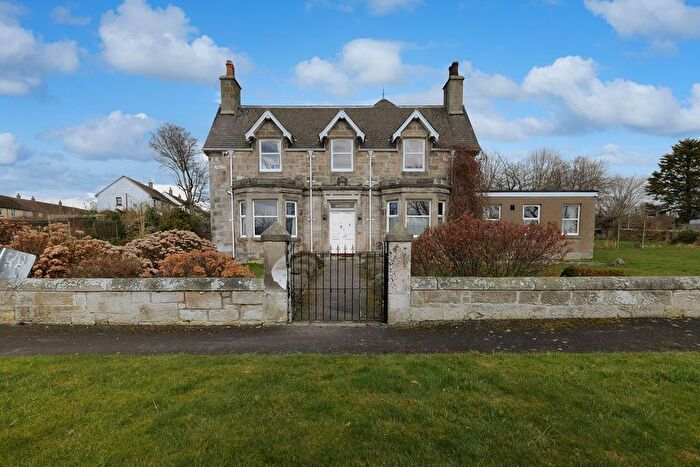
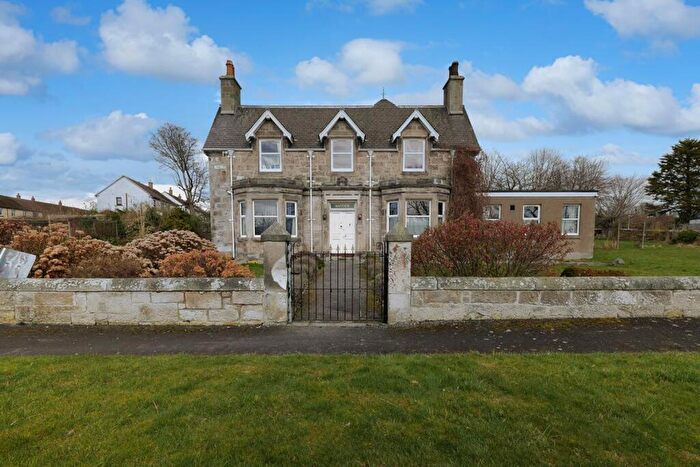
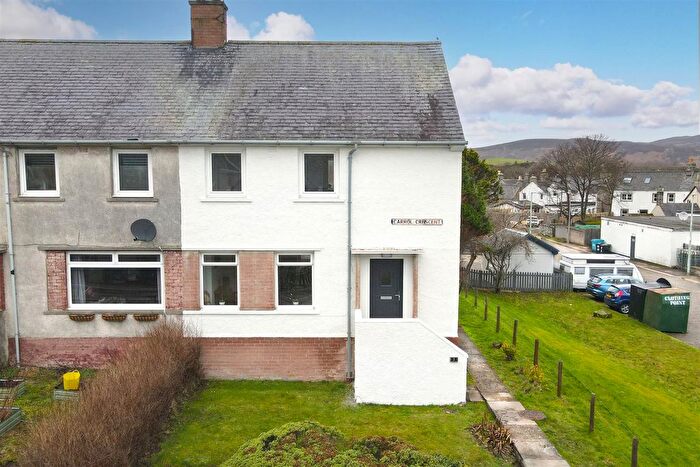
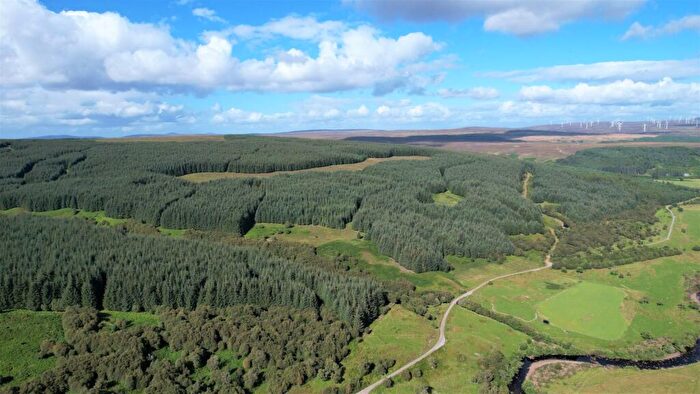
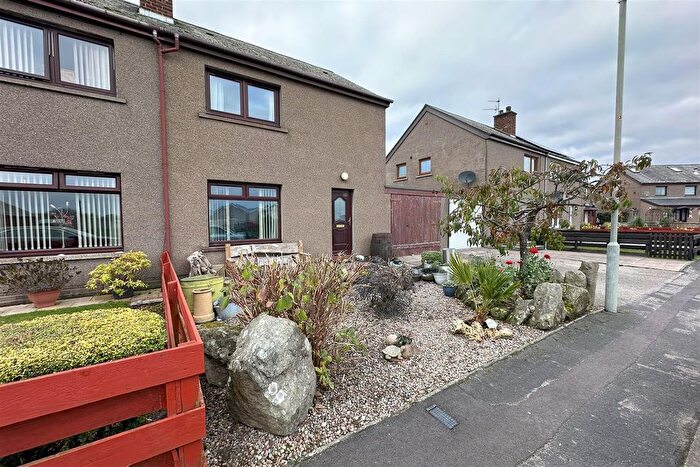
Houses for sale & to rent in East Sutherland and Edderton, Brora
House Prices in East Sutherland and Edderton
Properties in East Sutherland and Edderton have an average house price of £158,280.00 and had 33 Property Transactions within the last 3 years¹.
East Sutherland and Edderton is an area in Brora, Highland with 848 households², where the most expensive property was sold for £315,000.00.
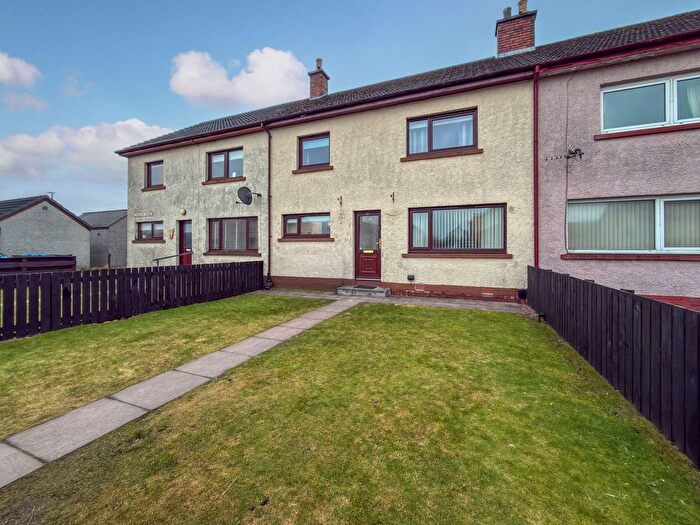
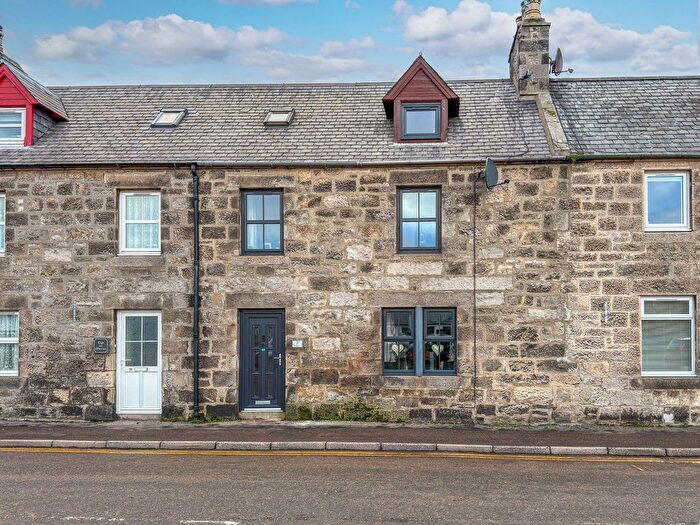
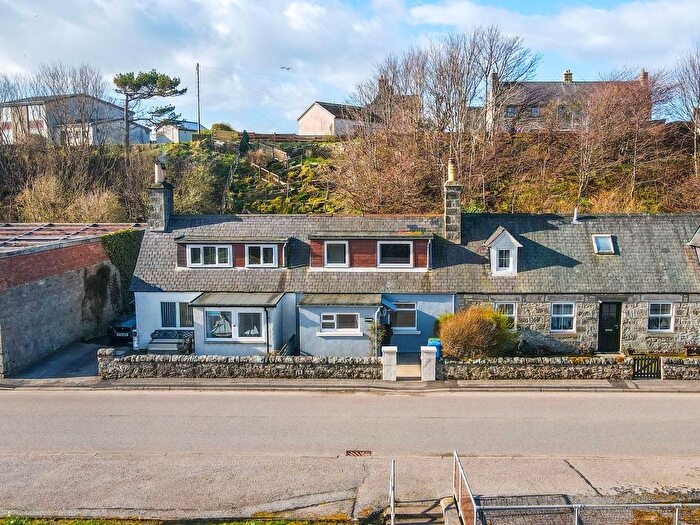
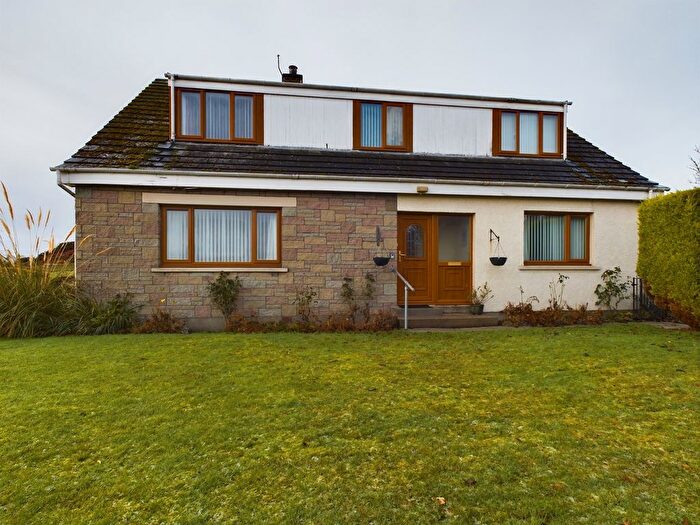
Properties for sale in East Sutherland and Edderton
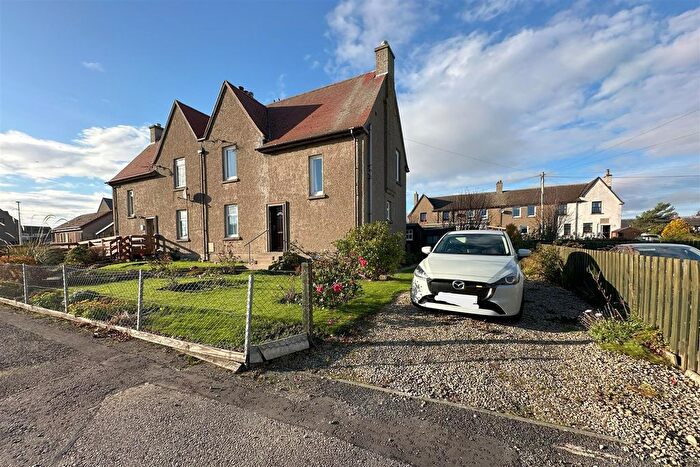
Previously listed properties in East Sutherland and Edderton
Roads and Postcodes in East Sutherland and Edderton
Navigate through our locations to find the location of your next house in East Sutherland and Edderton, Brora for sale or to rent.
| Streets | Postcodes |
|---|---|
| Academy Place | KW9 6QR |
| Academy Street | KW9 6QP |
| Ben Mailey Gardens | KW9 6QL |
| Braambury Road | KW9 6LW |
| Bridgend | KW9 6NR |
| Carrol Crescent | KW9 6PQ |
| Colbheinn Road | KW9 6NZ |
| Dudgeon Drive | KW9 6PN |
| Dudgeon Park Road | KW9 6NA |
| Elder Street | KW9 6QD |
| Fascally Cottages | KW9 6NF |
| Fountain Square | KW9 6NX |
| George Street | KW9 6QA |
| Golf Road | KW9 6PY KW9 6QS KW9 6QT |
| Gower Court | KW9 6NW |
| Gower Street | KW9 6PB KW9 6PD KW9 6PU |
| Gower Street Lane | KW9 6NT |
| Harbour Road | KW9 6QF |
| High Street | KW9 6PA |
| Industrial Estate | KW9 6LA |
| Johnstone Crescent | KW9 6PH |
| Johnstone Lane | KW9 6AB |
| Johnstone Place | KW9 6PF KW9 6PG |
| Manse Park | KW9 6PT |
| Market Street | KW9 6PX |
| Memorial Square | KW9 6NS |
| Mill Way | KW9 6AD |
| Moray Terrace | KW9 6PR |
| Muirfield Court | KW9 6LZ |
| Muirfield Drive | KW9 6QQ |
| Muirfield Road | KW9 6QY |
| Park Court | KW9 6NP |
| Park Terrace | KW9 6ND |
| Red Row | KW9 6QB |
| Riverside | KW9 6NB |
| Ross Terrace | KW9 6PP |
| Rosslyn Street | KW9 6NY |
| Salt Street | KW9 6PZ |
| Seaforth Place | KW9 6PL |
| Shore Street | KW9 6QE |
| South Brae | KW9 6NU |
| Stafford Terrace | KW9 6QW |
| Station Square | KW9 6QJ |
| Tarbat Crescent | KW9 6PJ |
| The Terrace | KW9 6LY |
| Uppat Place | KW9 6PW |
| Victoria Crescent | KW9 6QU |
| Victoria Drive | KW9 6QX |
| Victoria Road | KW9 6LN KW9 6QN |
| KW9 6LE KW9 6LP KW9 6LR KW9 6LS KW9 6LT KW9 6LU KW9 6LX KW9 6NE KW9 6NG KW9 6NH KW9 6NJ KW9 6NL KW9 6NN KW9 6NQ KW9 6PS KW9 6QH KW9 6QZ |
Transport near East Sutherland and Edderton
- FAQ
- Price Paid By Year
Frequently asked questions about East Sutherland and Edderton
What is the average price for a property for sale in East Sutherland and Edderton?
The average price for a property for sale in East Sutherland and Edderton is £158,280. There are 98 property listings for sale in East Sutherland and Edderton.
What streets have the most expensive properties for sale in East Sutherland and Edderton?
The streets with the most expensive properties for sale in East Sutherland and Edderton are Market Street at an average of £231,250, Academy Street at an average of £191,666 and Mill Way at an average of £134,000.
What streets have the most affordable properties for sale in East Sutherland and Edderton?
The streets with the most affordable properties for sale in East Sutherland and Edderton are Stafford Terrace at an average of £100,000, Academy Place at an average of £105,000 and Carrol Crescent at an average of £108,500.
Which train stations are available in or near East Sutherland and Edderton?
Some of the train stations available in or near East Sutherland and Edderton are Brora, Dunrobin Castle and Golspie.
Property Price Paid in East Sutherland and Edderton by Year
The average sold property price by year was:
| Year | Average Sold Price | Price Change |
Sold Properties
|
|---|---|---|---|
| 2025 | £128,333 | -19% |
9 Properties |
| 2024 | £152,625 | -19% |
10 Properties |
| 2023 | £181,571 | -2% |
14 Properties |
| 2022 | £184,399 | 3% |
27 Properties |
| 2021 | £178,564 | 16% |
35 Properties |
| 2020 | £150,466 | - |
36 Properties |
| 2019 | £150,539 | 6% |
39 Properties |
| 2018 | £141,670 | 5% |
37 Properties |
| 2017 | £134,025 | 9% |
29 Properties |
| 2016 | £122,048 | 1% |
31 Properties |
| 2015 | £121,408 | 4% |
18 Properties |
| 2014 | £117,103 | 15% |
27 Properties |
| 2013 | £100,036 | -56% |
18 Properties |
| 2012 | £155,591 | 30% |
17 Properties |
| 2011 | £108,369 | -41% |
15 Properties |
| 2010 | £152,442 | 4% |
28 Properties |
| 2009 | £147,023 | 14% |
31 Properties |
| 2008 | £127,000 | 6% |
16 Properties |
| 2007 | £118,934 | 5% |
35 Properties |
| 2006 | £113,442 | -4% |
37 Properties |
| 2005 | £118,367 | 39% |
51 Properties |
| 2004 | £72,237 | 35% |
44 Properties |
| 2003 | £47,087 | -15% |
30 Properties |
| 2002 | £54,094 | -2% |
7 Properties |
| 2001 | £55,294 | -59% |
7 Properties |
| 2000 | £87,665 | - |
3 Properties |

