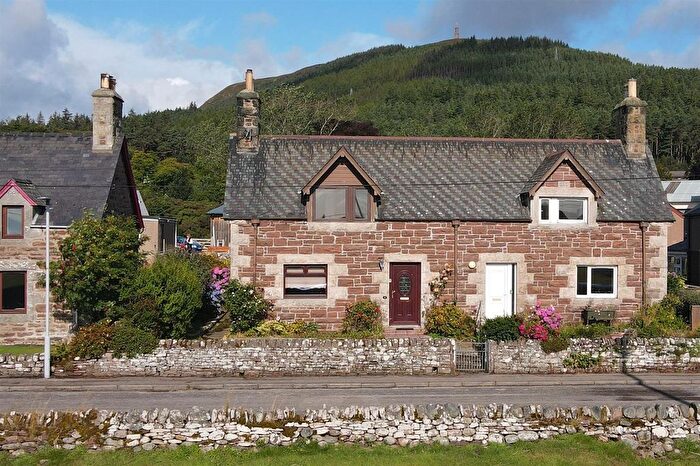
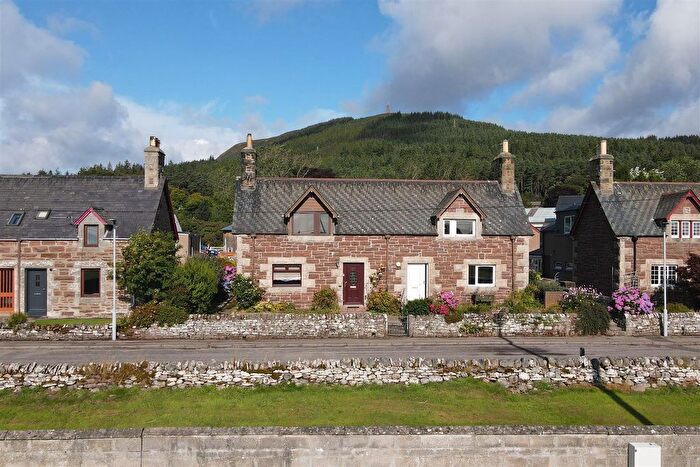
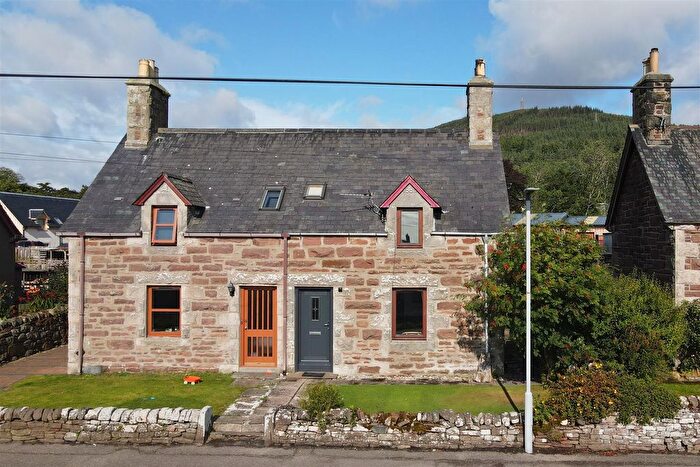
Houses for sale & to rent in East Sutherland and Edderton, Golspie
House Prices in East Sutherland and Edderton
Properties in East Sutherland and Edderton have an average house price of £184,688.00 and had 26 Property Transactions within the last 3 years¹.
East Sutherland and Edderton is an area in Golspie, Highland with 744 households², where the most expensive property was sold for £620,000.00.
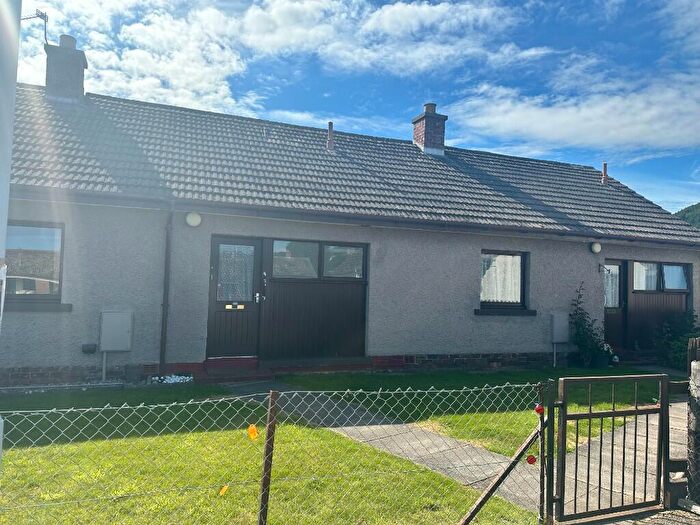
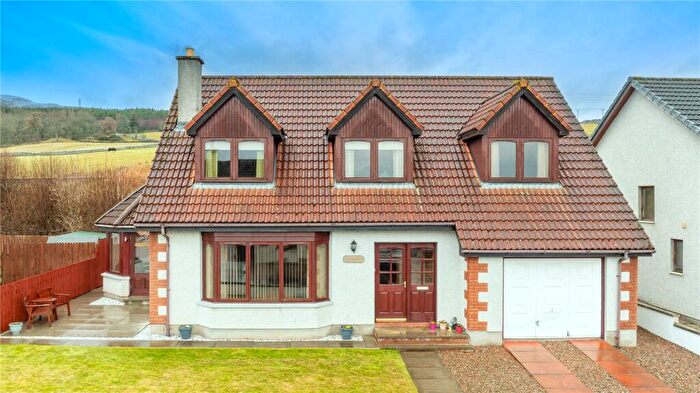
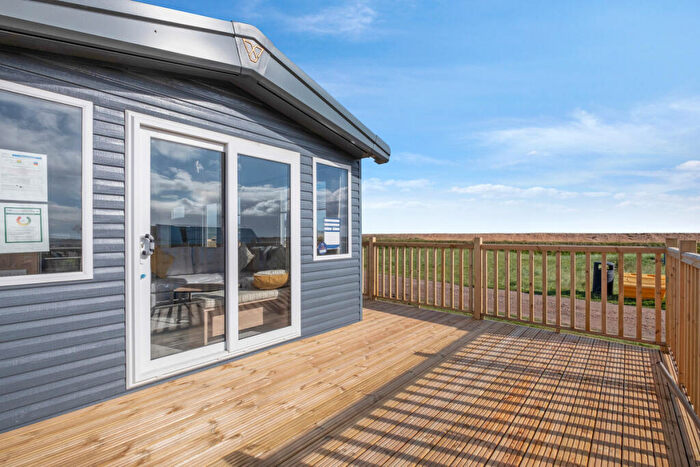
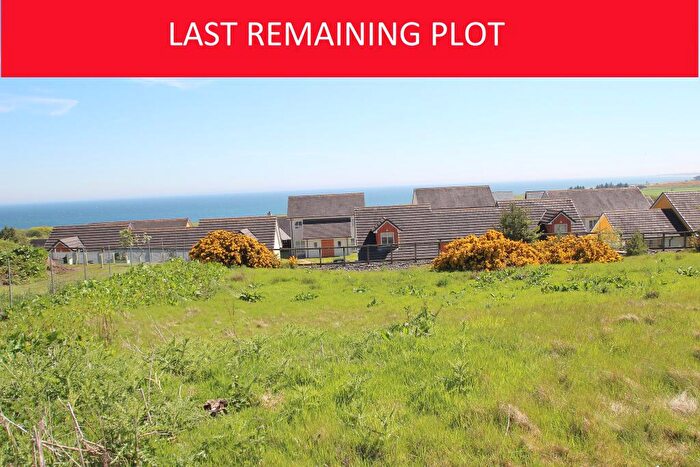
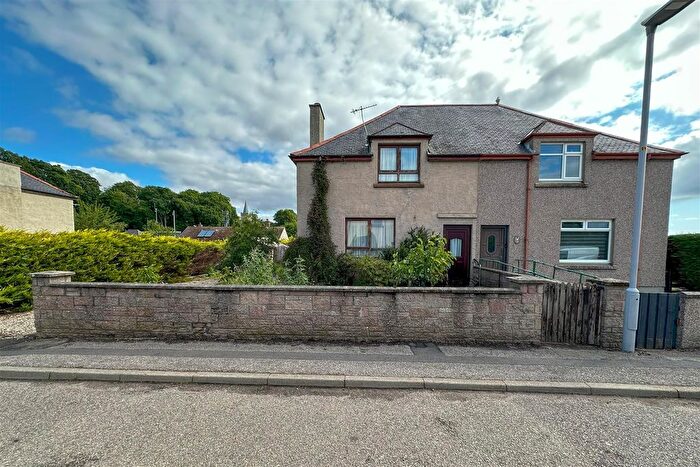
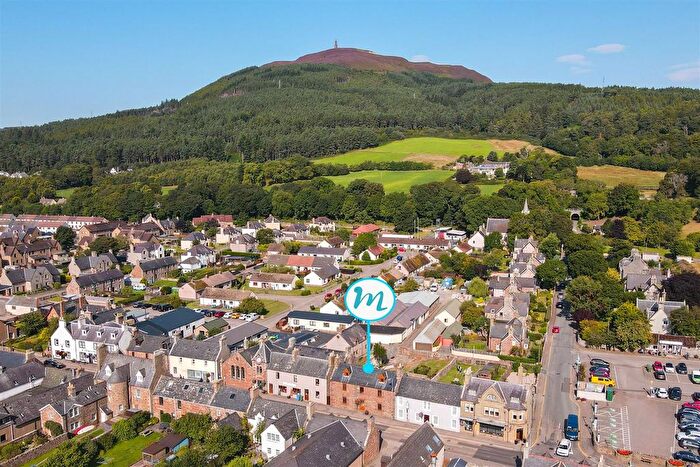
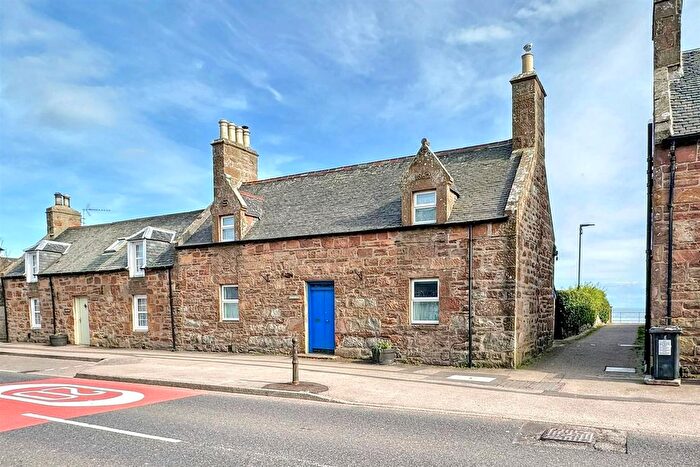
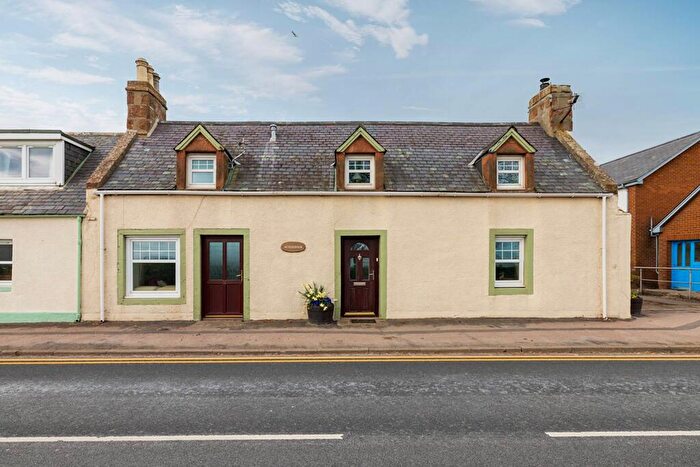
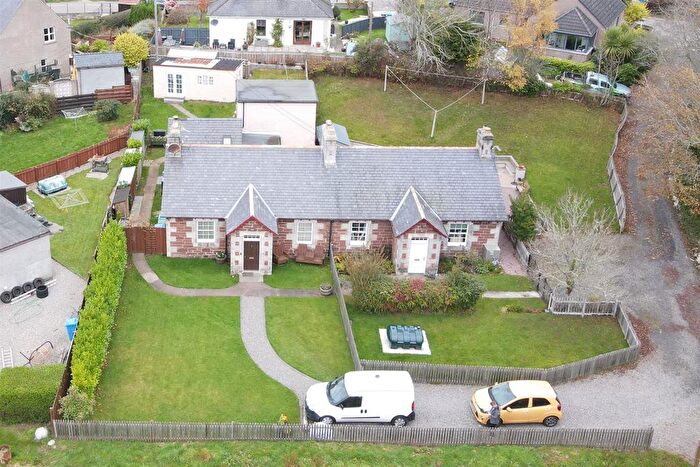
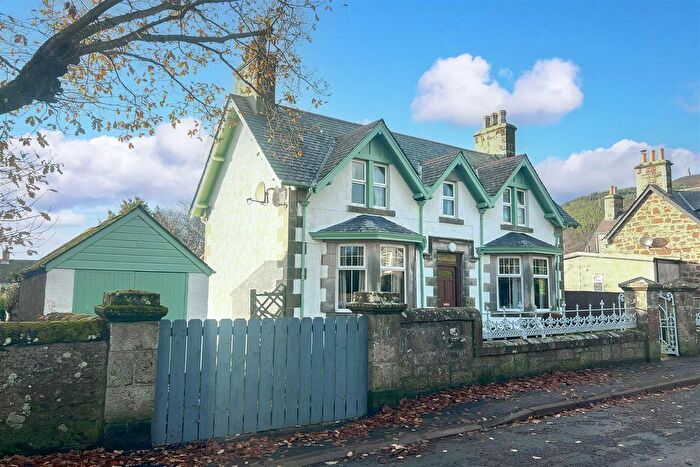
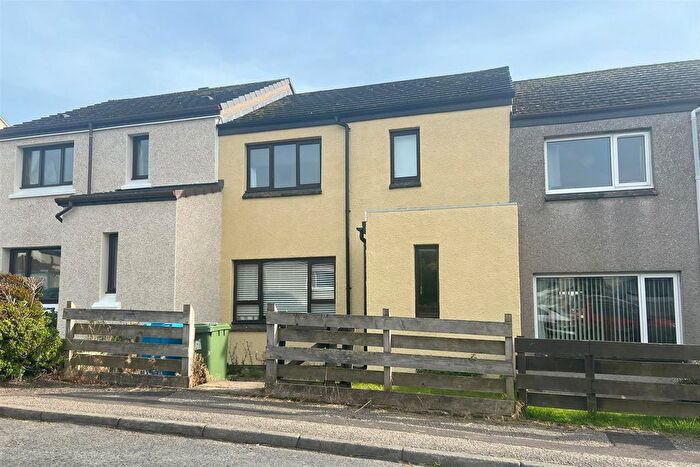
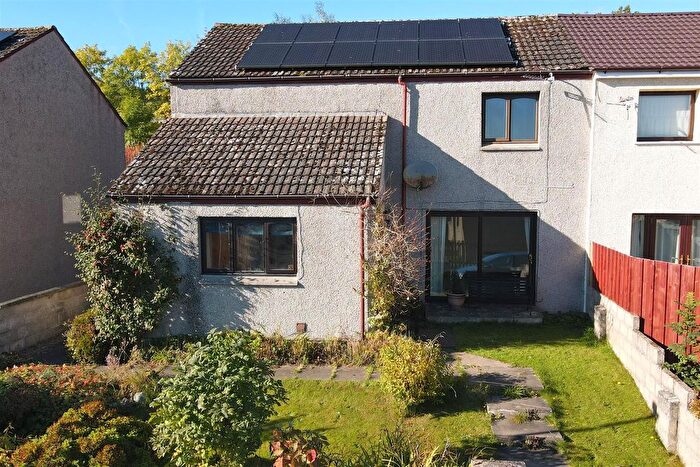
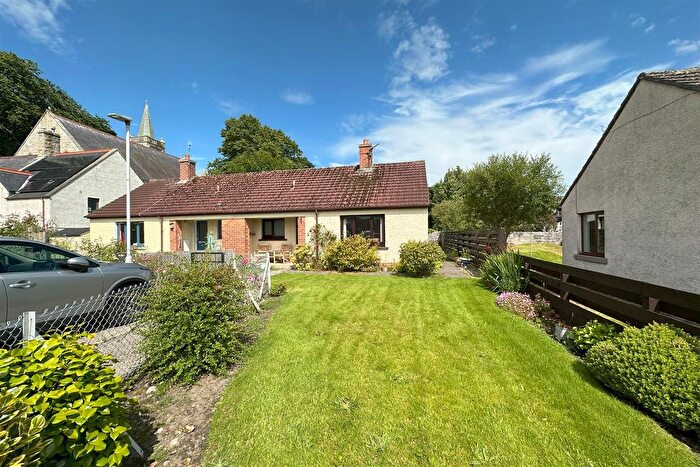
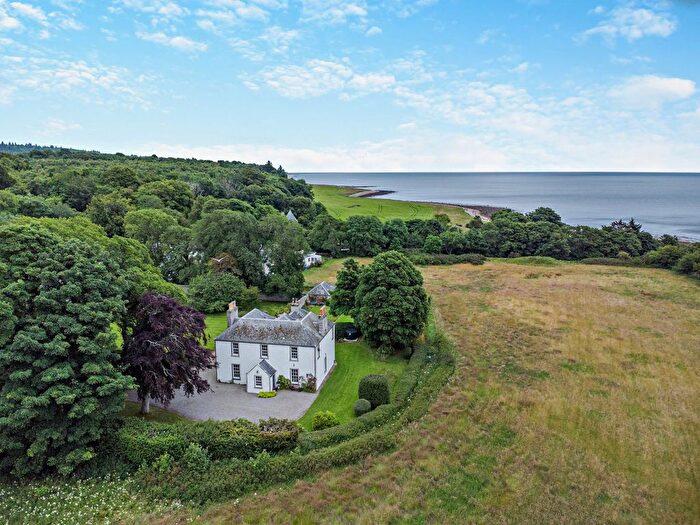
Properties for sale in East Sutherland and Edderton
Previously listed properties in East Sutherland and Edderton
Roads and Postcodes in East Sutherland and Edderton
Navigate through our locations to find the location of your next house in East Sutherland and Edderton, Golspie for sale or to rent.
| Streets | Postcodes |
|---|---|
| Alistair Road | KW10 6SW |
| Argo Terrace | KW10 6RZ |
| Back Road | KW10 6RW KW10 6SP |
| Back Street | KW10 6SQ |
| Ben Bhraggie Drive | KW10 6SX |
| Ben Bhraggie Terrace | KW10 6SU |
| Church Street | KW10 6TT |
| Clachan Way | KW10 6UE |
| Drummuie Road | KW10 6SY |
| Drummuie Terrace | KW10 6SZ |
| Duke Street | KW10 6RP KW10 6RR |
| East Millicent Avenue | KW10 6TL |
| Ferry Road | KW10 6ST |
| Fountain Road | KW10 6TH |
| Fraser Street | KW10 6TR |
| Golspie Business Park | KW10 6UB |
| Golspie Industrial Estate | KW10 6RN |
| Grant Crescent | KW10 6TS |
| Hallow Park | KW10 6RQ |
| Heavitree Lane | KW10 6UA |
| Hens Run | KW10 6AB |
| Hynds Lane | KW10 6TF |
| Kinghorn Court | KW10 6SJ |
| Lindsay Street | KW10 6TN KW10 6TP |
| Lundie Drive | KW10 6UF |
| Main Street | KW10 6RA KW10 6RB KW10 6RF KW10 6RH KW10 6RJ KW10 6TG KW10 6TQ |
| Millicent Avenue | KW10 6TW |
| Murdo's Lane | KW10 6TE |
| Old Bank Road | KW10 6RS |
| Park Street | KW10 6RY |
| Ross Gardens | KW10 6SL |
| Ross Street | KW10 6SA |
| Seaforth Road | KW10 6TJ |
| Shore Street | KW10 6TY |
| Sibell Road | KW10 6RU |
| South Argo Terrace | KW10 6RX |
| Sportsmans Walk | KW10 6SH |
| Station Road | KW10 6SN KW10 6SR KW10 6SS |
| Sutherland Road | KW10 6TX |
| Tarbat View | KW10 6UD |
| Tower Street | KW10 6SB |
| Woodland Crescent | KW10 6TZ |
| Woodland Way | KW10 6TU |
| KW10 6AA KW10 6SD KW10 6SE KW10 6SF KW10 6SG KW10 6TA KW10 6TD KW10 6UG KW10 6YF |
Transport near East Sutherland and Edderton
- FAQ
- Price Paid By Year
Frequently asked questions about East Sutherland and Edderton
What is the average price for a property for sale in East Sutherland and Edderton?
The average price for a property for sale in East Sutherland and Edderton is £184,688. There are 93 property listings for sale in East Sutherland and Edderton.
Which train stations are available in or near East Sutherland and Edderton?
Some of the train stations available in or near East Sutherland and Edderton are Golspie, Dunrobin Castle and Brora.
Property Price Paid in East Sutherland and Edderton by Year
The average sold property price by year was:
| Year | Average Sold Price | Price Change |
Sold Properties
|
|---|---|---|---|
| 2023 | £222,500 | 18% |
2 Properties |
| 2022 | £181,537 | -18% |
24 Properties |
| 2021 | £213,461 | 28% |
23 Properties |
| 2020 | £152,836 | -16% |
30 Properties |
| 2019 | £176,753 | 7% |
33 Properties |
| 2018 | £165,043 | 23% |
23 Properties |
| 2017 | £126,635 | -9% |
24 Properties |
| 2016 | £137,514 | 15% |
29 Properties |
| 2015 | £116,912 | 12% |
22 Properties |
| 2014 | £103,173 | -65% |
15 Properties |
| 2013 | £170,309 | 43% |
16 Properties |
| 2012 | £97,019 | -0,3% |
22 Properties |
| 2011 | £97,273 | -35% |
10 Properties |
| 2010 | £131,358 | 23% |
18 Properties |
| 2009 | £100,651 | -33% |
20 Properties |
| 2008 | £134,061 | 16% |
12 Properties |
| 2007 | £112,486 | -14% |
23 Properties |
| 2006 | £128,781 | 40% |
21 Properties |
| 2005 | £77,357 | 16% |
21 Properties |
| 2004 | £64,809 | -2% |
28 Properties |
| 2003 | £66,183 | 36% |
15 Properties |
| 2002 | £42,500 | -68% |
7 Properties |
| 2001 | £71,285 | -99% |
7 Properties |
| 2000 | £142,067 | - |
1 Property |

