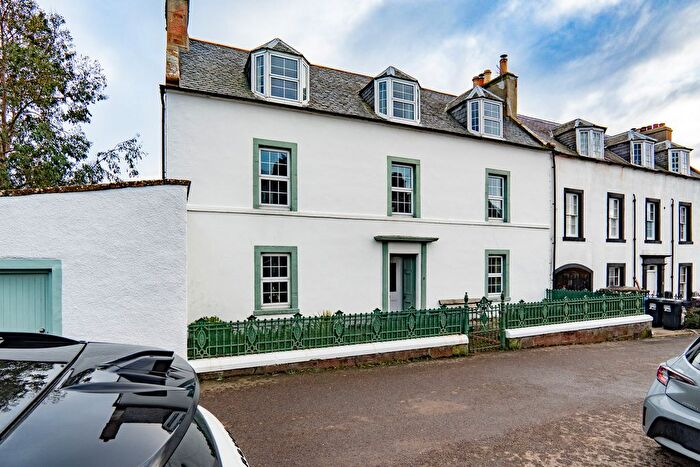
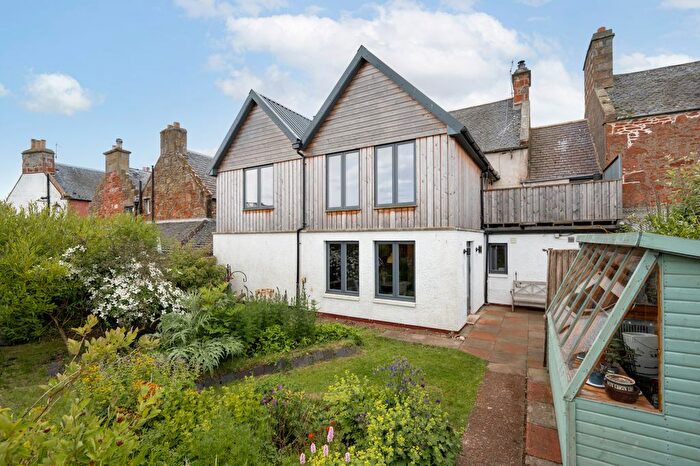
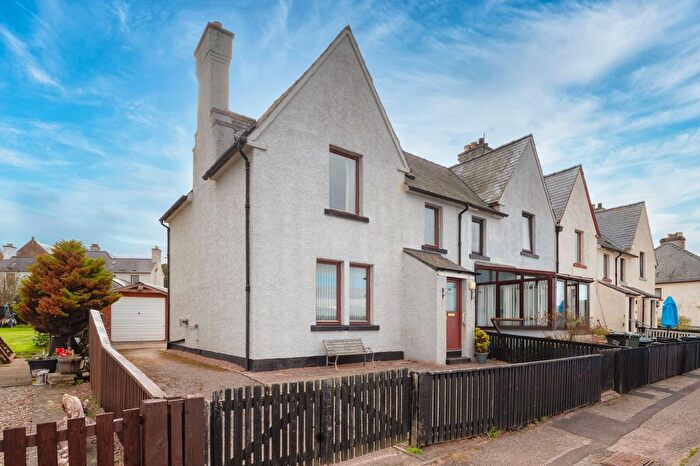
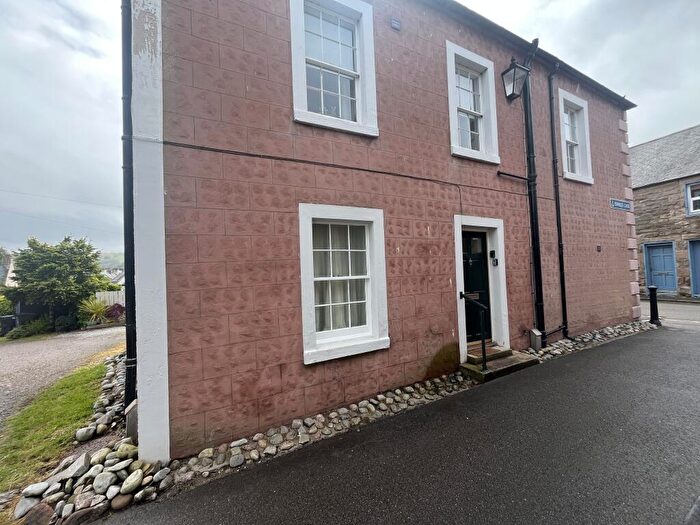
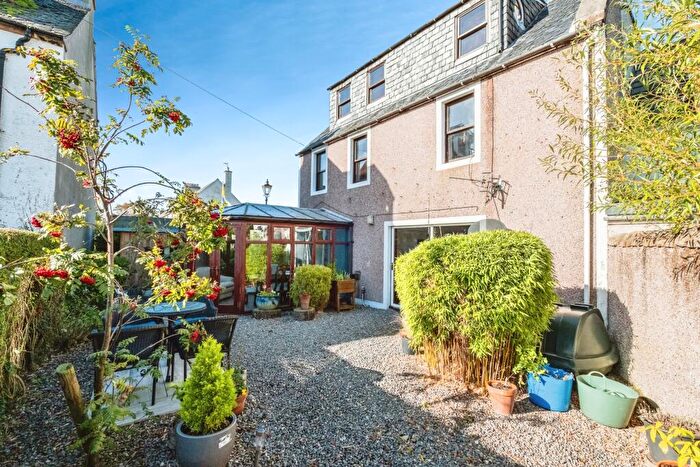
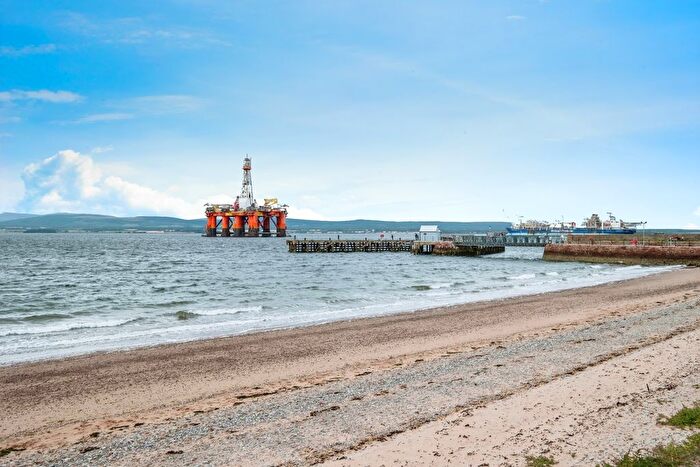
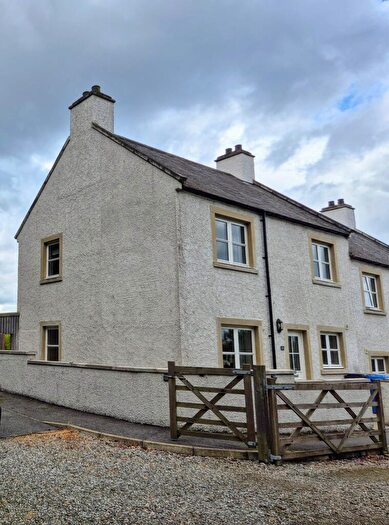
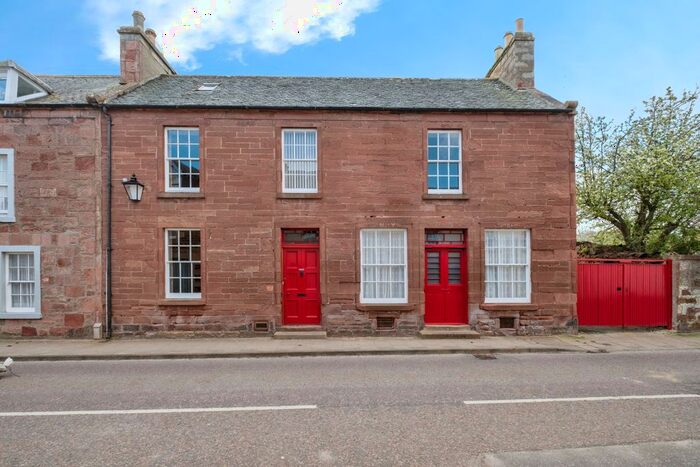
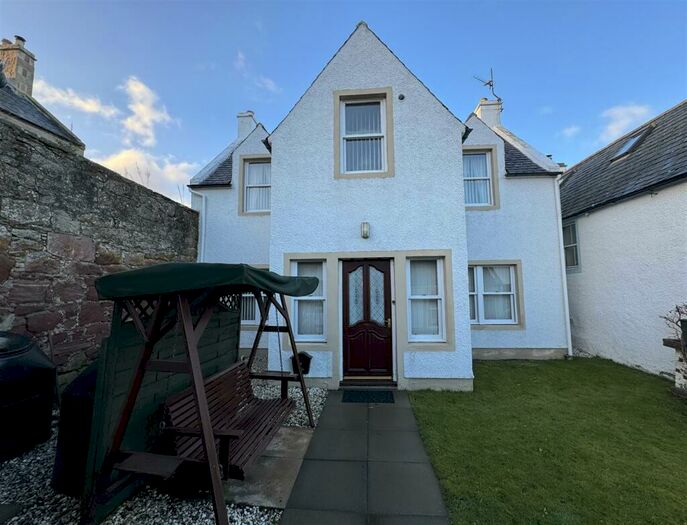
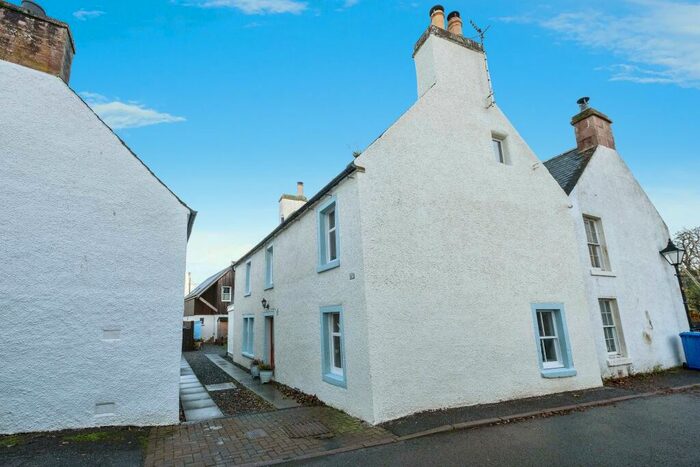
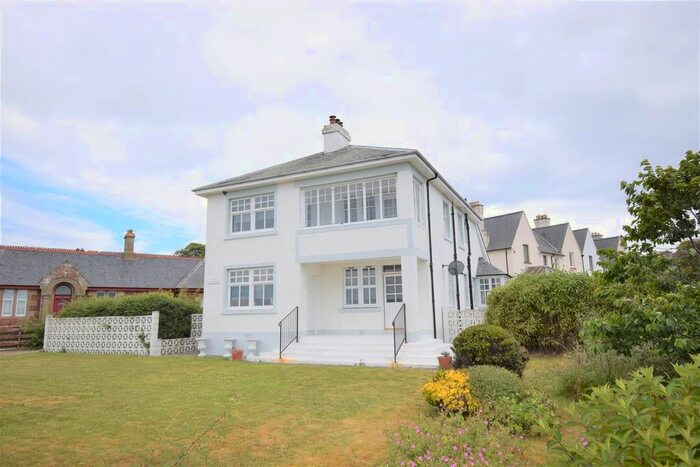
Houses for sale & to rent in Black Isle, Cromarty
House Prices in Black Isle
Properties in Black Isle have an average house price of £246,328.00 and had 16 Property Transactions within the last 3 years¹.
Black Isle is an area in Cromarty, Highland with 399 households², where the most expensive property was sold for £720,000.00.
Properties for sale in Black Isle
Previously listed properties in Black Isle
Roads and Postcodes in Black Isle
Navigate through our locations to find the location of your next house in Black Isle, Cromarty for sale or to rent.
| Streets | Postcodes |
|---|---|
| Allan Square | IV11 8YF |
| Bank Street | IV11 8UY IV11 8YE |
| Barkly Street | IV11 8YG |
| Bayview Crescent | IV11 8YP IV11 8YW |
| Burnside Place | IV11 8XQ |
| Canon Street | IV11 8XD |
| Causeway | IV11 8XJ |
| Church Street | IV11 8XA |
| Denny Road | IV11 8YT |
| Denoon Place | IV11 8YU |
| Duke Street | IV11 8YH |
| Forsyth Place | IV11 8XW |
| George Street | IV11 8YJ |
| Gordons Lane | IV11 8XN |
| High Street | IV11 8UZ IV11 8YR |
| Hospital Road | IV11 8YS |
| Marine Terrace | IV11 8WY IV11 8YA IV11 8YN |
| Miller Lane | IV11 8XB |
| Miller Road | IV11 8XH |
| Nicol Terrace | IV11 8XG |
| Oswald Lane | IV11 8AB |
| Shore Street | IV11 8XL |
| Townlands Park | IV11 8YY IV11 8YZ |
| Urquhart Court | IV11 8YD |
| Whitedykes Industrial Estate | IV11 8YB |
| IV11 8WW IV11 8XE IV11 8XF IV11 8XP IV11 8XR IV11 8XS IV11 8XT IV11 8XU IV11 8XX IV11 8XY IV11 8XZ IV11 8YL IV11 8YQ |
Transport near Black Isle
- FAQ
- Price Paid By Year
Frequently asked questions about Black Isle
What is the average price for a property for sale in Black Isle?
The average price for a property for sale in Black Isle is £246,328. There are 34 property listings for sale in Black Isle.
What streets have the most expensive properties for sale in Black Isle?
The streets with the most expensive properties for sale in Black Isle are High Street at an average of £267,625, Bayview Crescent at an average of £200,000 and Marine Terrace at an average of £147,562.
What streets have the most affordable properties for sale in Black Isle?
The streets with the most affordable properties for sale in Black Isle are Townlands Park at an average of £107,000 and Church Street at an average of £128,500.
Which train stations are available in or near Black Isle?
Some of the train stations available in or near Black Isle are Invergordon, Fearn and Alness.
Property Price Paid in Black Isle by Year
The average sold property price by year was:
| Year | Average Sold Price | Price Change |
Sold Properties
|
|---|---|---|---|
| 2025 | £240,300 | -9% |
5 Properties |
| 2024 | £261,650 | 9% |
5 Properties |
| 2023 | £238,583 | -22% |
6 Properties |
| 2022 | £290,269 | 32% |
13 Properties |
| 2021 | £196,236 | -8% |
15 Properties |
| 2020 | £212,888 | 15% |
9 Properties |
| 2019 | £179,937 | -12% |
12 Properties |
| 2018 | £202,158 | -13% |
6 Properties |
| 2017 | £228,555 | 32% |
9 Properties |
| 2016 | £154,805 | 22% |
14 Properties |
| 2015 | £120,868 | -67% |
11 Properties |
| 2014 | £201,693 | 34% |
16 Properties |
| 2013 | £133,833 | 8% |
9 Properties |
| 2012 | £122,808 | -47% |
5 Properties |
| 2011 | £180,412 | -63% |
13 Properties |
| 2010 | £293,394 | 51% |
13 Properties |
| 2009 | £144,180 | -7% |
13 Properties |
| 2008 | £153,646 | -4% |
11 Properties |
| 2007 | £160,406 | 3% |
16 Properties |
| 2006 | £155,691 | 35% |
17 Properties |
| 2005 | £101,550 | 20% |
25 Properties |
| 2004 | £81,678 | 22% |
26 Properties |
| 2003 | £63,830 | -14% |
14 Properties |
| 2002 | £73,000 | -2% |
3 Properties |
| 2000 | £74,750 | - |
1 Property |

