
Houses for sale & to rent in Inverclyde North, Greenock
House Prices in Inverclyde North
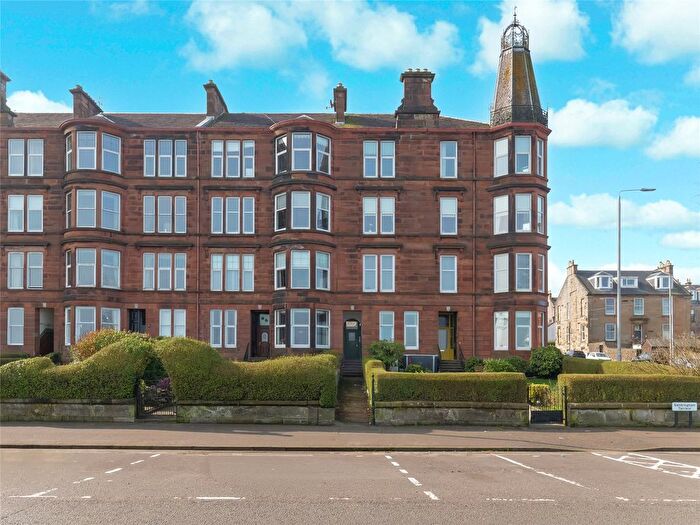
Properties in Inverclyde North have an average house price of £196k and had 228 Property Transactions within the last 3 years¹.
Inverclyde North is an area in Greenock, Inverclyde with 6,849 households², where the most expensive property was sold for £570k.
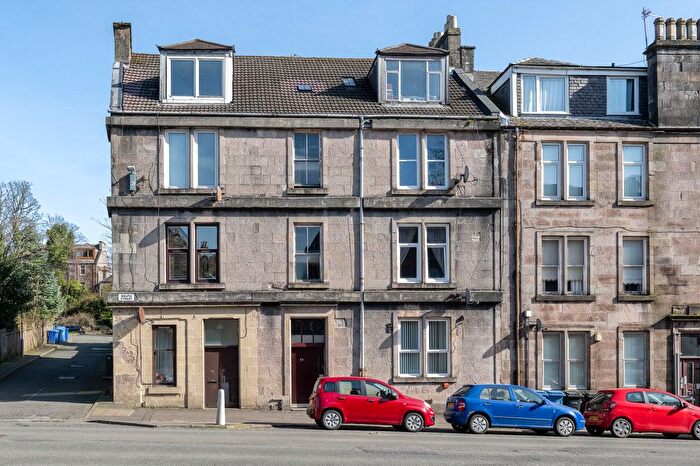
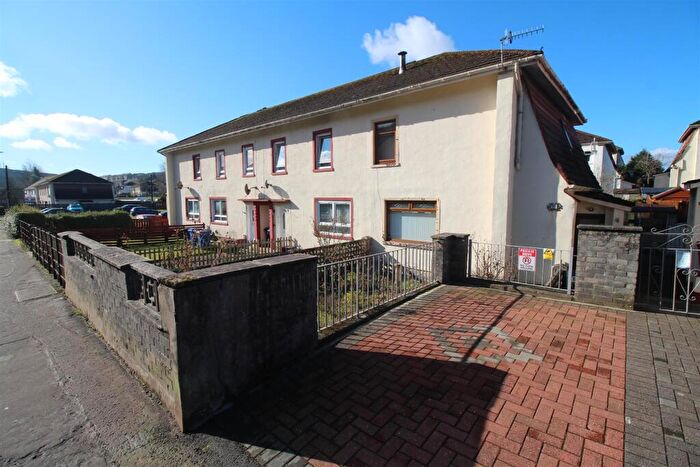
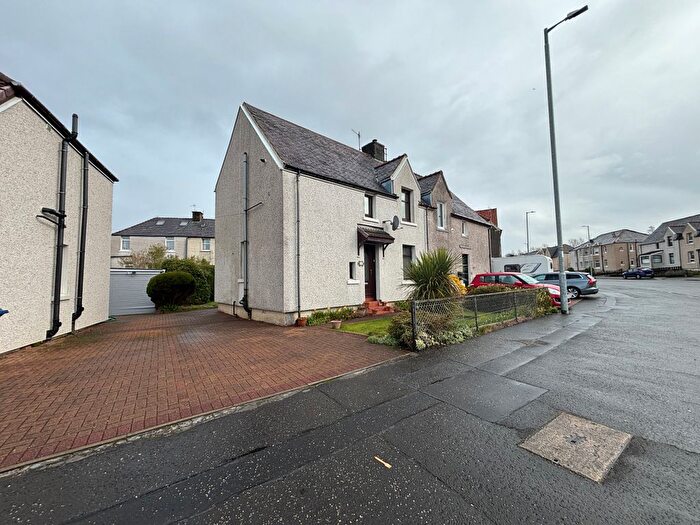
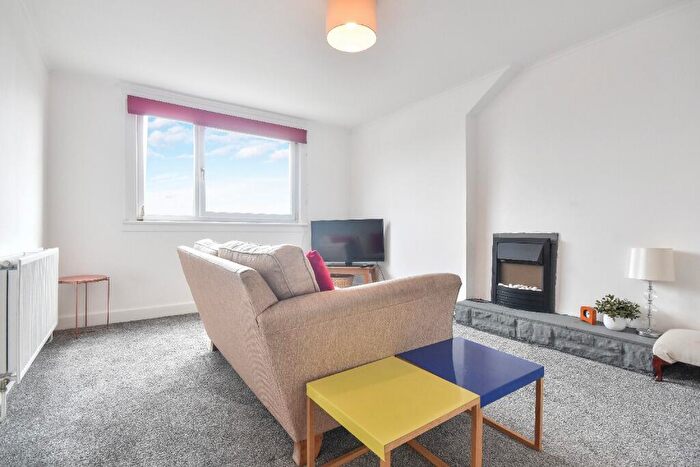
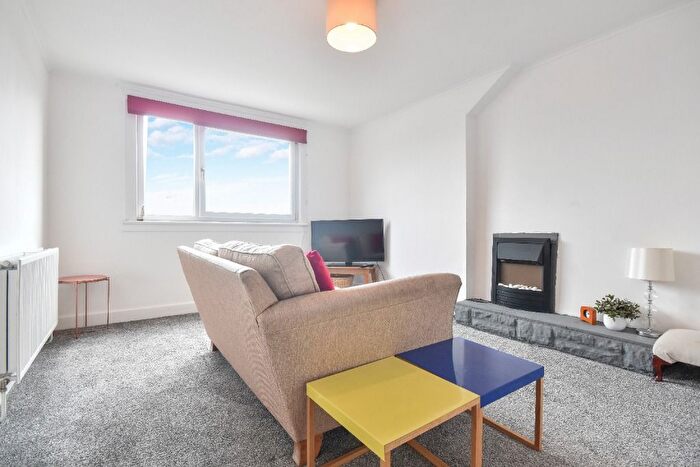
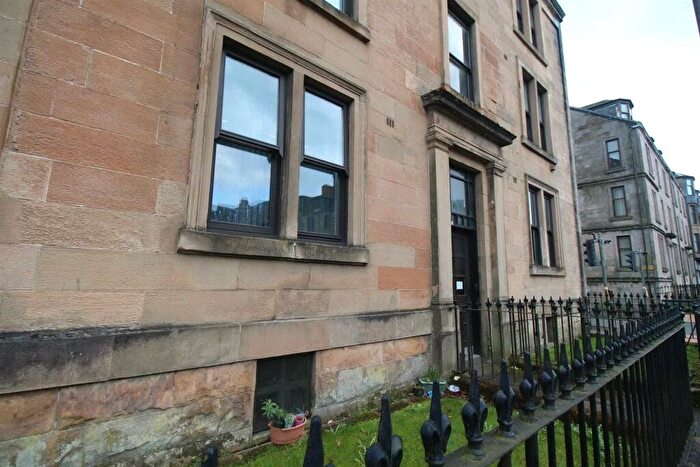
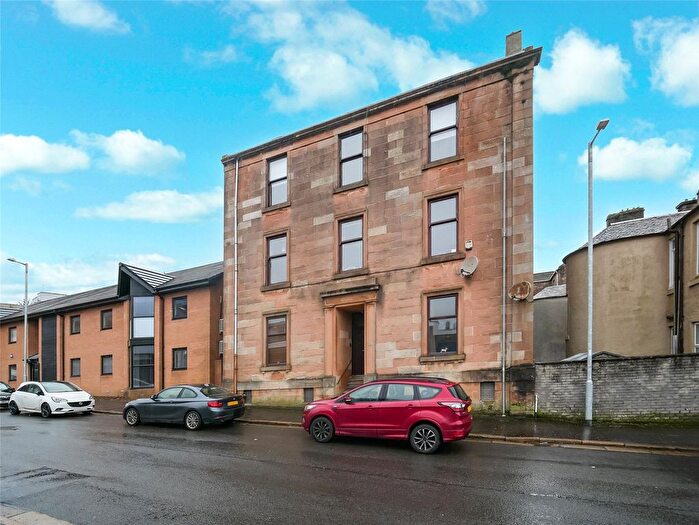
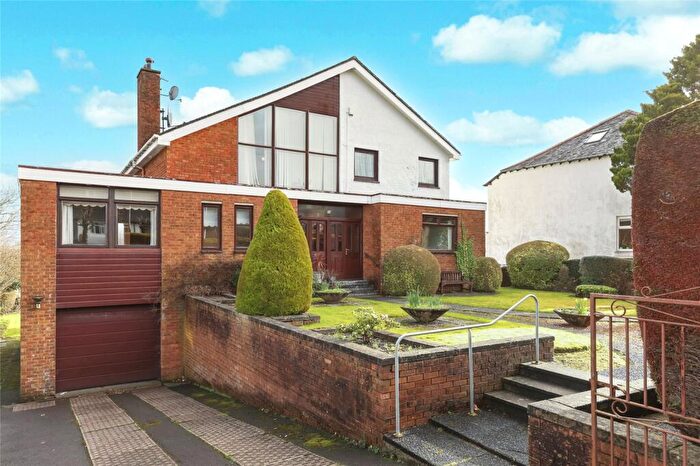
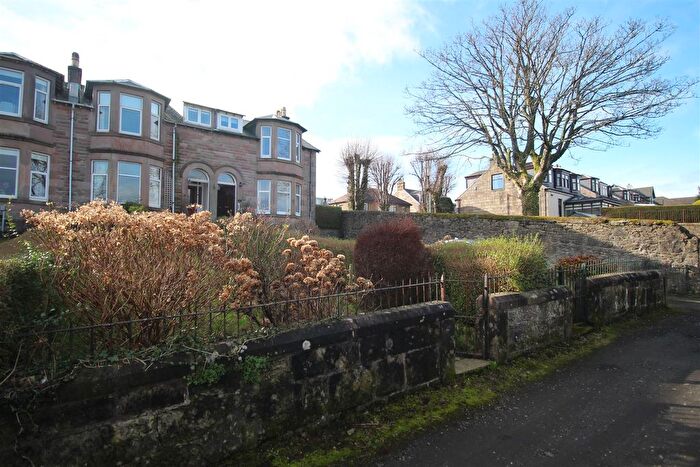
Properties for sale in Inverclyde North

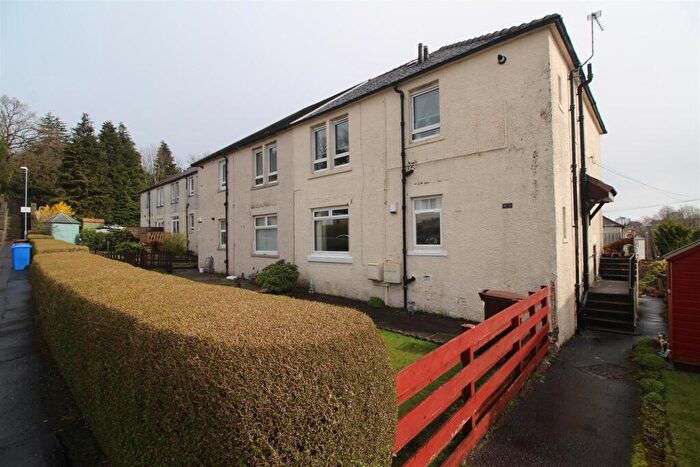
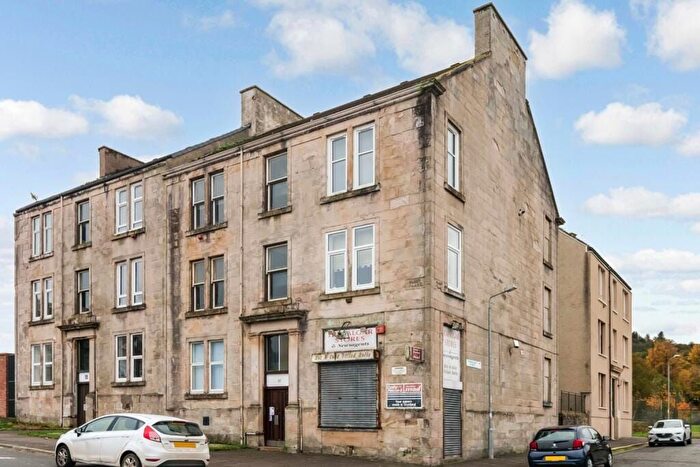
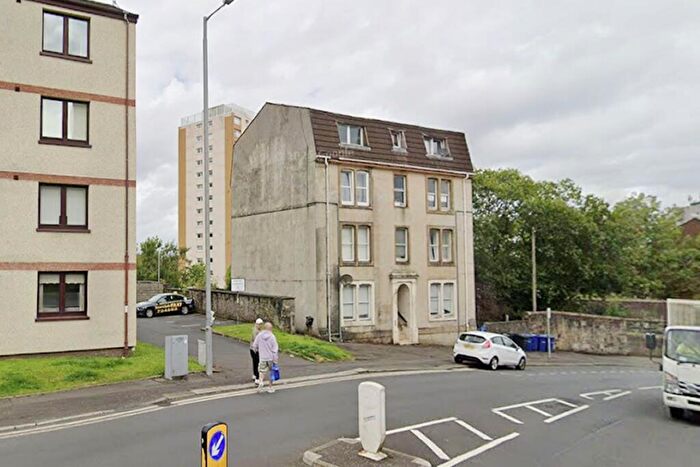
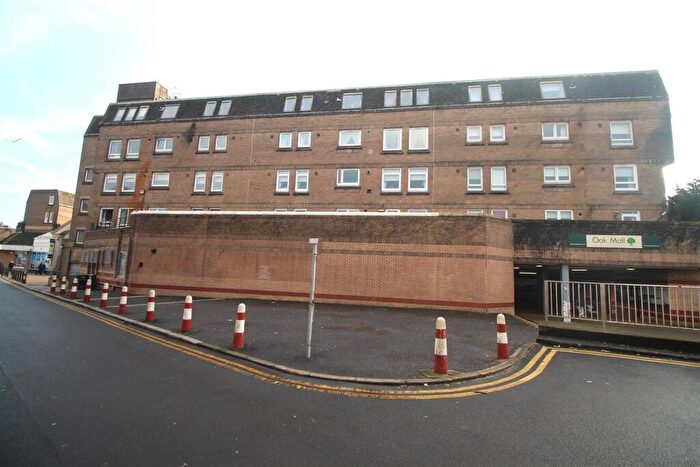
![]()
If you are looking to sell your house, let it out, or receive a property valuation, an expert can help you.
Click the button below to get started.

Roads and Postcodes in Inverclyde North
Navigate through our locations to find the location of your next house in Inverclyde North, Greenock for sale or to rent.
Transport near Inverclyde North
-
 Greenock West Station
 -
Drumfrochar Station
-
Greenock Central Station
-
Fort Matilda Station
-
Whinhill Station
-
Branchton Station
-
Cartsdyke Station
-
Gourock Station
-
Bogston Station
-
IBM Station
- FAQ
- Price Paid By Year
Frequently asked questions about Inverclyde North
What is the average price for a property for sale in Inverclyde North?
The average price for a property for sale in Inverclyde North is £196,396. This amount is 39% higher than the average price in Greenock. There are 1,640 property listings for sale in Inverclyde North.
What streets have the most expensive properties for sale in Inverclyde North?
The streets with the most expensive properties for sale in Inverclyde North are Octavia Terrace at an average of £450,000, Eldon Place at an average of £416,519 and Westfield Drive at an average of £400,000.
What streets have the most affordable properties for sale in Inverclyde North?
The streets with the most affordable properties for sale in Inverclyde North are Grey Place at an average of £34,890, Cathcart Street at an average of £42,831 and West Stewart Street at an average of £46,250.
Which train stations are available in or near Inverclyde North?
Some of the train stations available in or near Inverclyde North are Greenock West, Drumfrochar and Greenock Central.
Property Price Paid in Inverclyde North by Year
The average sold property price by year was:
| Year | Average Sold Price | Price Change |
Sold Properties
|
|---|---|---|---|
| 2025 | £241,021 | 8% |
62 Properties |
| 2024 | £221,810 | 32% |
68 Properties |
| 2023 | £150,530 | 25% |
98 Properties |
| 2022 | £113,447 | -16% |
312 Properties |
| 2021 | £131,592 | 3% |
359 Properties |
| 2020 | £128,217 | 4% |
294 Properties |
| 2019 | £122,602 | -4% |
309 Properties |
| 2018 | £127,657 | 7% |
276 Properties |
| 2017 | £118,409 | 3% |
267 Properties |
| 2016 | £115,020 | -8% |
248 Properties |
| 2015 | £123,909 | 5% |
211 Properties |
| 2014 | £117,226 | -4% |
193 Properties |
| 2013 | £122,001 | 3% |
225 Properties |
| 2012 | £118,779 | 26% |
166 Properties |
| 2011 | £88,027 | -34% |
207 Properties |
| 2010 | £118,330 | -6% |
156 Properties |
| 2009 | £125,368 | -8% |
185 Properties |
| 2008 | £135,542 | 1% |
303 Properties |
| 2007 | £134,792 | -12% |
414 Properties |
| 2006 | £150,611 | 24% |
396 Properties |
| 2005 | £114,919 | 15% |
440 Properties |
| 2004 | £97,277 | 31% |
356 Properties |
| 2003 | £66,698 | -18% |
369 Properties |
| 2002 | £78,713 | 21% |
356 Properties |
| 2001 | £61,924 | - |
21 Properties |