
Houses for sale & to rent in Inverclyde, Scotland
House Prices in Inverclyde
Properties in Inverclyde have
an average house price of
£162k
and had 1,517 Property Transactions
within the last 3 years.¹
Inverclyde is a location in
Scotland with
36,986 households², where the most expensive property was sold for £1.95M.
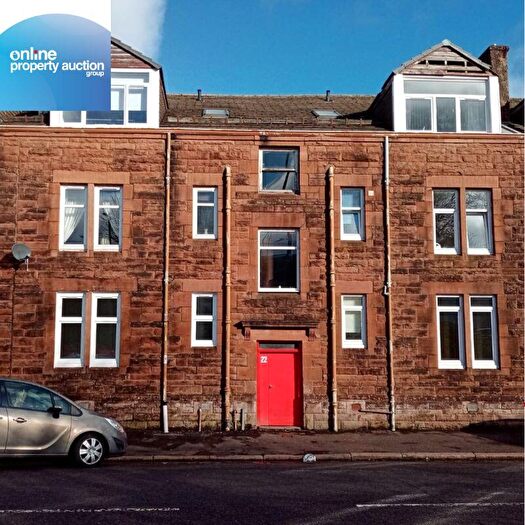
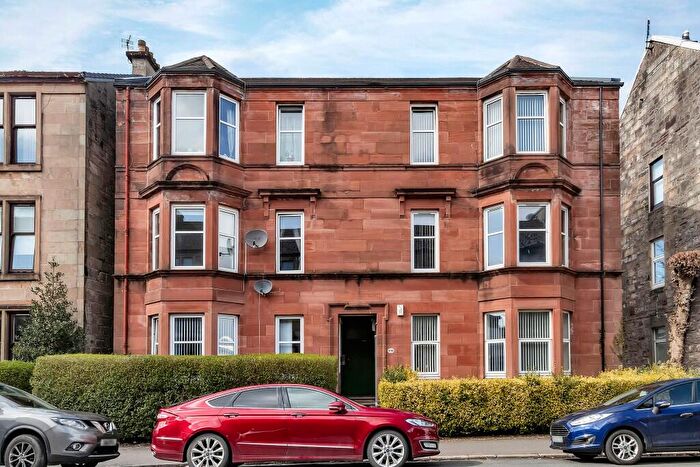
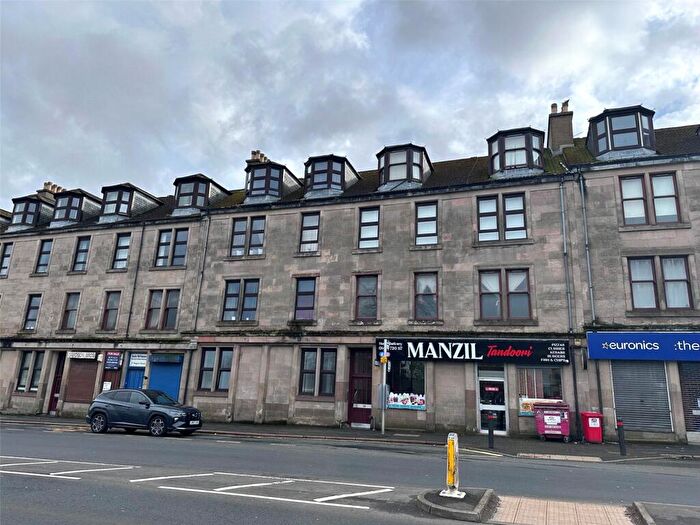
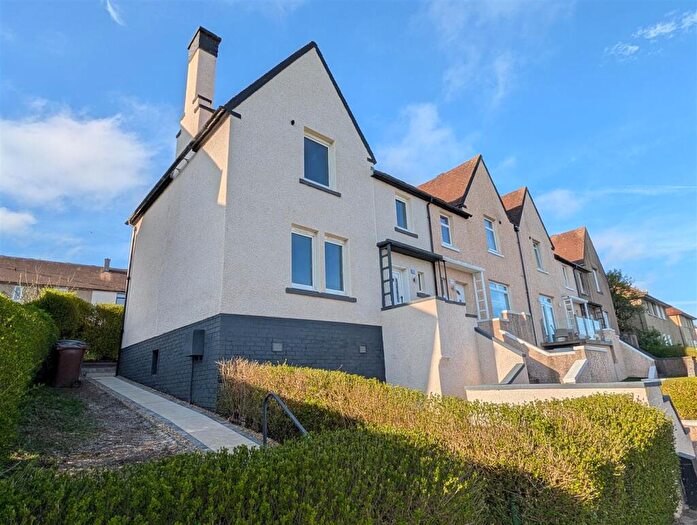
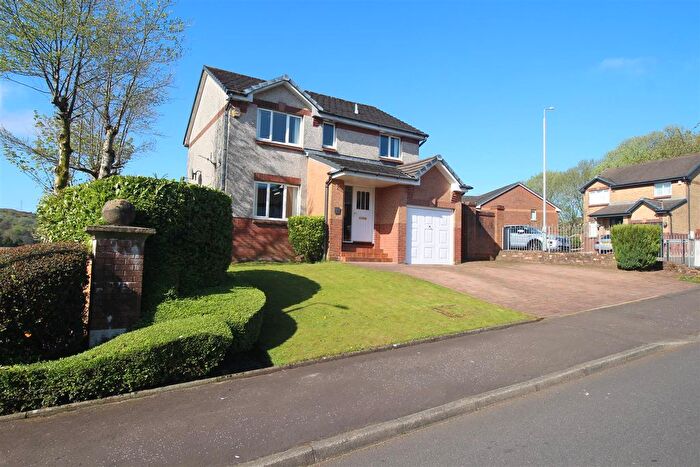
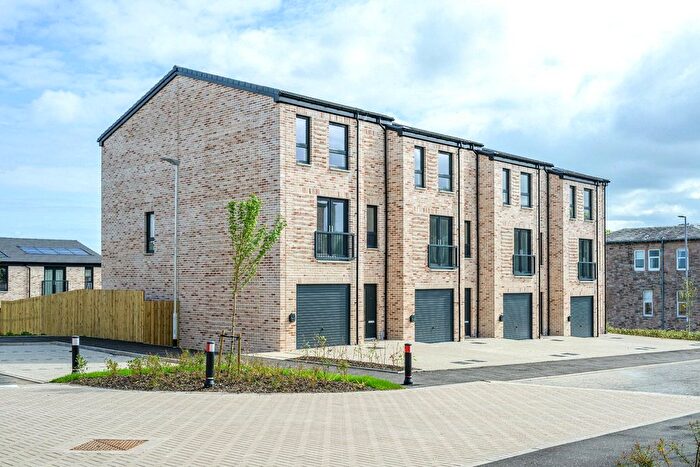
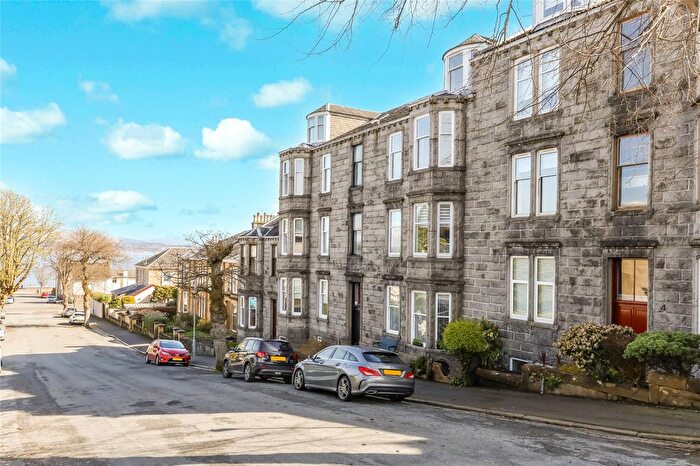
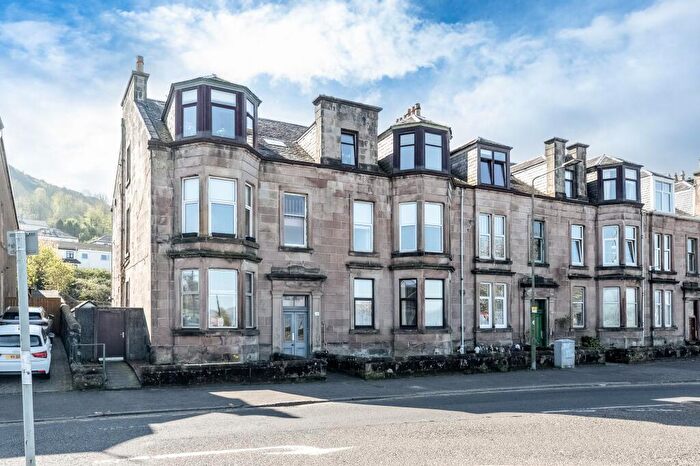
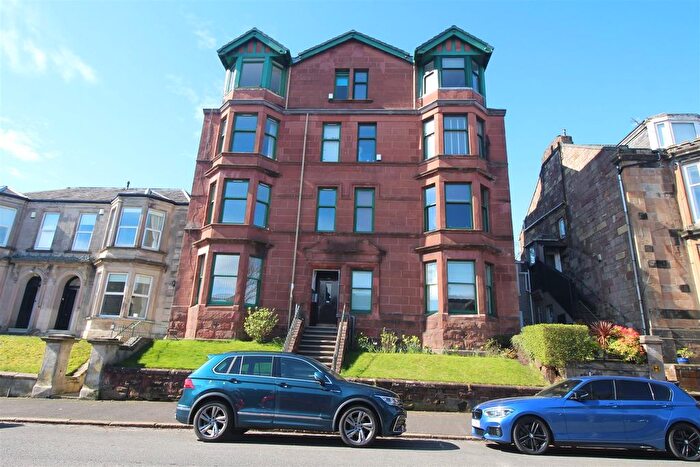
Properties for sale in Inverclyde
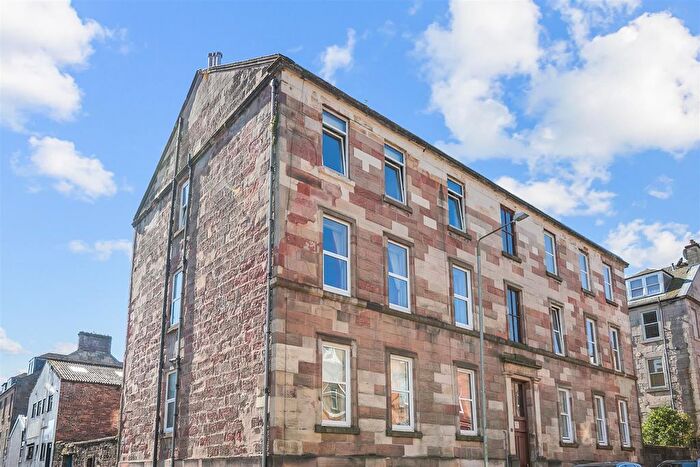
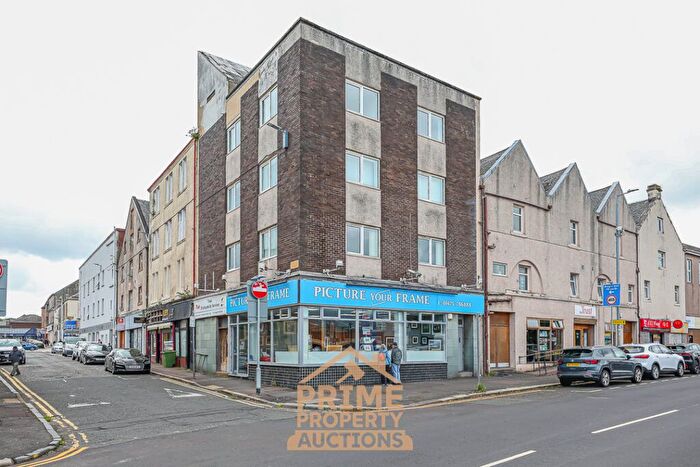
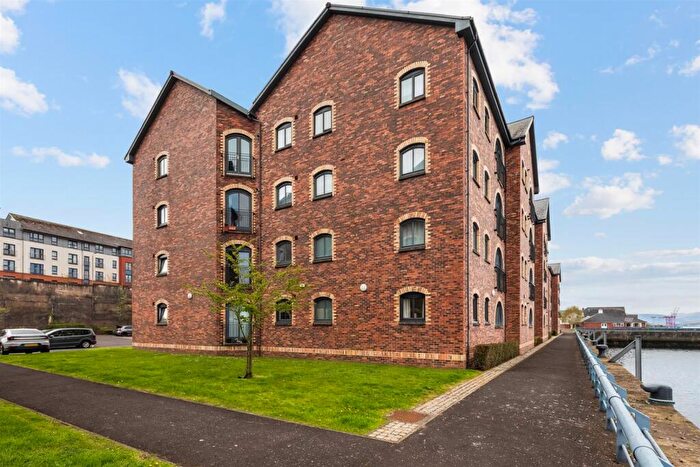
![]()
If you are looking to sell your house, let it out, or receive a property valuation, an expert can help you.
Click the button below to get started.


Towns in Inverclyde
Navigate through our locations to find the location of your next house in Inverclyde, Scotland for sale or to rent.
Transport in Inverclyde
Please see below transportation links in this area:
-
 Whinhill Station
 -
Greenock Central Station
-
Drumfrochar Station
-
Greenock West Station
-
Cartsdyke Station
-
Bogston Station
-
Branchton Station
-
Fort Matilda Station
-
Port Glasgow Station
-
IBM Station
- FAQ
- Price Paid By Year
Frequently asked questions about Inverclyde
What is the average price for a property for sale in Inverclyde?
The average price for a property for sale in Inverclyde is £162,413. This amount is 19% lower than the average price in Scotland. There are 6,046 property listings for sale in Inverclyde.
What locations have the most expensive properties for sale in Inverclyde?
The locations with the most expensive properties for sale in Inverclyde are Bridge Of Weir at an average of £361,312, Kilmacolm at an average of £359,003 and Wemyss Bay at an average of £272,619.
What locations have the most affordable properties for sale in Inverclyde?
The locations with the most affordable properties for sale in Inverclyde are Port Glasgow at an average of £101,495, Greenock at an average of £141,685 and Gourock at an average of £191,024.
Which train stations are available in or near Inverclyde?
Some of the train stations available in or near Inverclyde are Whinhill, Greenock Central and Drumfrochar.
Property Price Paid in Inverclyde by Year
The average sold property price by year was:
| Year | Average Sold Price | Price Change |
Sold Properties
|
|---|---|---|---|
| 2025 | £173,068 | -5% |
485 Properties |
| 2024 | £181,283 | 23% |
435 Properties |
| 2023 | £140,009 | 5% |
597 Properties |
| 2022 | £132,337 | -3% |
1,348 Properties |
| 2021 | £135,925 | 5% |
1,600 Properties |
| 2020 | £129,551 | 6% |
1,246 Properties |
| 2019 | £121,768 | -1% |
1,324 Properties |
| 2018 | £123,134 | 4% |
1,270 Properties |
| 2017 | £118,812 | -4% |
1,272 Properties |
| 2016 | £122,971 | -10% |
1,281 Properties |
| 2015 | £135,438 | 8% |
1,159 Properties |
| 2014 | £124,350 | 5% |
1,086 Properties |
| 2013 | £118,207 | -4% |
1,061 Properties |
| 2012 | £123,254 | 3% |
881 Properties |
| 2011 | £119,461 | -7% |
931 Properties |
| 2010 | £128,126 | 4% |
966 Properties |
| 2009 | £122,441 | -6% |
1,255 Properties |
| 2008 | £130,086 | -30% |
1,683 Properties |
| 2007 | £168,873 | 29% |
2,020 Properties |
| 2006 | £119,339 | -13% |
1,994 Properties |
| 2005 | £134,740 | 30% |
1,910 Properties |
| 2004 | £93,982 | 28% |
1,747 Properties |
| 2003 | £67,604 | 2% |
1,822 Properties |
| 2002 | £66,071 | 11% |
1,906 Properties |
| 2001 | £59,055 | - |
132 Properties |