
Houses for sale in Greenock, Inverclyde
House Prices in Greenock
Properties in Greenock have an average house price of £142k and had 849 Property Transactions within the last 3 years.¹
Greenock is an area in Inverclyde with 21,442 households², where the most expensive property was sold for £570k.
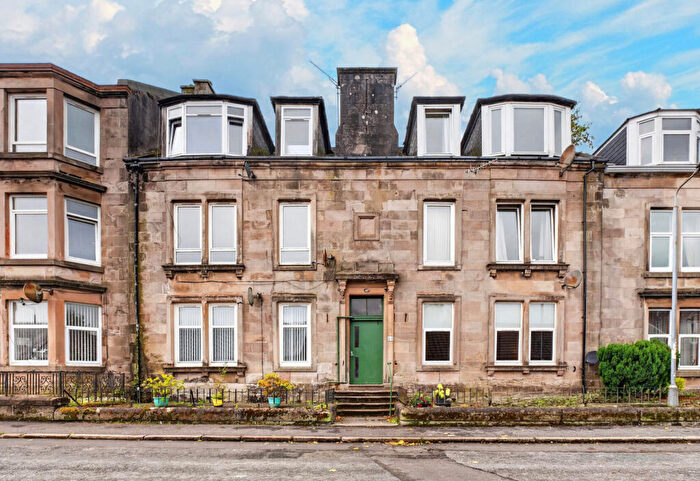
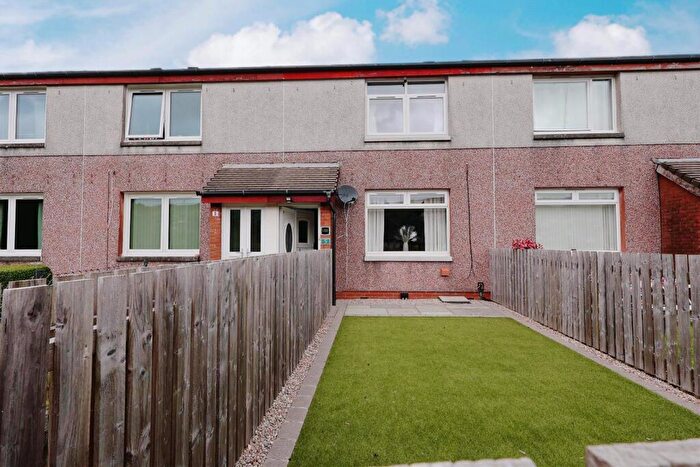
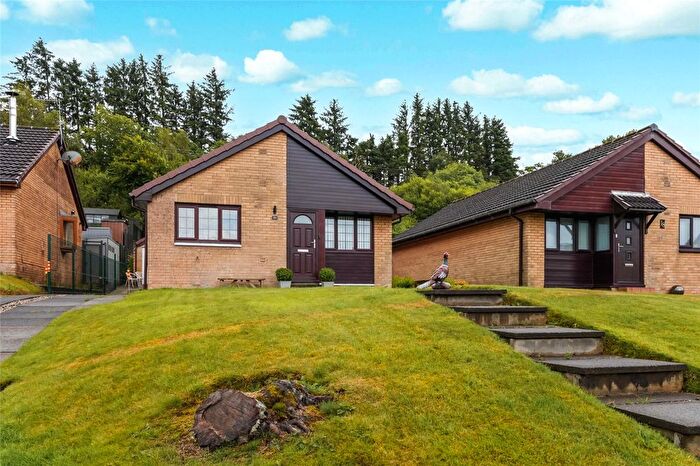
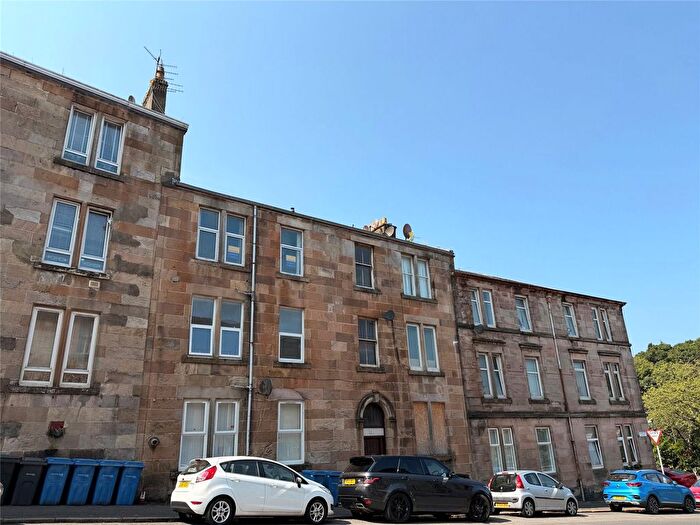
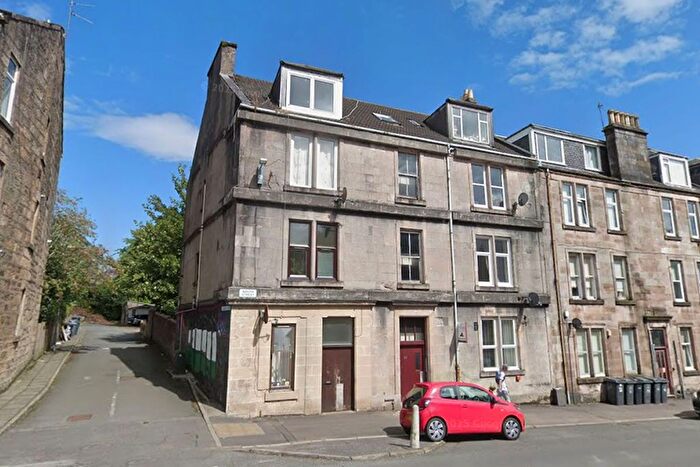
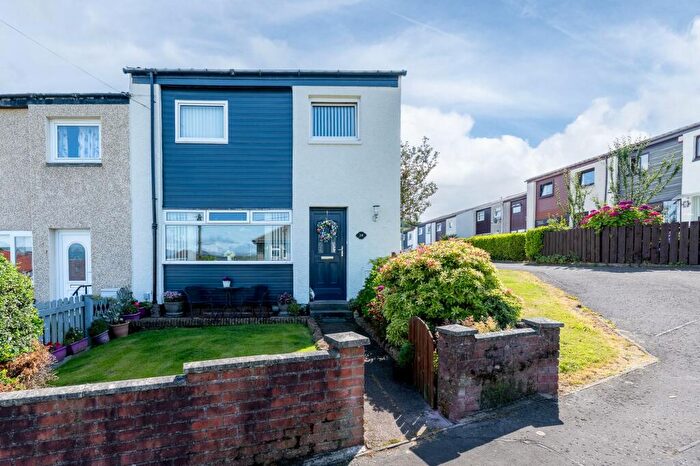
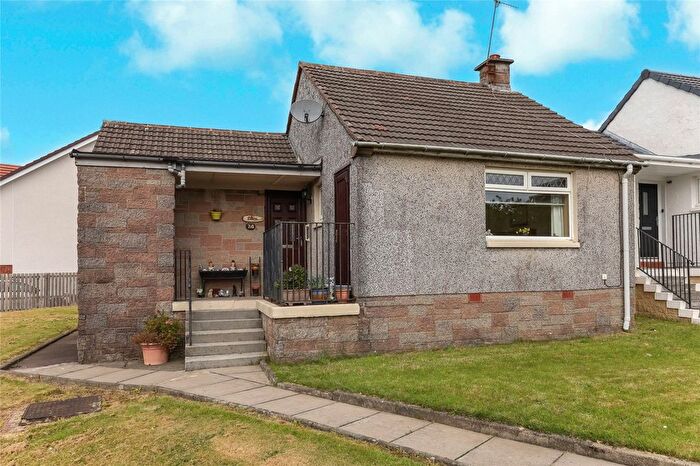
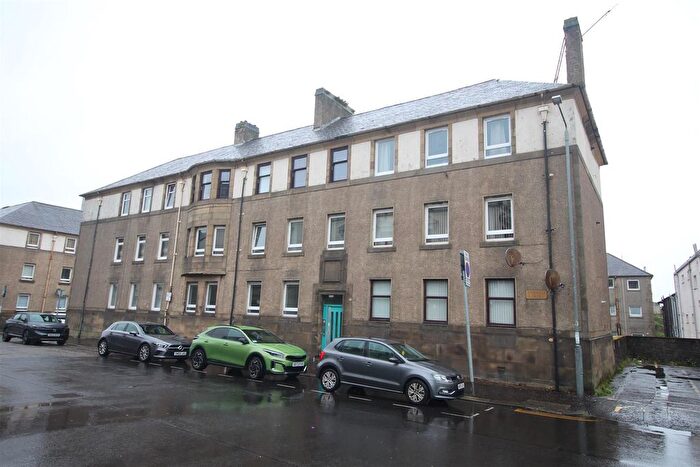
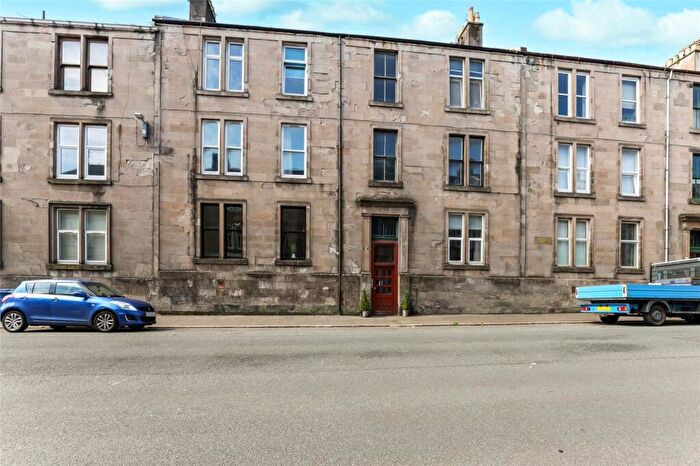
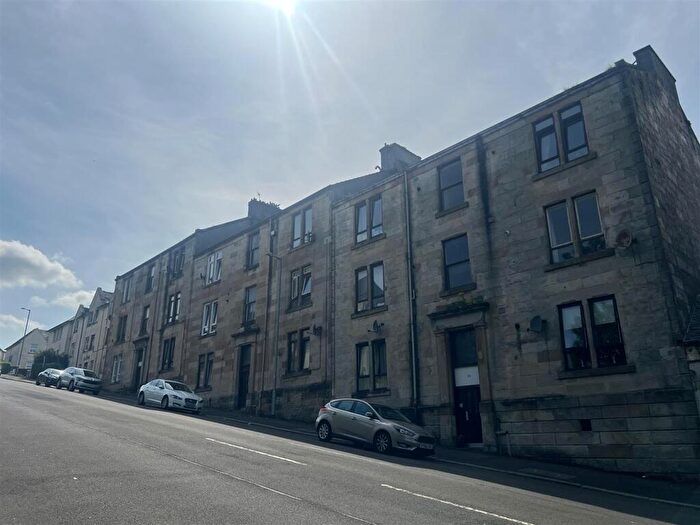
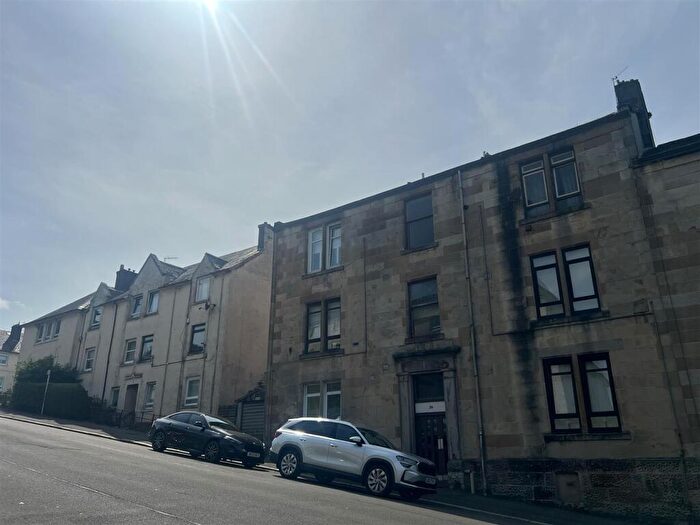
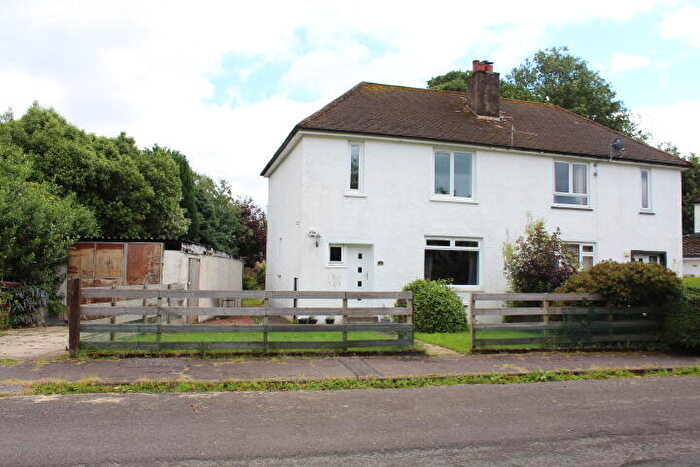
Properties for sale in Greenock
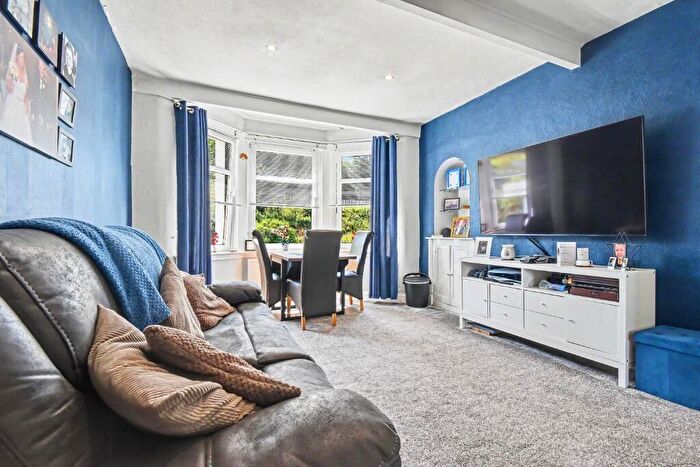
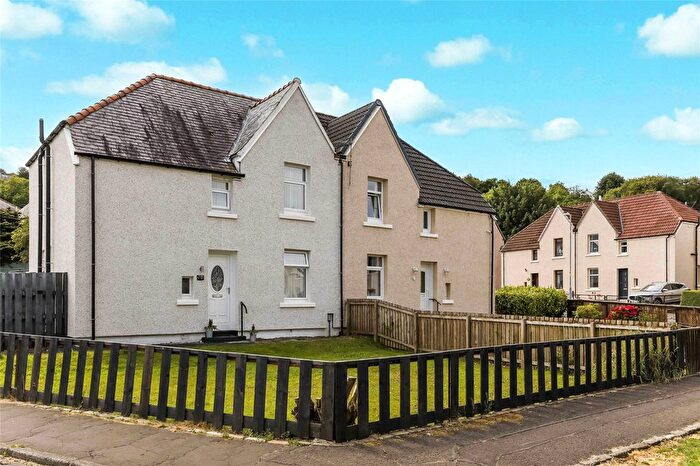
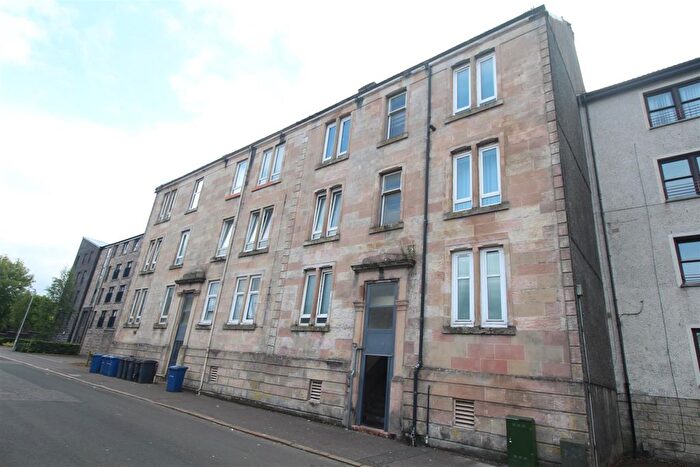
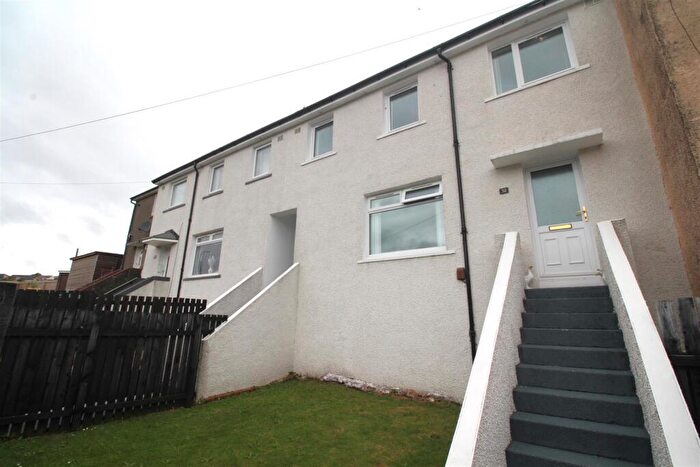
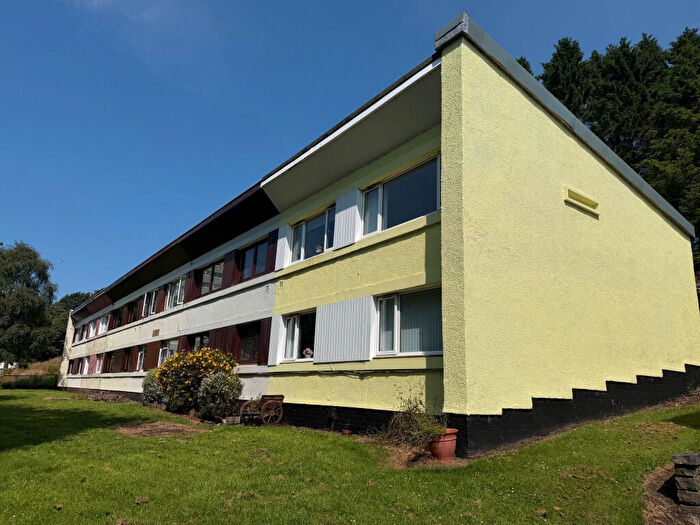
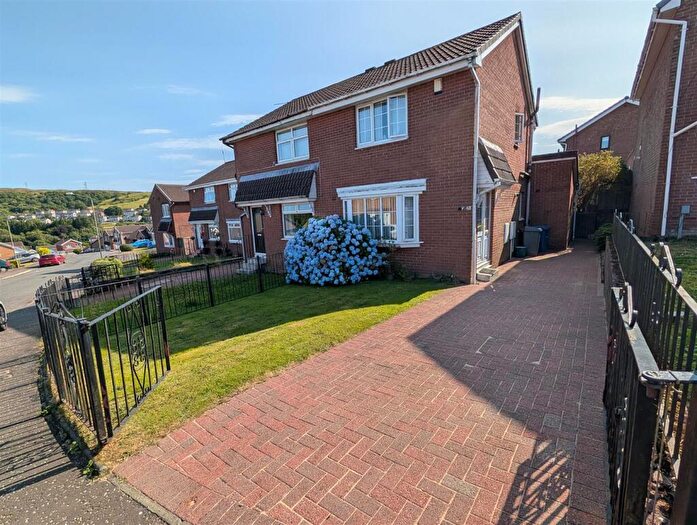
![]()
If you are looking to sell your house, let it out, or receive a property valuation, an expert can help you.
Click the button below to get started.

Neighbourhoods in Greenock
Navigate through our locations to find the location of your next house in Greenock, Inverclyde for sale or to rent.
Property price trends in Greenock
According to the latest Registers of Scotland data, the average home in Greenock sold for £150,555 in 2025. That figure comes from a substantial record of 17,454 sales logged over the past 24 years.
Prices have continued to climb over the last three years. Compared with 2022, when the typical sale came in around £109,090, that's a rise of roughly 38%.
Looking back five years, average prices are up about 32.1% since 2020, a gain of around £36,576 in cash terms.
Zoom out to the past decade for the fuller picture. Back in 2015, homes here averaged £120,623, so the typical sold price has climbed about 24.8% since then, roughly 2.2% a year. Stretch the view to fifteen years and that annual pace eases back to about 1.7%.
Frequently asked questions about Greenock
What is the average price for a property for sale in Greenock?
The average price for a property for sale in Greenock is £141,685. This amount is 13% lower than the average price in Inverclyde. There are 4,834 property listings for sale in Greenock.
What locations have the most expensive properties for sale in Greenock?
The locations with the most expensive properties for sale in Greenock are Inverclyde North at an average of £196,396, Inverclyde South West at an average of £178,927 and Inverclyde East Central at an average of £137,876.
What locations have the most affordable properties for sale in Greenock?
The locations with the most affordable properties for sale in Greenock are Inverclyde Central at an average of £78,511 and Inverclyde South at an average of £99,117.
Which train stations are available in or near Greenock?
Some of the train stations available in or near Greenock are Drumfrochar, Greenock West and Greenock Central.
Property Price Paid in Greenock by Year
The average sold property price by year was:
| Year | Average Sold Price | Price Change |
Sold Properties
|
|---|---|---|---|
| 2025 | £150,555 | 3% |
260 Properties |
| 2024 | £145,963 | 10% |
253 Properties |
| 2023 | £131,600 | 17% |
336 Properties |
| 2022 | £109,090 | -5% |
785 Properties |
| 2021 | £114,026 | - |
881 Properties |
| 2020 | £113,979 | 4% |
726 Properties |
| 2019 | £109,384 | -1% |
727 Properties |
| 2018 | £110,634 | 3% |
695 Properties |
| 2017 | £107,265 | -5% |
697 Properties |
| 2016 | £112,758 | -7% |
679 Properties |
Transport in Greenock
Please see below transportation links in this area:
