
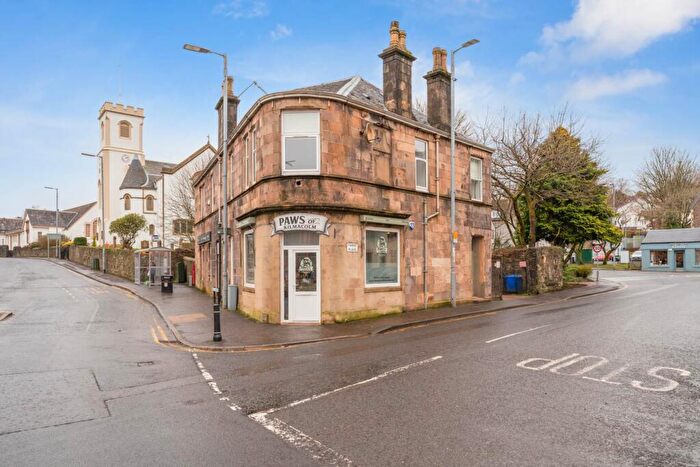
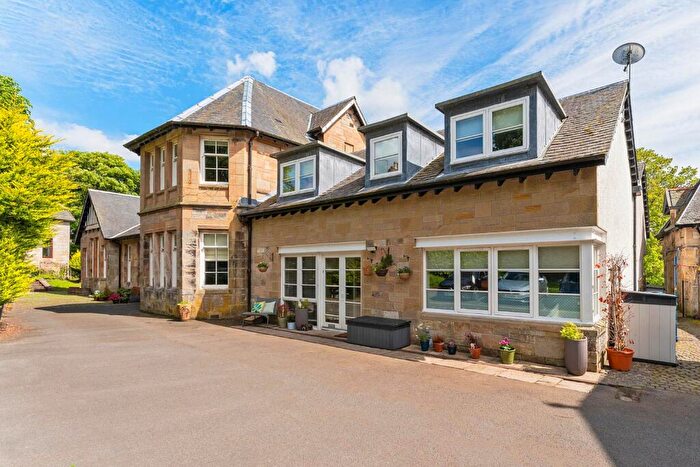
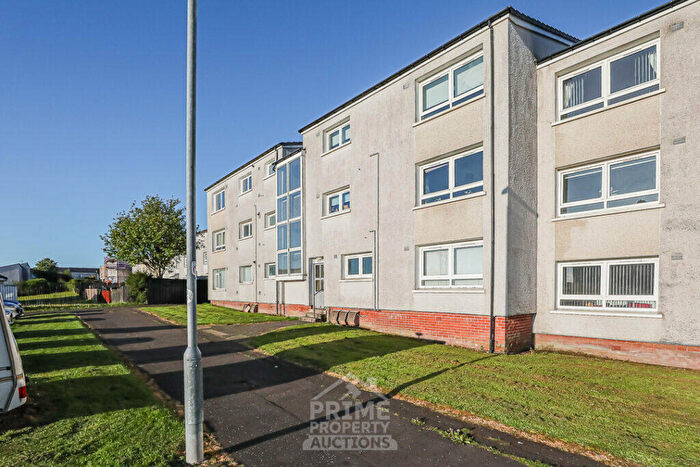
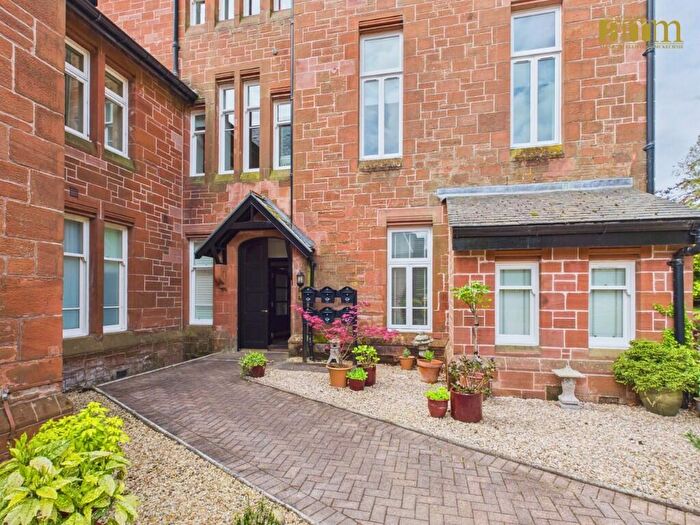
Houses for sale in Kilmacolm, Inverclyde
House Prices in Kilmacolm
Properties in Kilmacolm have an average house price of £359k and had 114 Property Transactions within the last 3 years.¹
Kilmacolm is an area in Inverclyde with 1,977 households², where the most expensive property was sold for £1.95M.
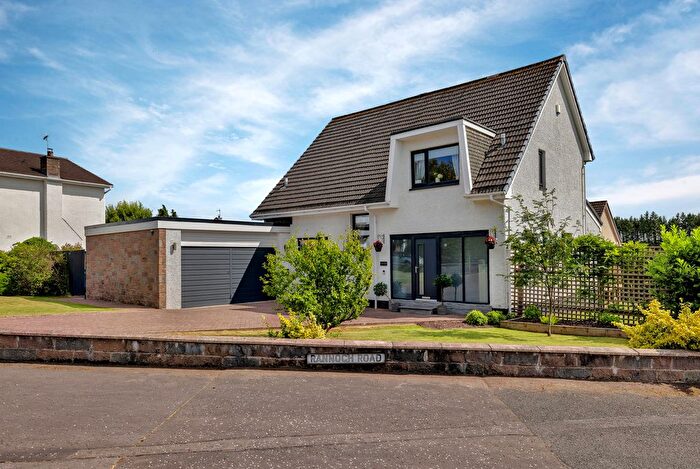
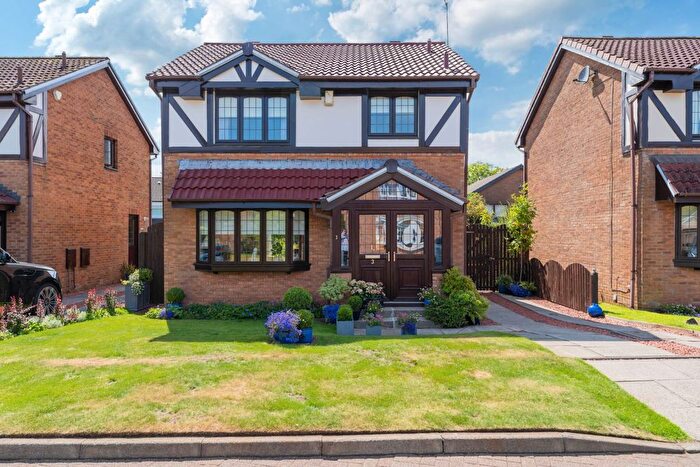
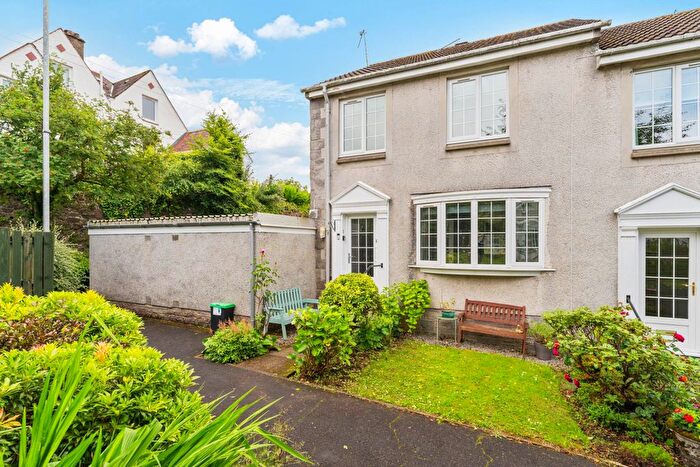
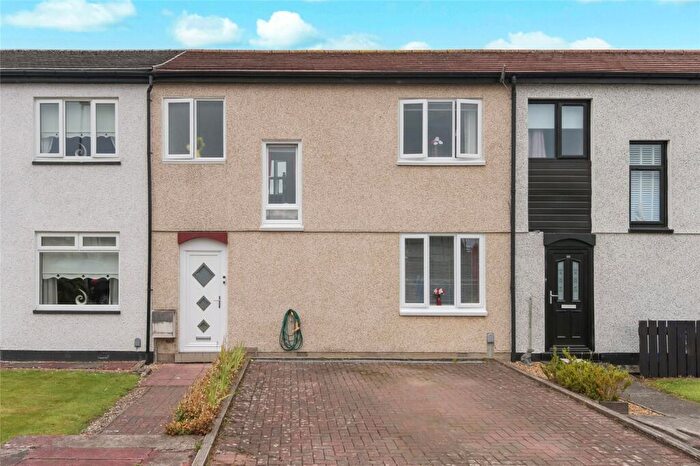
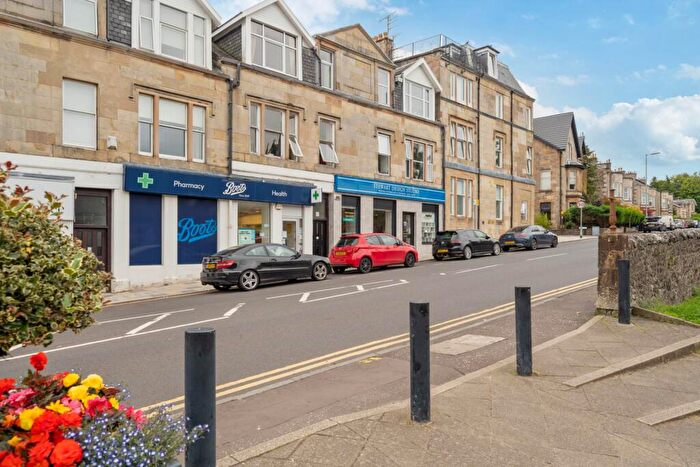
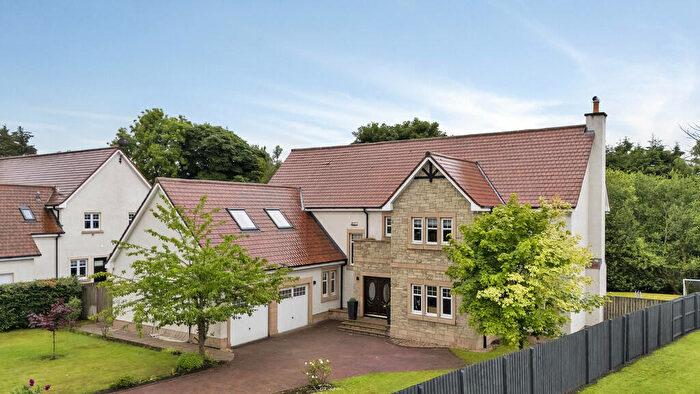
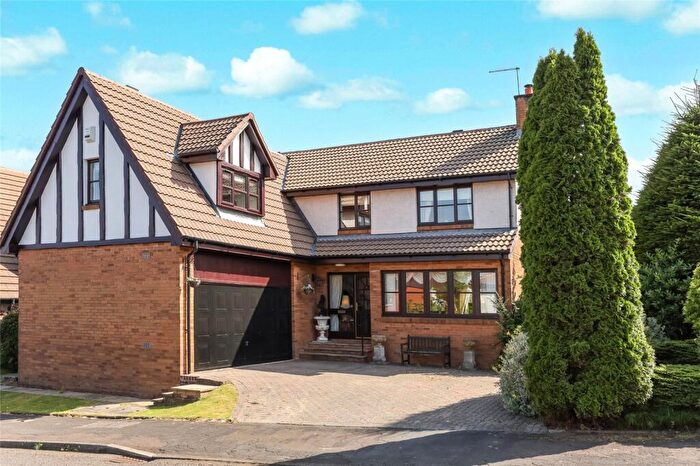
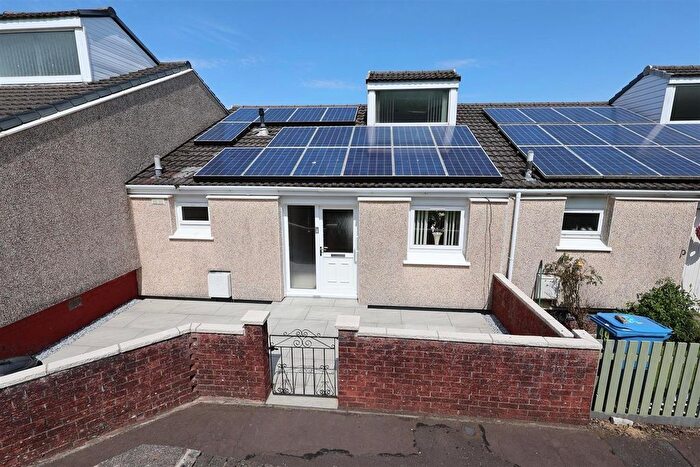
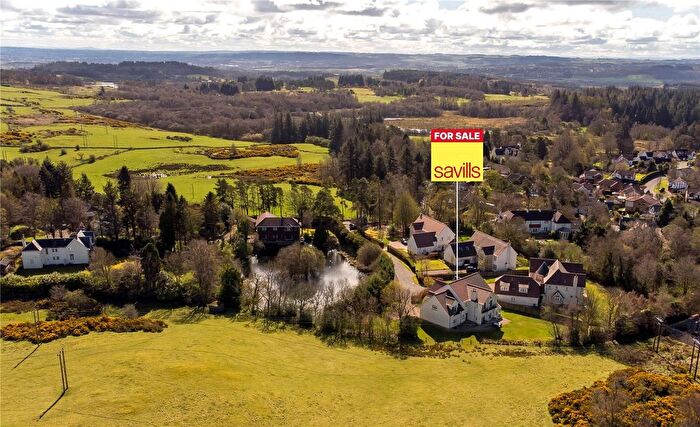
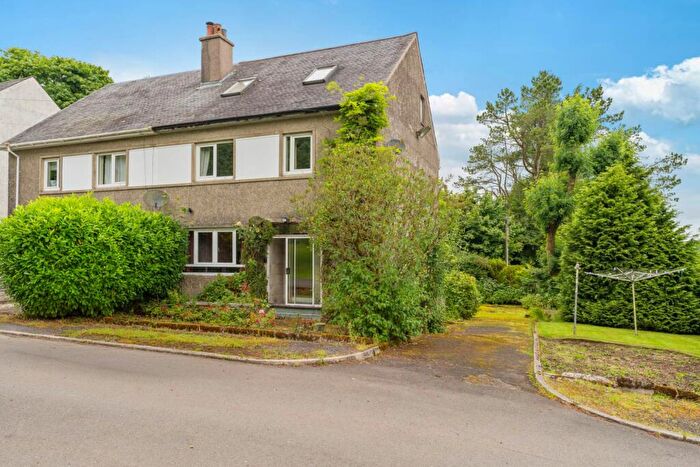
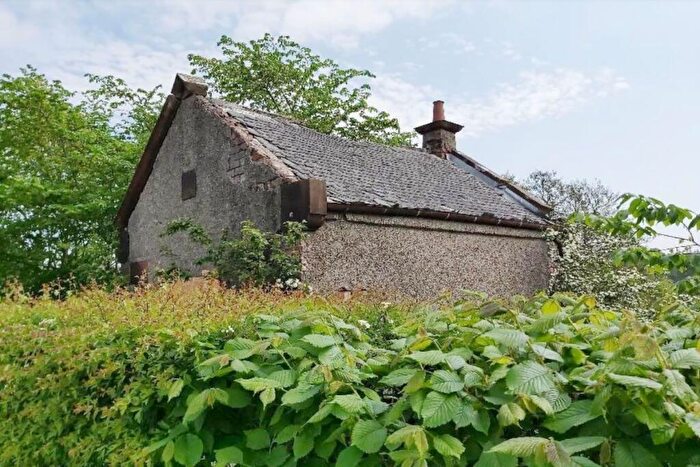
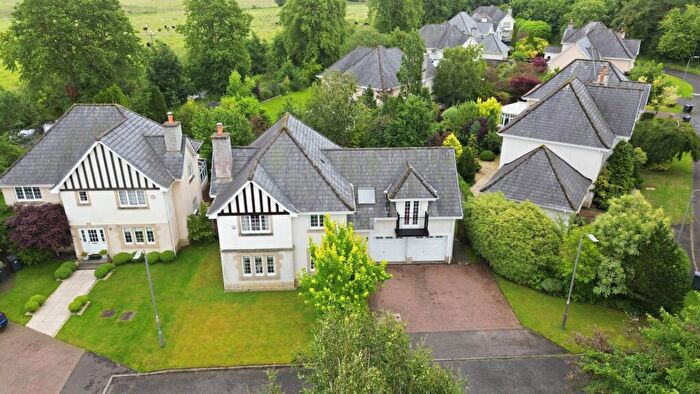
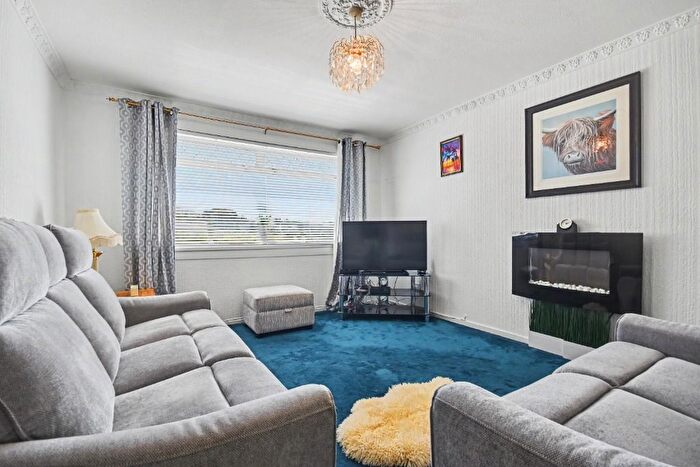
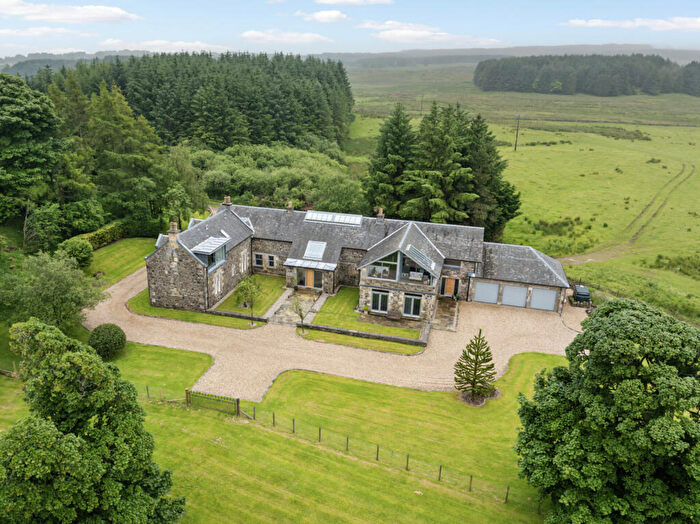
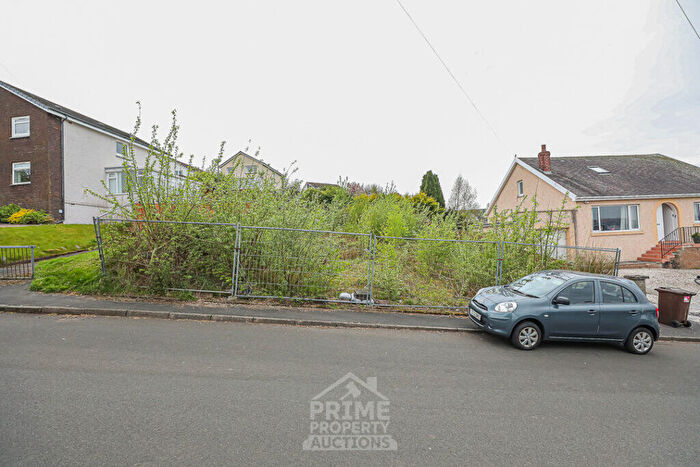
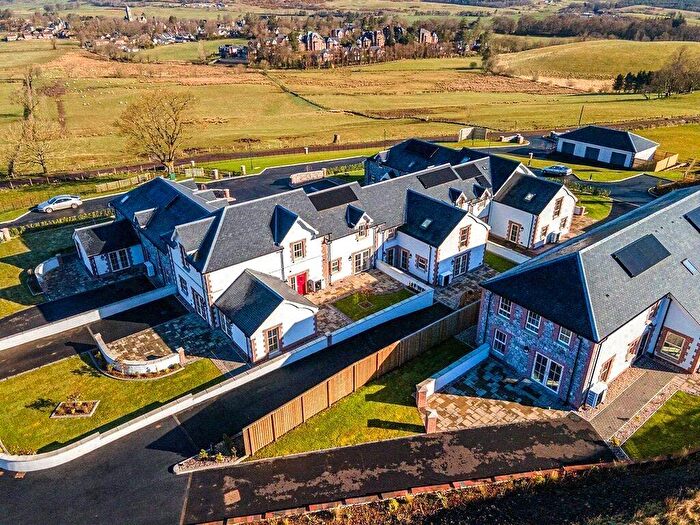
Properties for sale in Kilmacolm

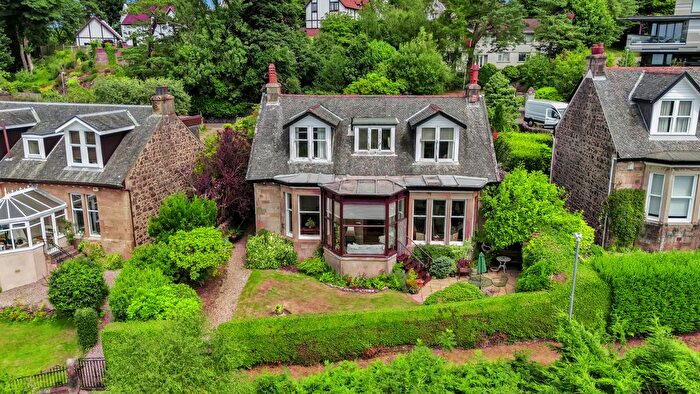
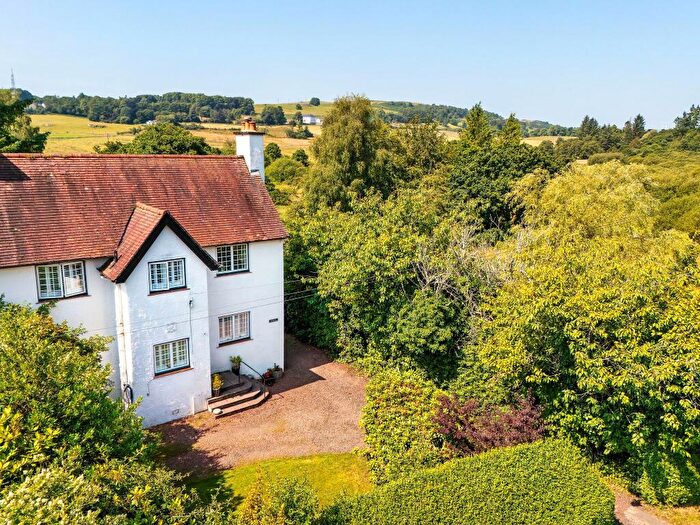
![]()
If you are looking to sell your house, let it out, or receive a property valuation, an expert can help you.
Click the button below to get started.

Neighbourhoods in Kilmacolm
Navigate through our locations to find the location of your next house in Kilmacolm, Inverclyde for sale or to rent.
Property price trends in Kilmacolm
According to the latest Registers of Scotland data, the average home in Kilmacolm sold for £348,422 in 2025. That figure comes from 2,204 sales logged over the past 24 years.
Prices have continued to climb over the last three years. Compared with 2022, when the typical sale came in around £311,147, that's a rise of roughly 12%.
Looking back five years, average prices are up about 38.2% since 2020, a gain of around £96,228 in cash terms.
Zoom out to the past decade for the fuller picture. Back in 2015, homes here averaged £300,122, so the typical sold price has climbed about 16.1% since then, roughly 1.5% a year. Stretch the view to fifteen years and that annual pace edges up closer to 2.1%.
Frequently asked questions about Kilmacolm
What is the average price for a property for sale in Kilmacolm?
The average price for a property for sale in Kilmacolm is £359,003. This amount is 120% higher than the average price in Inverclyde. There are 916 property listings for sale in Kilmacolm.
Which train stations are available in or near Kilmacolm?
Some of the train stations available in or near Kilmacolm are Woodhall, Langbank and Port Glasgow.
Property Price Paid in Kilmacolm by Year
The average sold property price by year was:
| Year | Average Sold Price | Price Change |
Sold Properties
|
|---|---|---|---|
| 2025 | £348,422 | -23% |
38 Properties |
| 2024 | £427,111 | 35% |
44 Properties |
| 2023 | £277,921 | -12% |
32 Properties |
| 2022 | £311,147 | 1% |
77 Properties |
| 2021 | £307,316 | 18% |
123 Properties |
| 2020 | £252,194 | 16% |
96 Properties |
| 2019 | £210,845 | -6% |
90 Properties |
| 2018 | £222,682 | -0,5% |
99 Properties |
| 2017 | £223,754 | -1% |
83 Properties |
| 2016 | £225,867 | -33% |
104 Properties |
Transport in Kilmacolm
Please see below transportation links in this area:
