
Houses for sale & to rent in Port Glasgow, Inverclyde
House Prices in Port Glasgow
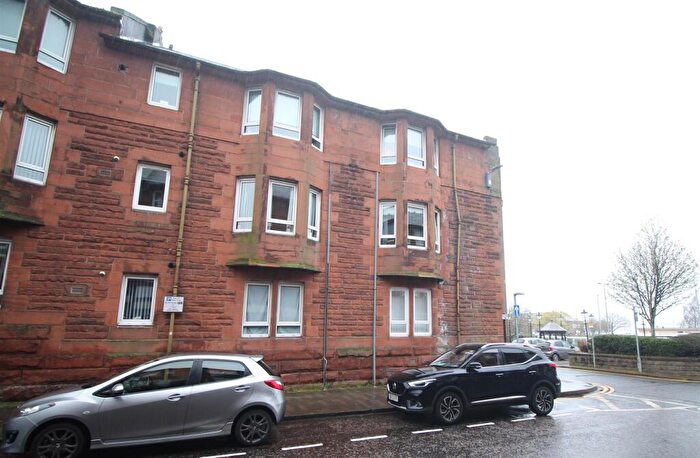
Properties in Port Glasgow have an average house price of £101k and had 277 Property Transactions within the last 3 years.¹
Port Glasgow is an area in Inverclyde with 6,849 households², where the most expensive property was sold for £380k.
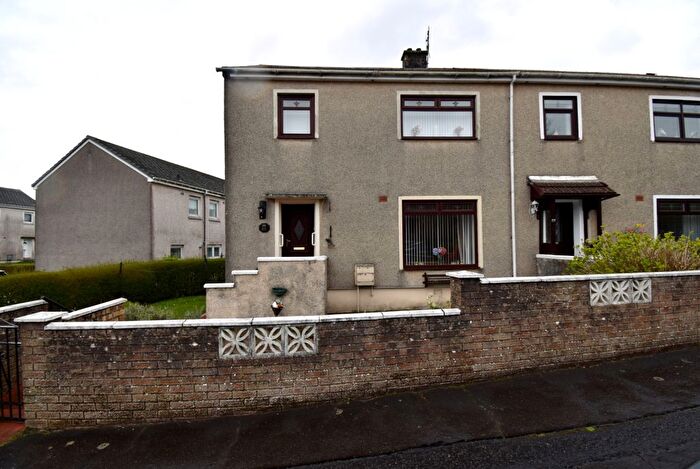
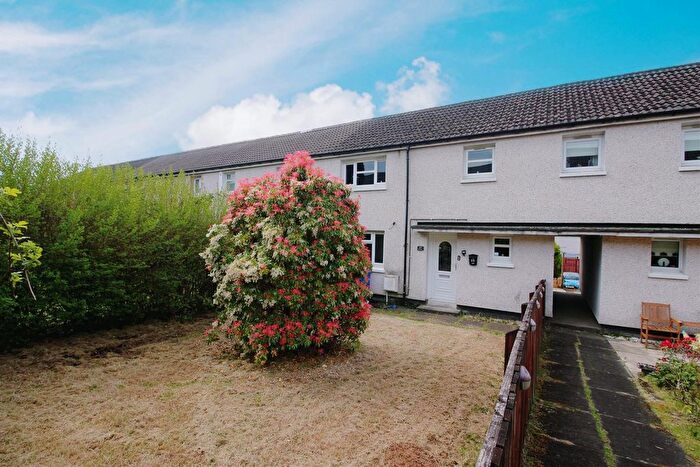
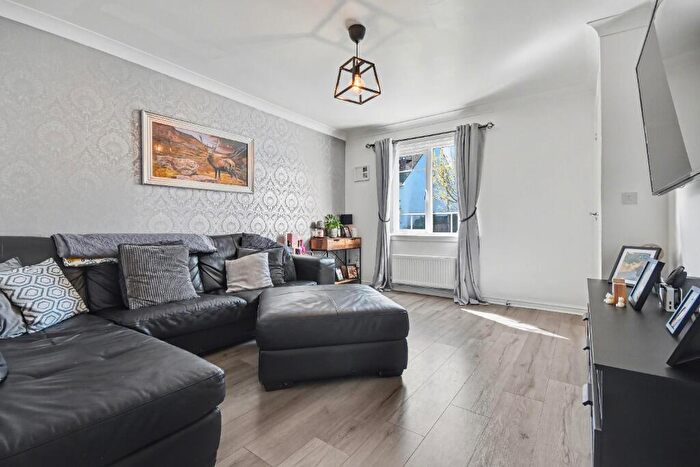
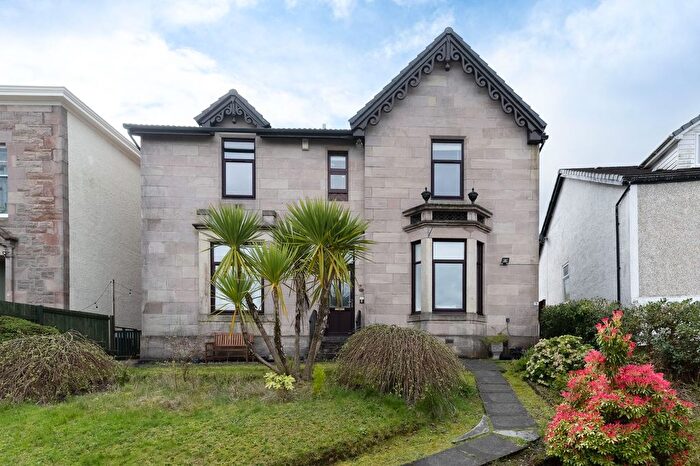
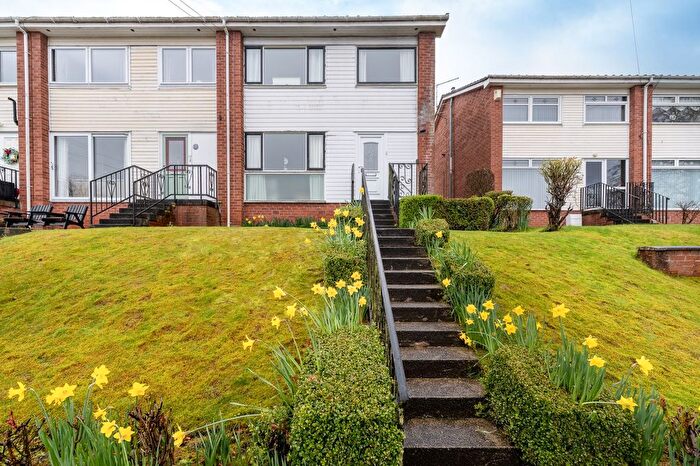
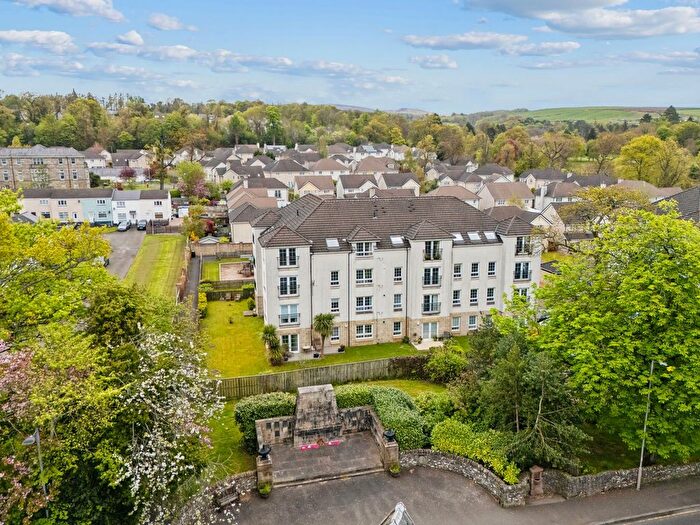
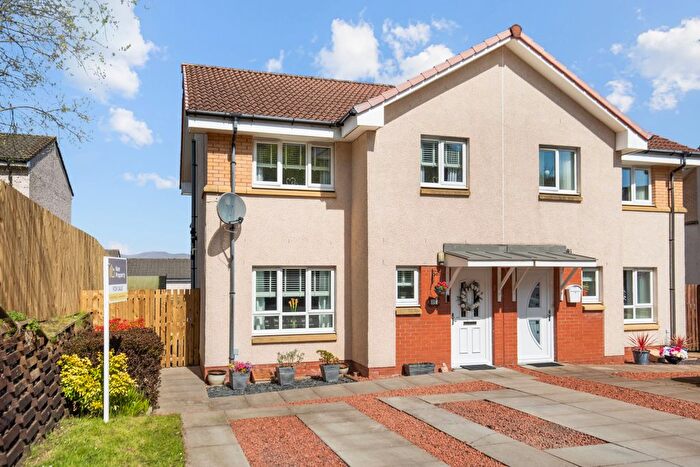
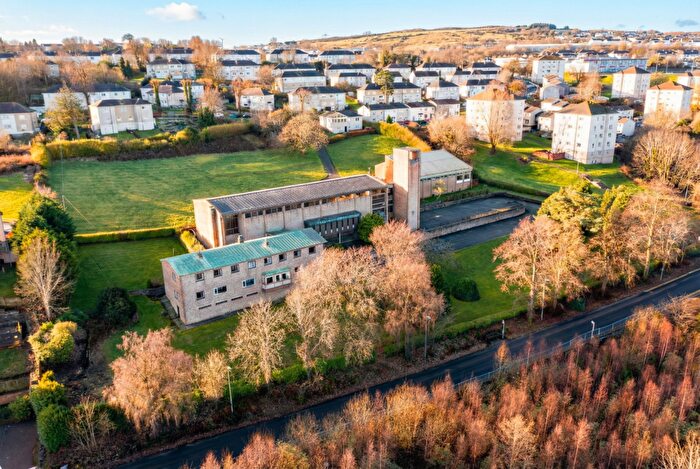
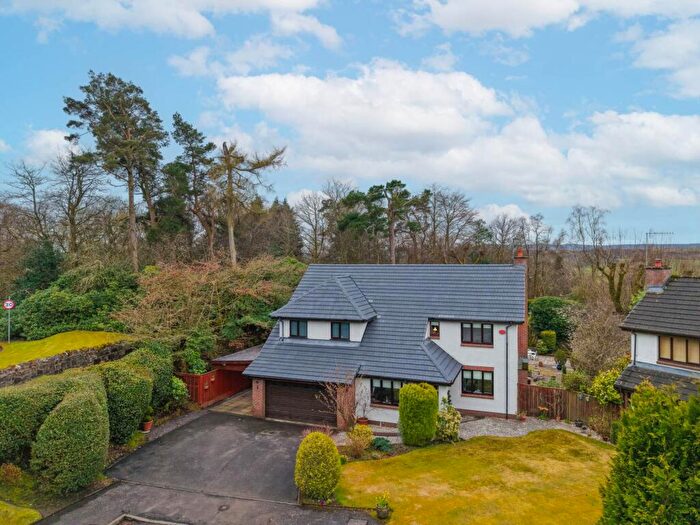
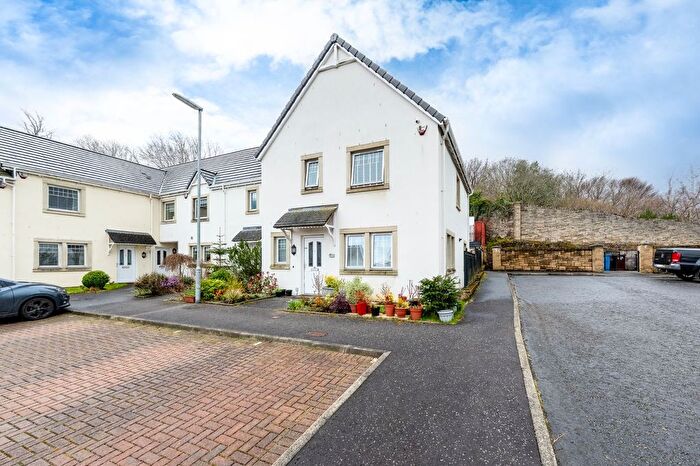
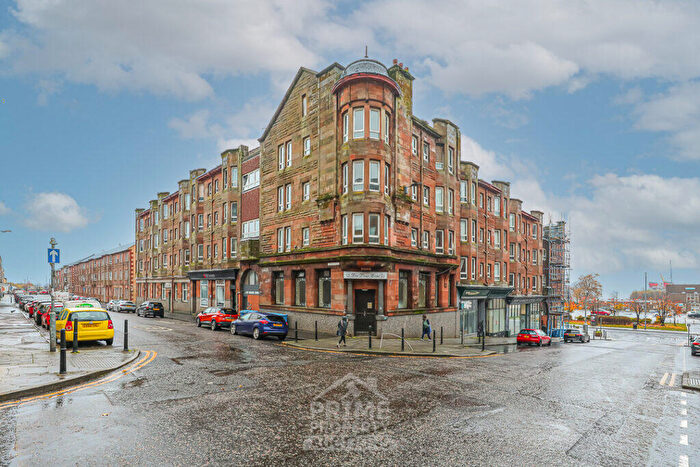
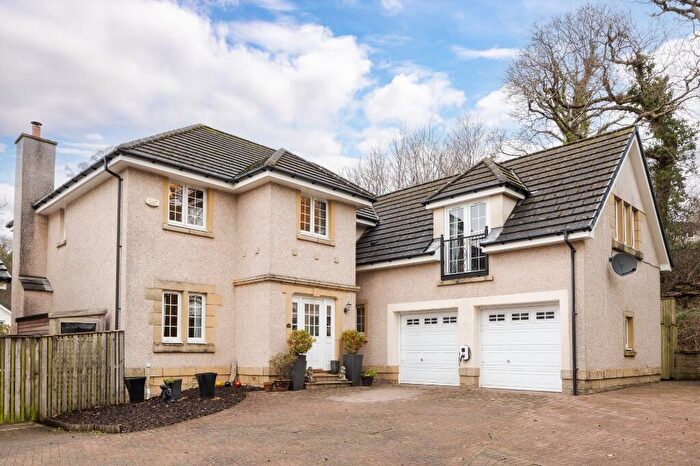
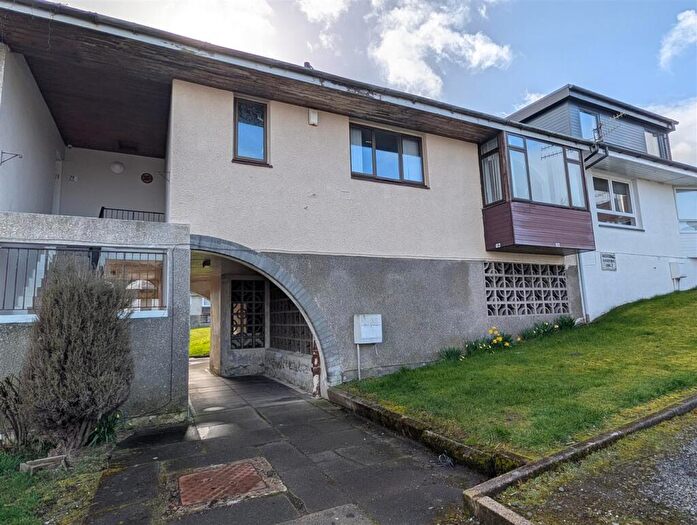
Properties for sale in Port Glasgow

![]()
If you are looking to sell your house, let it out, or receive a property valuation, an expert can help you.
Click the button below to get started.
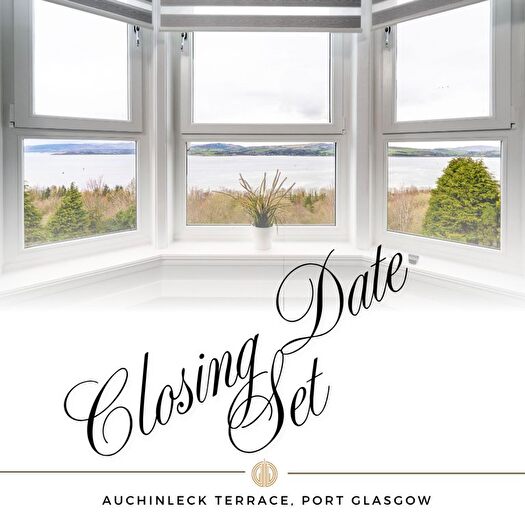
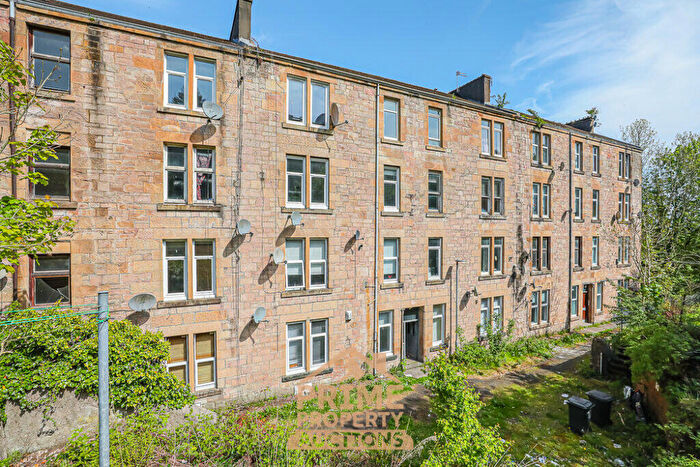

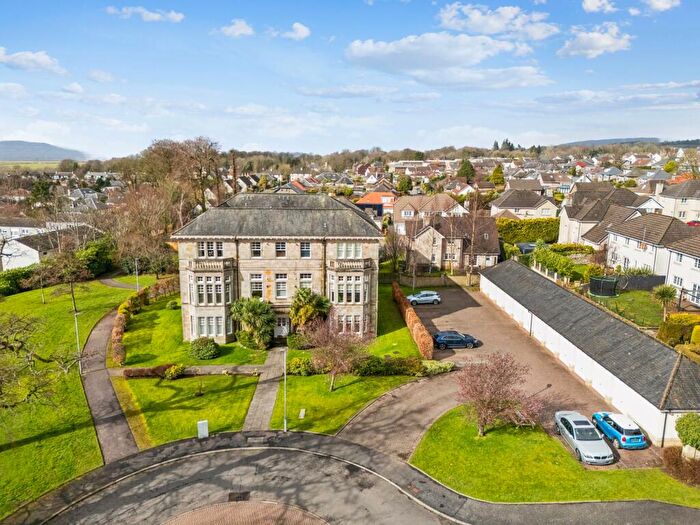

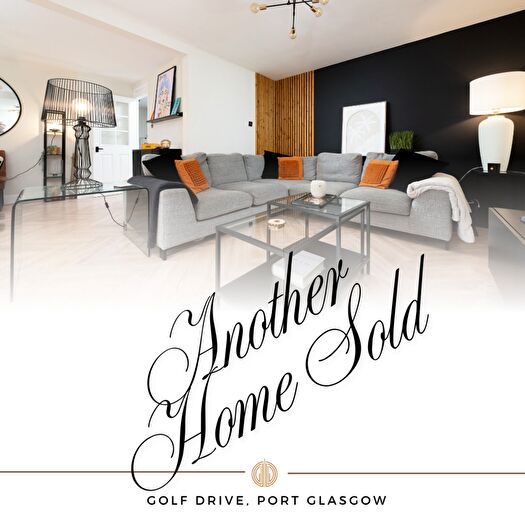
Previously listed properties in Port Glasgow
Neighbourhoods in Port Glasgow
Navigate through our locations to find the location of your next house in Port Glasgow, Inverclyde for sale or to rent.
Transport in Port Glasgow
Please see below transportation links in this area:
-
 Woodhall Station
 -
Port Glasgow Station
-
Bogston Station
-
Cardross Station
-
Cartsdyke Station
-
Whinhill Station
- FAQ
- Price Paid By Year
Frequently asked questions about Port Glasgow
What is the average price for a property for sale in Port Glasgow?
The average price for a property for sale in Port Glasgow is £101,495. This amount is 38% lower than the average price in Inverclyde. There are 814 property listings for sale in Port Glasgow.
What locations have the most expensive properties for sale in Port Glasgow?
The location with the most expensive properties for sale in Port Glasgow is Inverclyde East at an average of £106,123.
What locations have the most affordable properties for sale in Port Glasgow?
The location with the most affordable properties for sale in Port Glasgow is Inverclyde East Central at an average of £98,712.
Which train stations are available in or near Port Glasgow?
Some of the train stations available in or near Port Glasgow are Woodhall, Port Glasgow and Bogston.
Property Price Paid in Port Glasgow by Year
The average sold property price by year was:
| Year | Average Sold Price | Price Change |
Sold Properties
|
|---|---|---|---|
| 2025 | £112,526 | 13% |
88 Properties |
| 2024 | £97,531 | 2% |
63 Properties |
| 2023 | £95,772 | -6% |
126 Properties |
| 2022 | £101,201 | 7% |
214 Properties |
| 2021 | £94,004 | 4% |
273 Properties |
| 2020 | £90,515 | 4% |
183 Properties |
| 2019 | £87,081 | 5% |
195 Properties |
| 2018 | £82,852 | 1% |
188 Properties |
| 2017 | £81,950 | 4% |
209 Properties |
| 2016 | £78,275 | -6% |
207 Properties |
| 2015 | £82,971 | 10% |
140 Properties |
| 2014 | £74,636 | 9% |
155 Properties |
| 2013 | £67,819 | -20% |
156 Properties |
| 2012 | £81,074 | -2% |
131 Properties |
| 2011 | £82,441 | -18% |
138 Properties |
| 2010 | £96,873 | 22% |
195 Properties |
| 2009 | £75,237 | -20% |
253 Properties |
| 2008 | £90,432 | -215% |
348 Properties |
| 2007 | £284,588 | 78% |
421 Properties |
| 2006 | £62,033 | -260% |
346 Properties |
| 2005 | £223,208 | 83% |
326 Properties |
| 2004 | £38,750 | 11% |
289 Properties |
| 2003 | £34,377 | -2% |
324 Properties |
| 2002 | £35,043 | -25% |
318 Properties |
| 2001 | £43,882 | - |
28 Properties |