
Houses for sale in Elgin, Moray
House Prices in Elgin
Properties in Elgin have an average house price of £193k and had 873 Property Transactions within the last 3 years.¹
Elgin is an area in Moray with 14,378 households², where the most expensive property was sold for £565k.
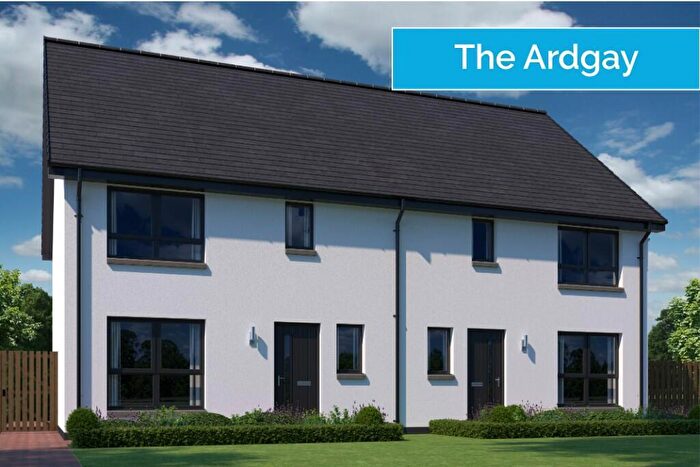
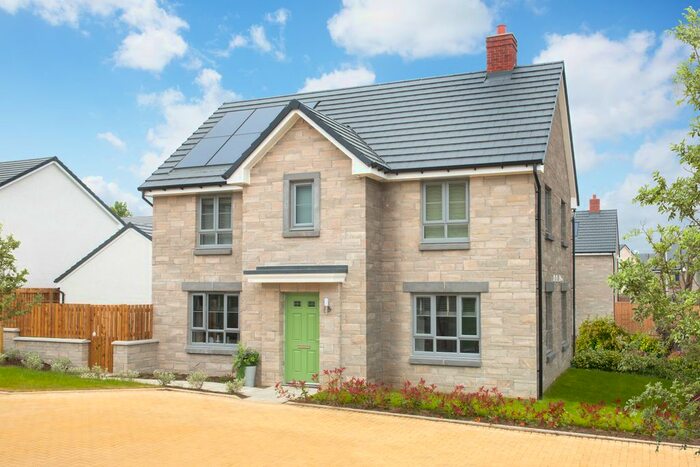
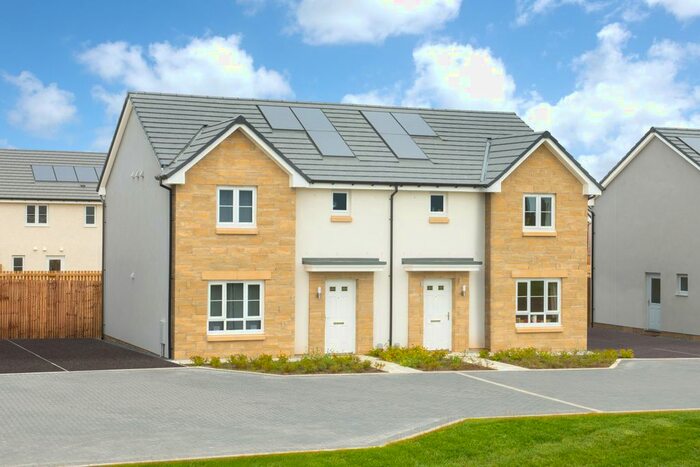
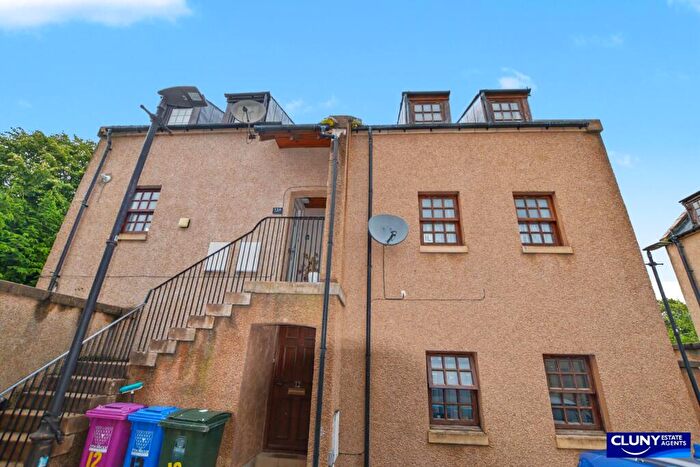
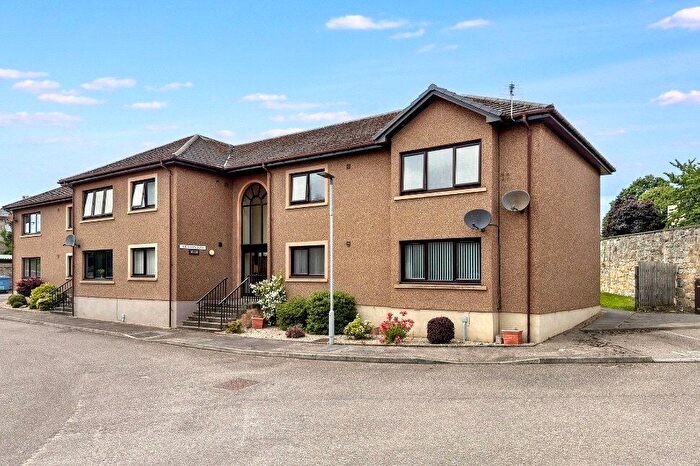
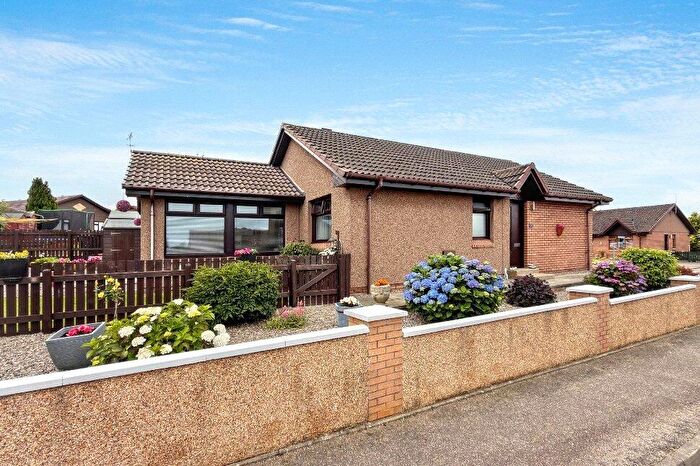
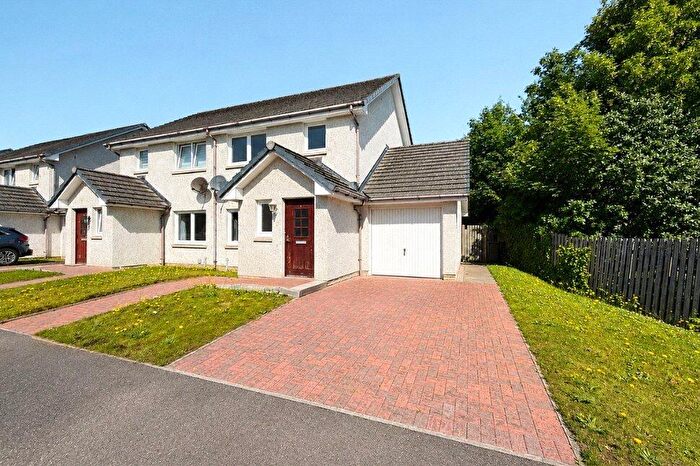
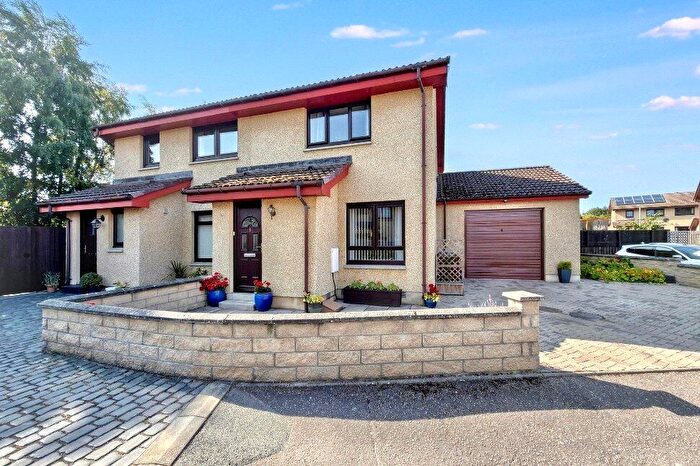
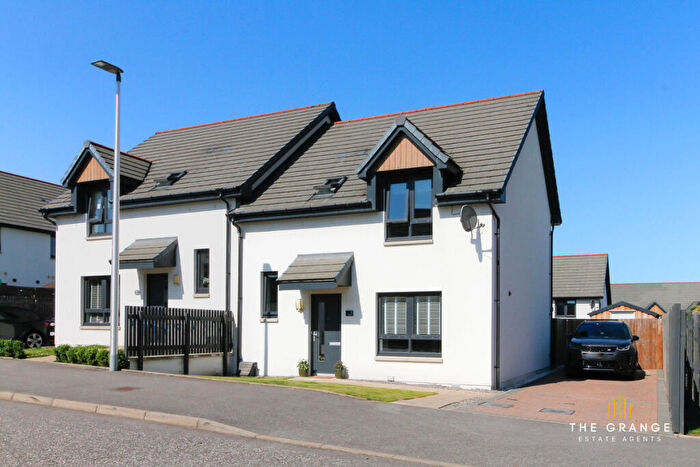
Properties for sale in Elgin
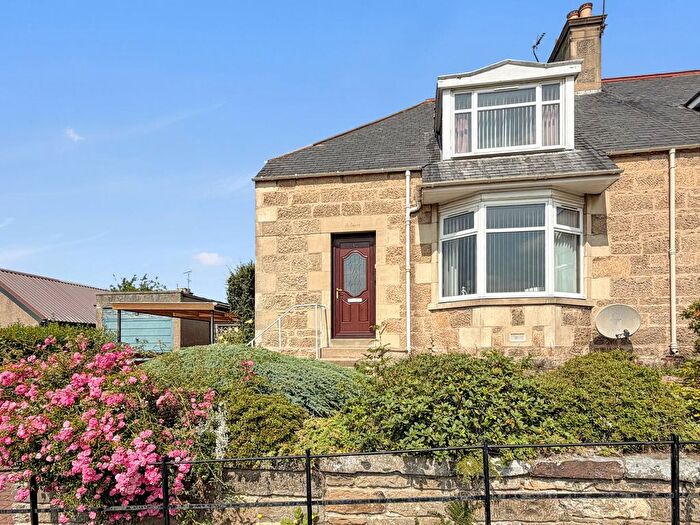
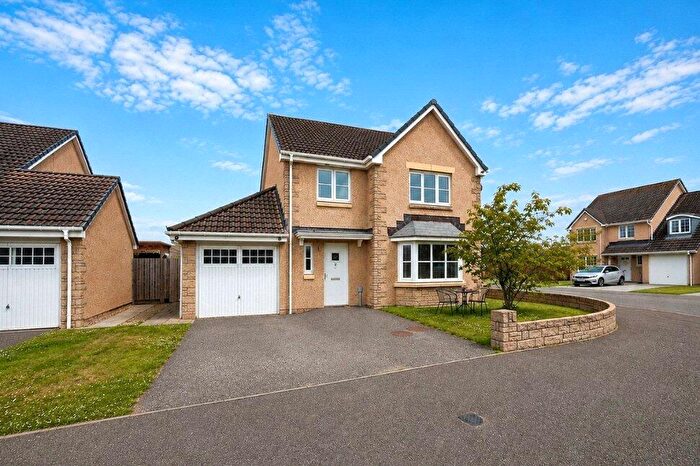

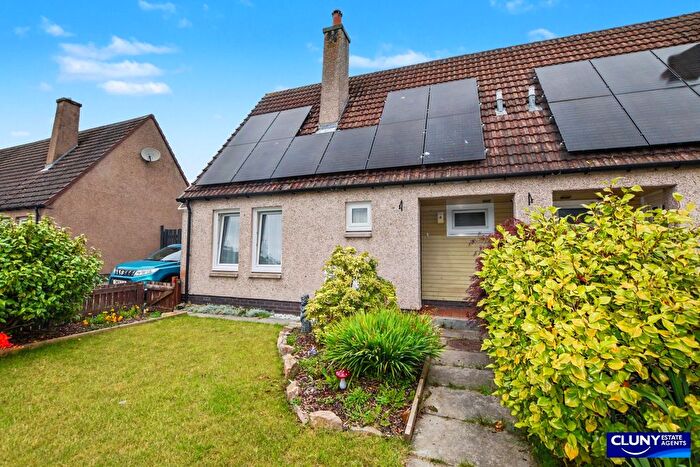
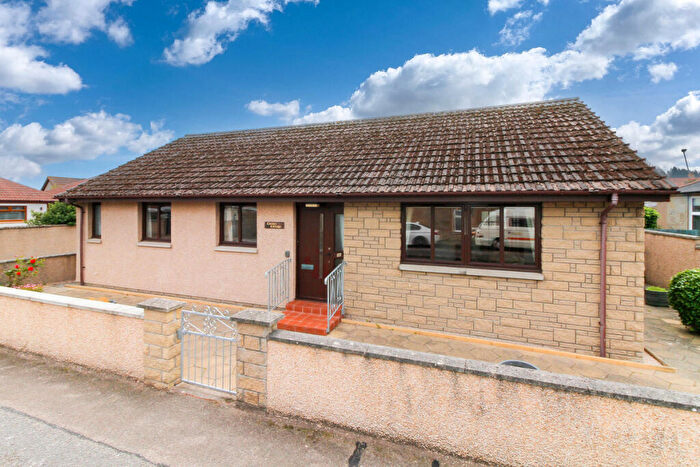
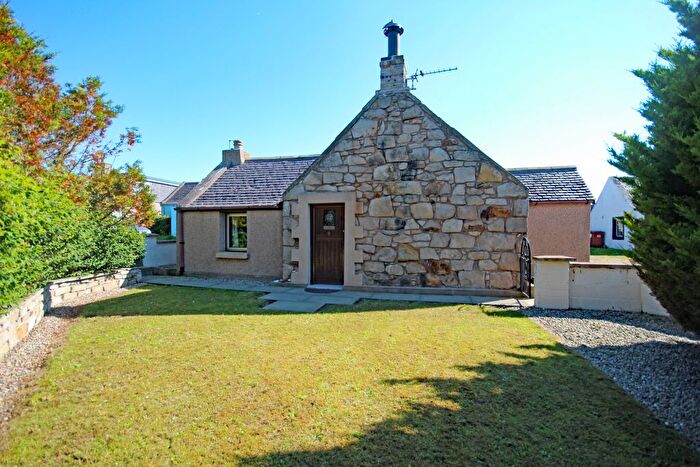
![]()
If you are looking to sell your house, let it out, or receive a property valuation, an expert can help you.
Click the button below to get started.


Neighbourhoods in Elgin
Navigate through our locations to find the location of your next house in Elgin, Moray for sale or to rent.
Property price trends in Elgin
According to the latest Registers of Scotland data, the average home in Elgin sold for £200,828 in 2025. That figure comes from a substantial record of 14,394 sales logged over the past 25 years.
Prices have softened over the last three years. Compared with 2022, when the typical sale came in around £204,681, that's a fall of roughly 1.9%.
Looking back five years, average prices are up about 7.1% since 2020, a gain of around £13,249 in cash terms.
Zoom out to the past decade for the fuller picture. Back in 2015, homes here averaged £156,968, so the typical sold price has climbed about 27.9% since then, roughly 2.5% a year. Stretch the view to fifteen years and that annual pace eases back to about 1.7%.
Frequently asked questions about Elgin
What is the average price for a property for sale in Elgin?
The average price for a property for sale in Elgin is £192,735. This amount is 4% higher than the average price in Moray. There are 4,008 property listings for sale in Elgin.
What locations have the most expensive properties for sale in Elgin?
The locations with the most expensive properties for sale in Elgin are Heldon and Laich at an average of £232,719 and Fochabers Lhanbryde at an average of £199,745.
What locations have the most affordable properties for sale in Elgin?
The locations with the most affordable properties for sale in Elgin are Elgin City North at an average of £172,774 and Elgin City South at an average of £192,103.
Which train stations are available in or near Elgin?
Some of the train stations available in or near Elgin are Elgin, Forres and Keith.
Property Price Paid in Elgin by Year
The average sold property price by year was:
| Year | Average Sold Price | Price Change |
Sold Properties
|
|---|---|---|---|
| 2025 | £200,828 | 9% |
285 Properties |
| 2024 | £183,512 | -5% |
255 Properties |
| 2023 | £192,872 | -6% |
333 Properties |
| 2022 | £204,681 | 7% |
642 Properties |
| 2021 | £190,018 | 1% |
713 Properties |
| 2020 | £187,579 | 5% |
542 Properties |
| 2019 | £178,111 | 1% |
636 Properties |
| 2018 | £176,179 | 7% |
716 Properties |
| 2017 | £164,643 | 3% |
639 Properties |
| 2016 | £159,893 | 2% |
780 Properties |
Transport in Elgin
Please see below transportation links in this area:
