
Houses for sale & to rent in Lossiemouth, Moray
House Prices in Lossiemouth
Properties in Lossiemouth have an average house price of £183k and had 245 Property Transactions within the last 3 years.¹
Lossiemouth is an area in Moray with 3,165 households², where the most expensive property was sold for £613k.
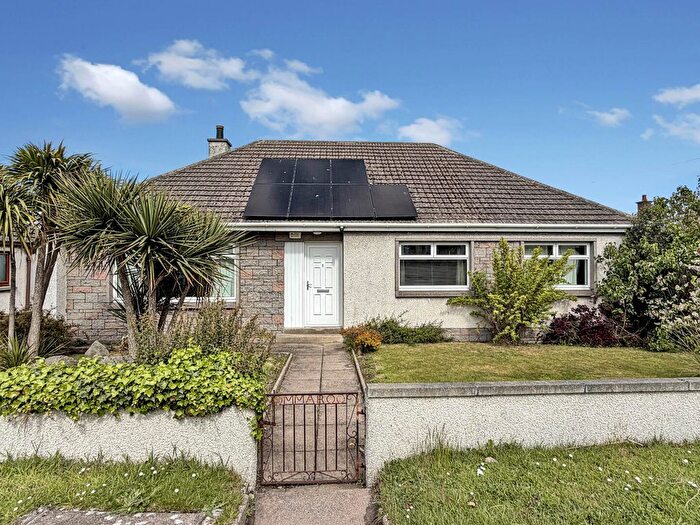
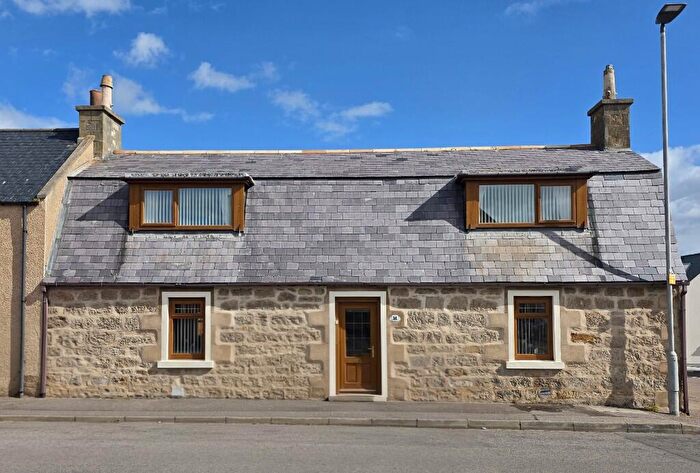
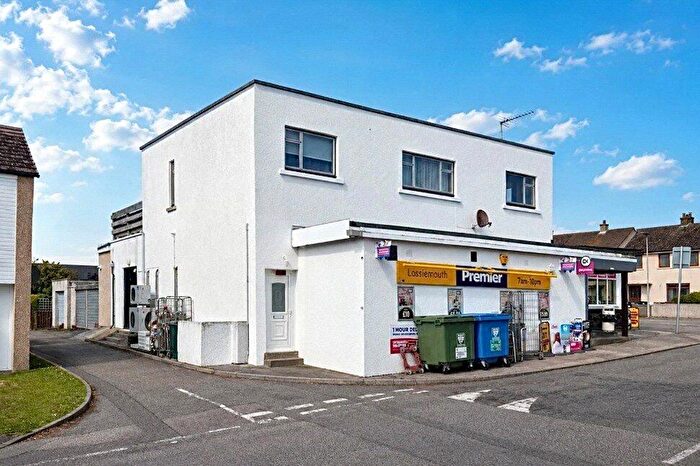
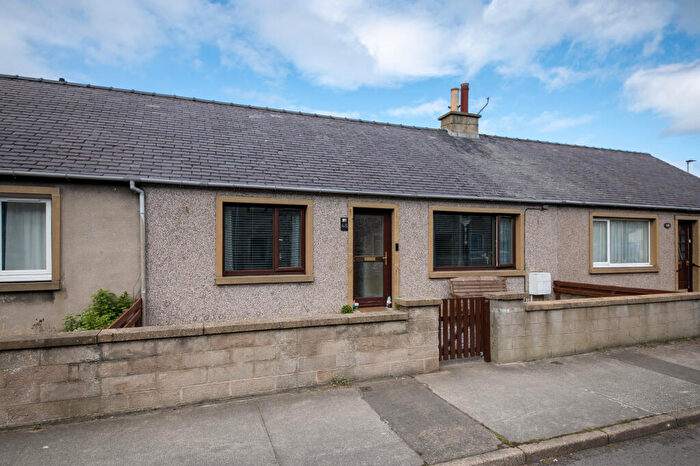
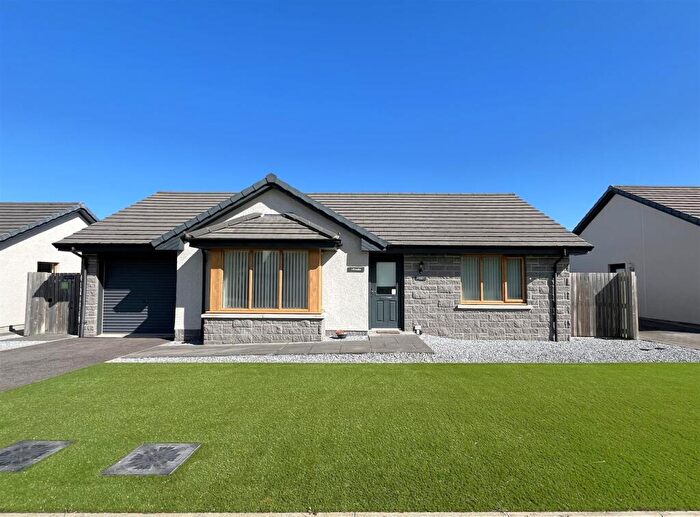
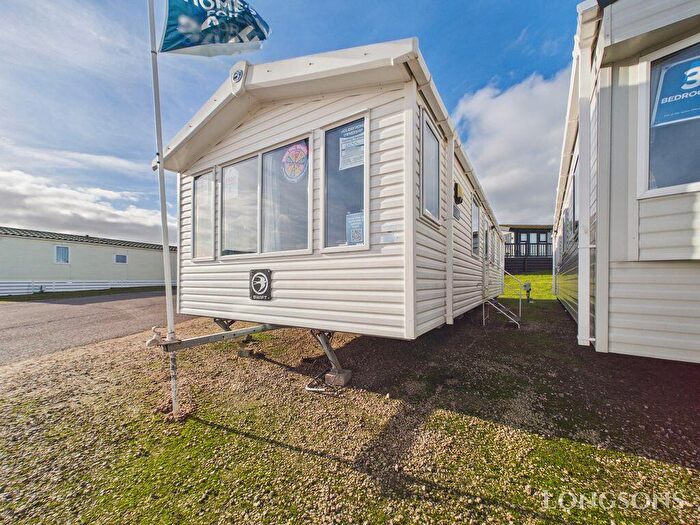
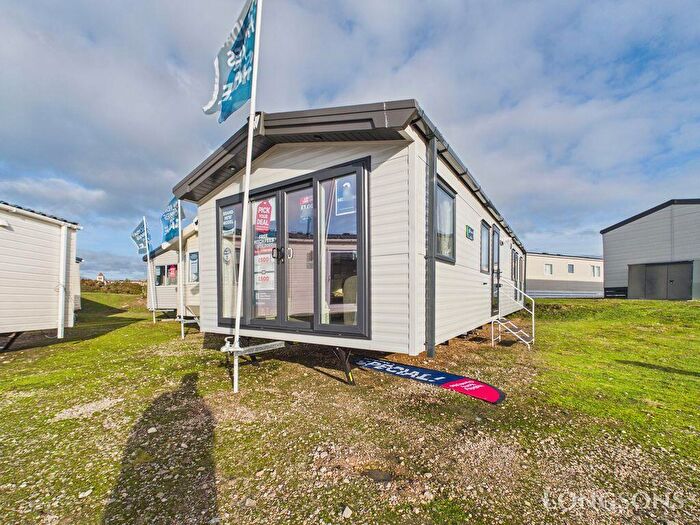
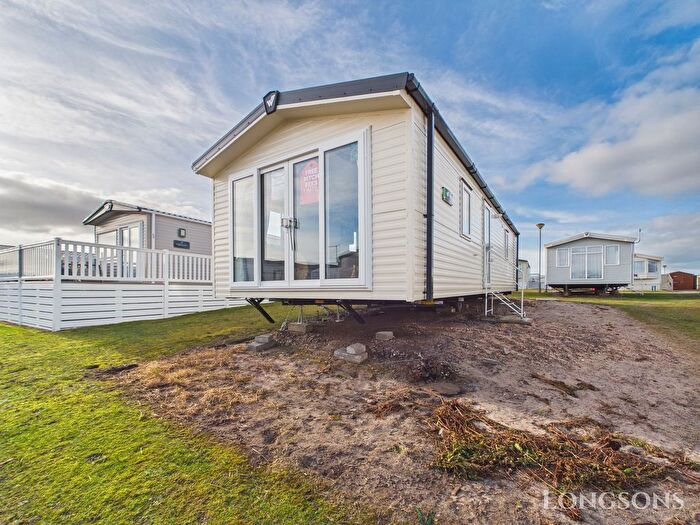
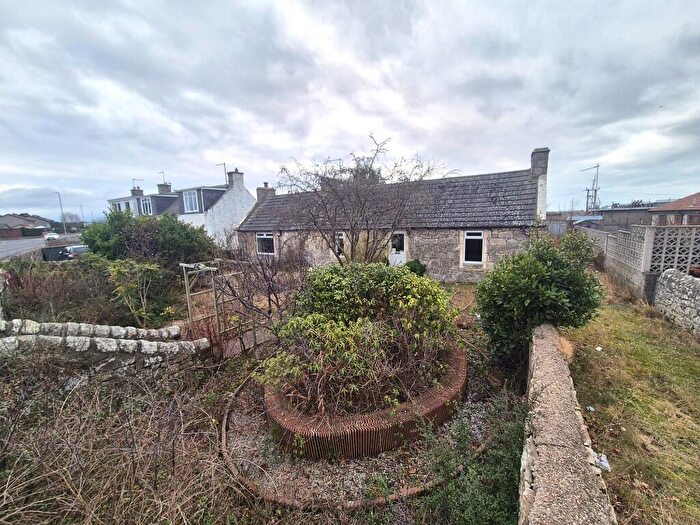
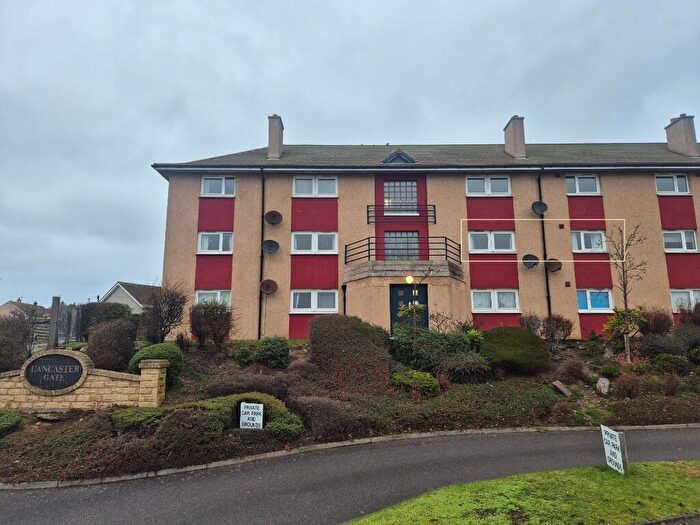
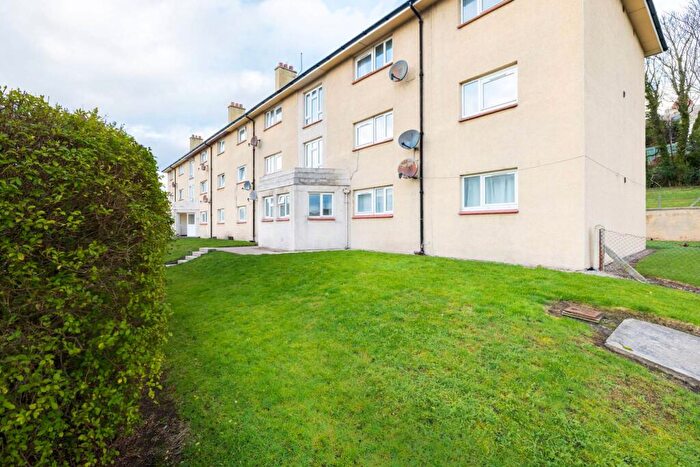
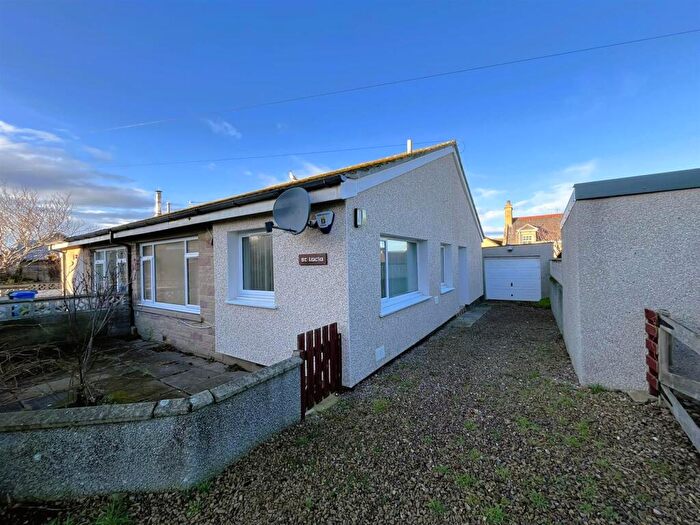
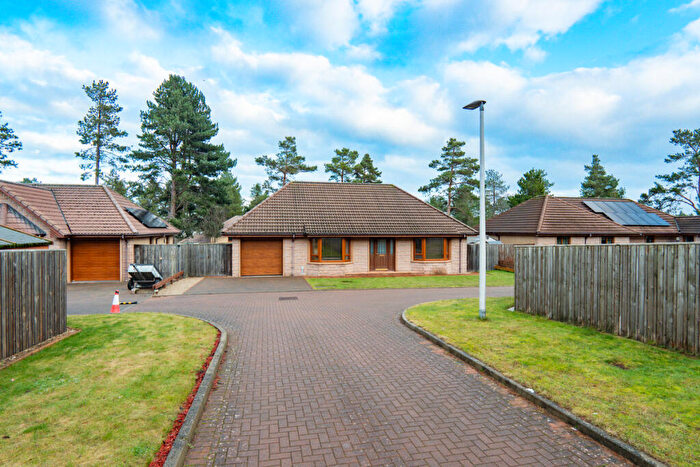
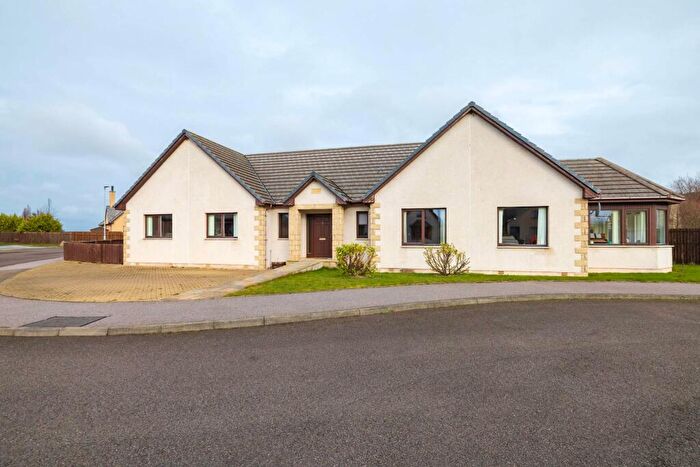
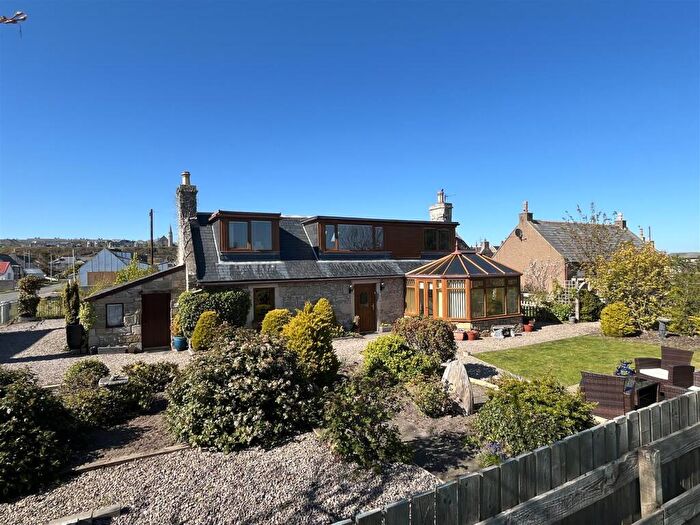
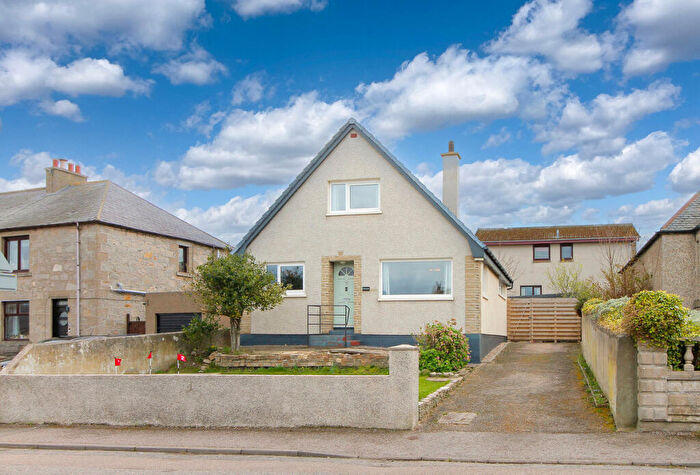
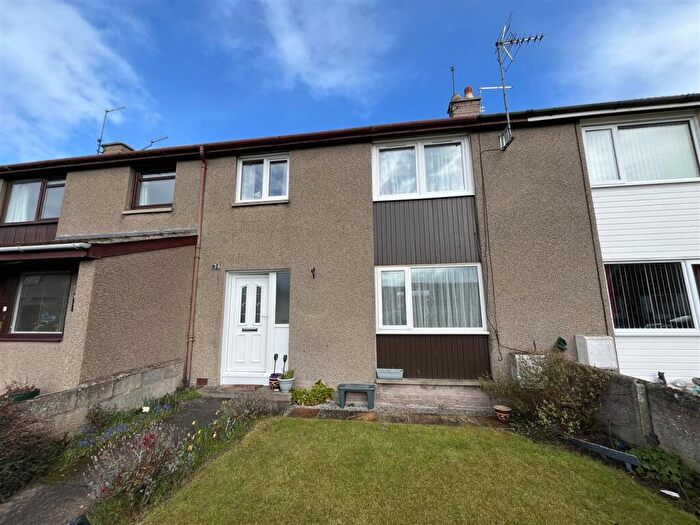
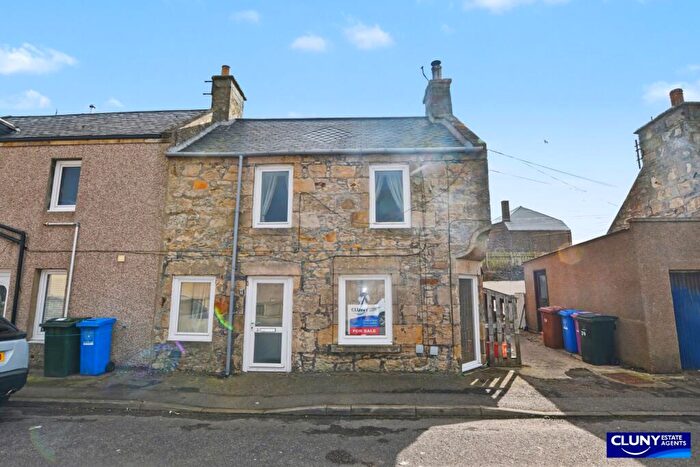
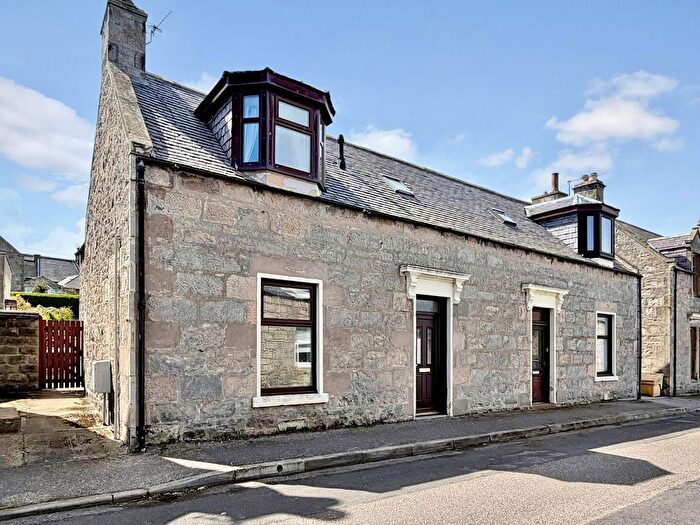
Properties for sale in Lossiemouth
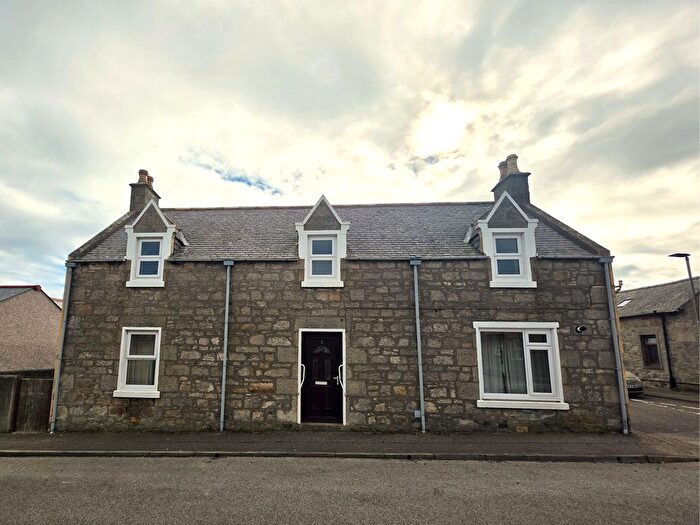
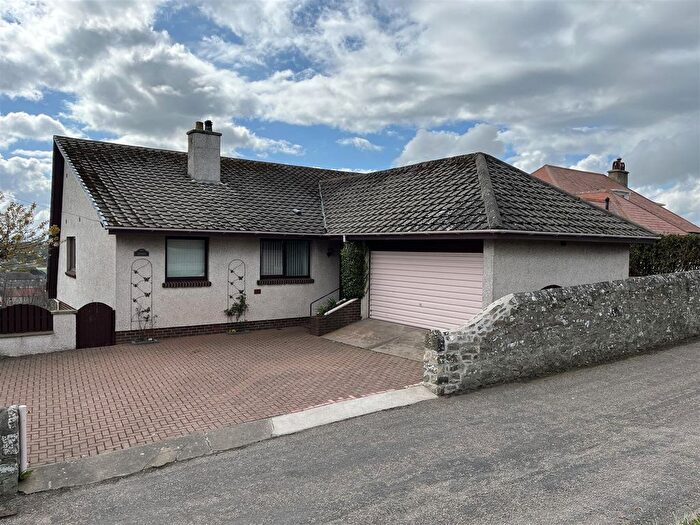
![]()
If you are looking to sell your house, let it out, or receive a property valuation, an expert can help you.
Click the button below to get started.
Previously listed properties in Lossiemouth
Neighbourhoods in Lossiemouth
Navigate through our locations to find the location of your next house in Lossiemouth, Moray for sale or to rent.
Transport in Lossiemouth
Please see below transportation links in this area:

- FAQ
- Price Paid By Year
Frequently asked questions about Lossiemouth
What is the average price for a property for sale in Lossiemouth?
The average price for a property for sale in Lossiemouth is £182,666. This amount is 2% lower than the average price in Moray. There are 788 property listings for sale in Lossiemouth.
Which train stations are available in or near Lossiemouth?
Some of the train stations available in or near Lossiemouth are Elgin, Forres and Keith.
Property Price Paid in Lossiemouth by Year
The average sold property price by year was:
| Year | Average Sold Price | Price Change |
Sold Properties
|
|---|---|---|---|
| 2025 | £177,563 | -7% |
77 Properties |
| 2024 | £190,181 | 5% |
72 Properties |
| 2023 | £181,123 | -11% |
96 Properties |
| 2022 | £200,878 | 8% |
111 Properties |
| 2021 | £184,623 | 16% |
152 Properties |
| 2020 | £155,848 | -1% |
98 Properties |
| 2019 | £157,136 | -5% |
144 Properties |
| 2018 | £165,342 | 11% |
145 Properties |
| 2017 | £147,791 | 3% |
150 Properties |
| 2016 | £143,466 | -5% |
147 Properties |
| 2015 | £151,165 | 17% |
151 Properties |
| 2014 | £125,489 | -15% |
142 Properties |
| 2013 | £143,921 | 6% |
114 Properties |
| 2012 | £135,321 | 8% |
84 Properties |
| 2011 | £124,623 | -10% |
70 Properties |
| 2010 | £137,182 | 9% |
115 Properties |
| 2009 | £124,533 | -6% |
127 Properties |
| 2008 | £131,778 | 6% |
121 Properties |
| 2007 | £123,542 | 15% |
196 Properties |
| 2006 | £104,882 | 12% |
178 Properties |
| 2005 | £92,036 | 15% |
191 Properties |
| 2004 | £77,877 | 14% |
174 Properties |
| 2003 | £66,678 | 16% |
147 Properties |
| 2002 | £55,788 | 11% |
46 Properties |
| 2001 | £49,804 | 6% |
38 Properties |
| 2000 | £46,642 | - |
7 Properties |