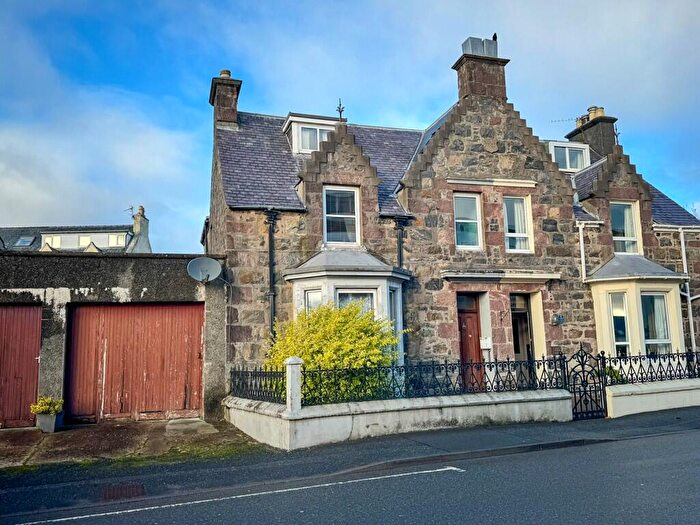
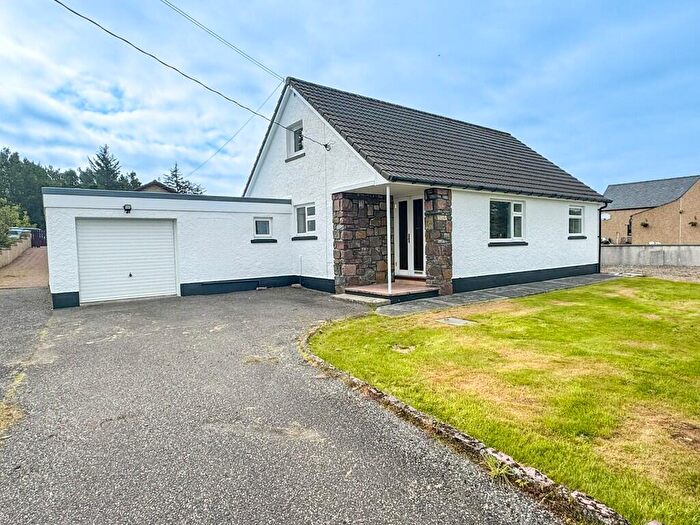
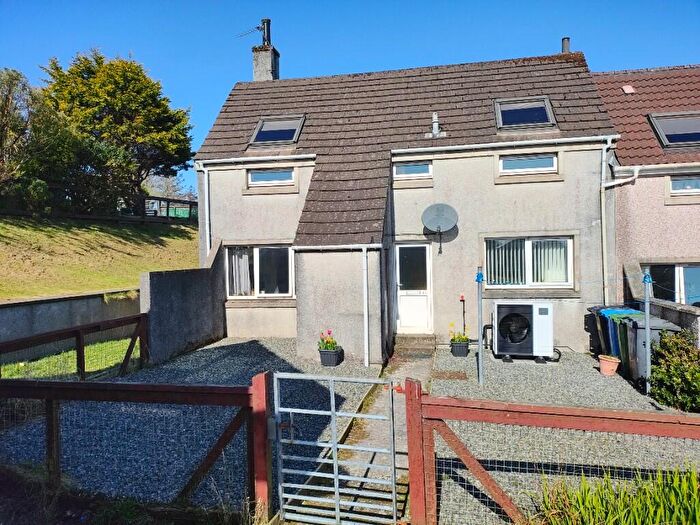
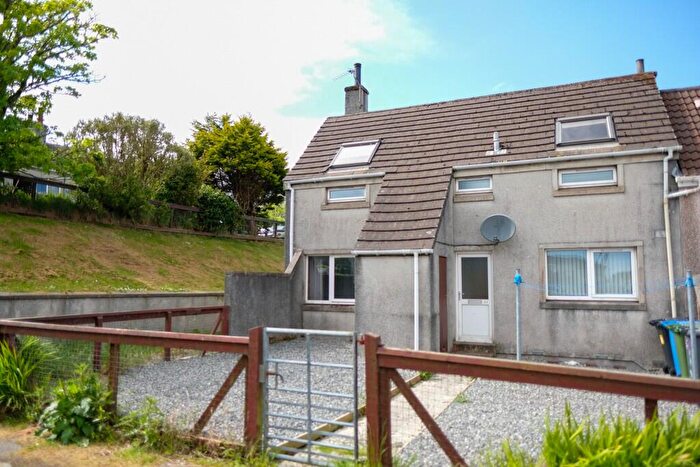
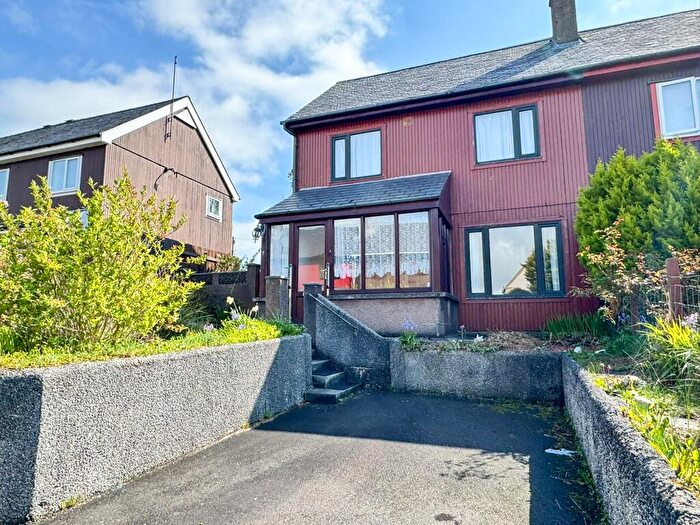
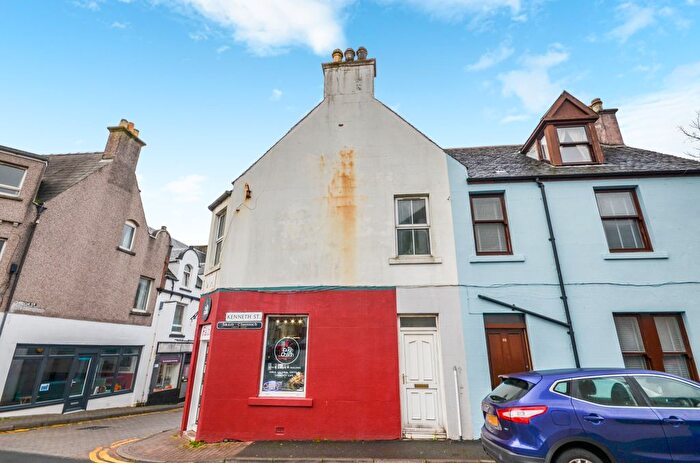
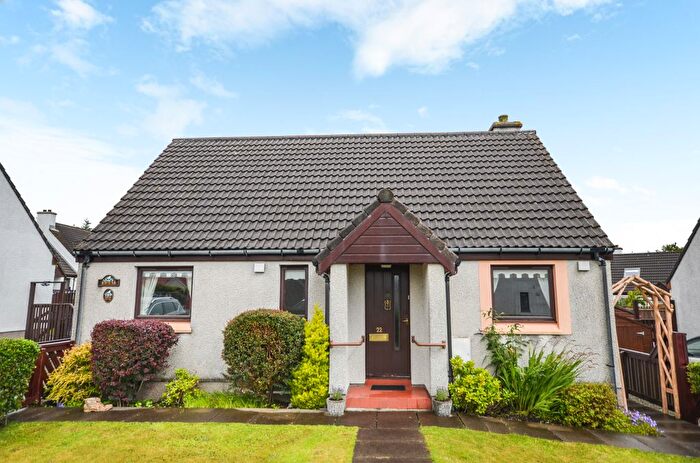
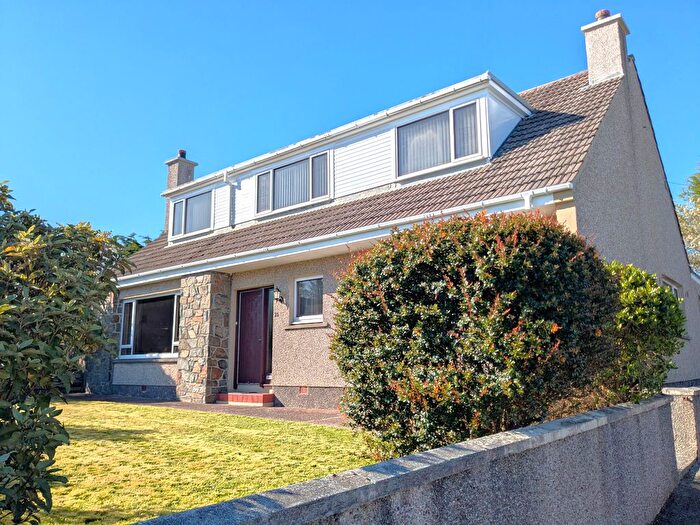
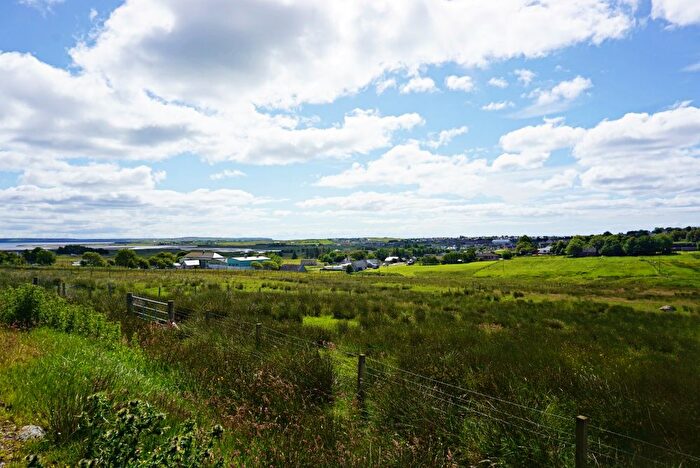
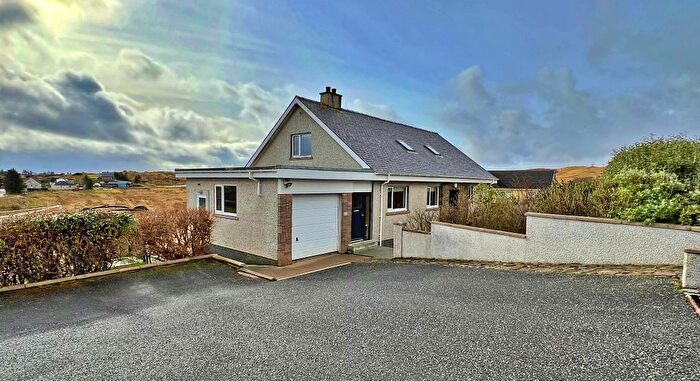
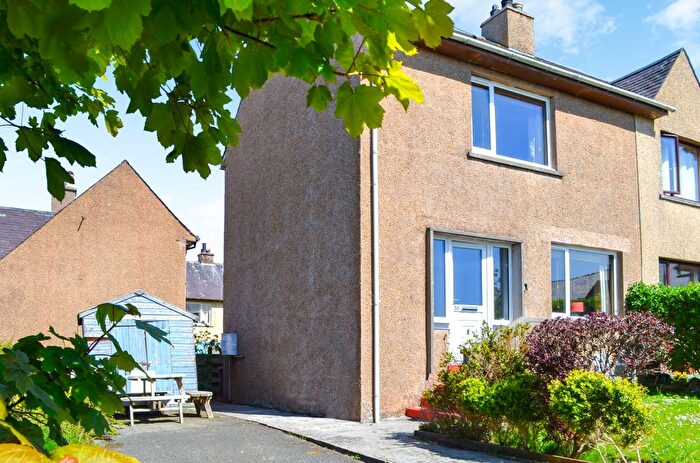
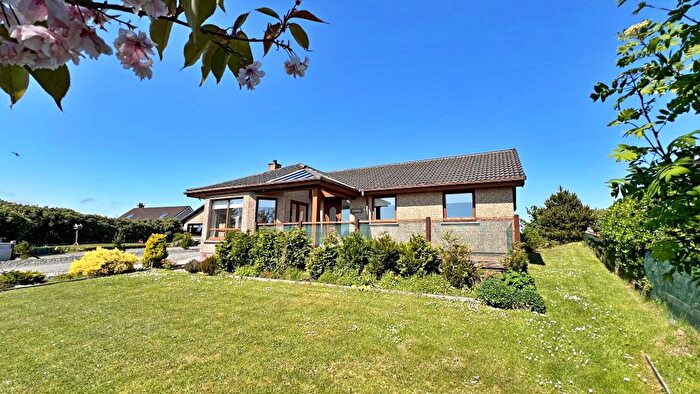
Houses for sale & to rent in Steòrnabhagh a Tuath, Isle Of Lewis
House Prices in Steòrnabhagh a Tuath
Properties in Steòrnabhagh a Tuath have an average house price of £279,375.00 and had 8 Property Transactions within the last 3 years¹.
Steòrnabhagh a Tuath is an area in Isle Of Lewis, Na h-Eileanan an Iar with 627 households², where the most expensive property was sold for £465,000.00.
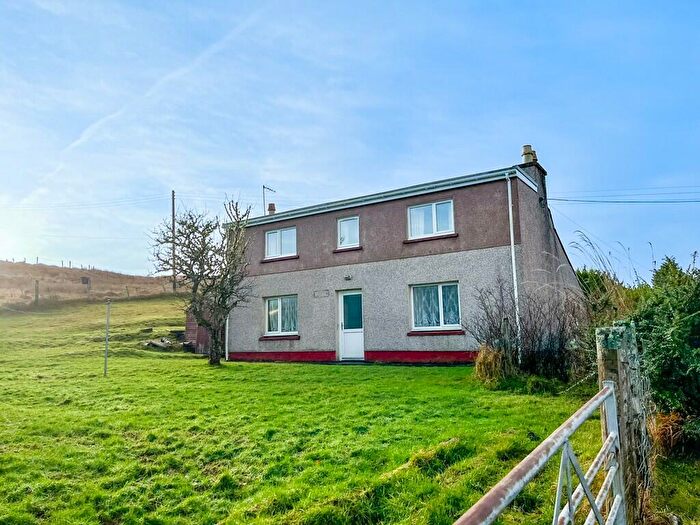
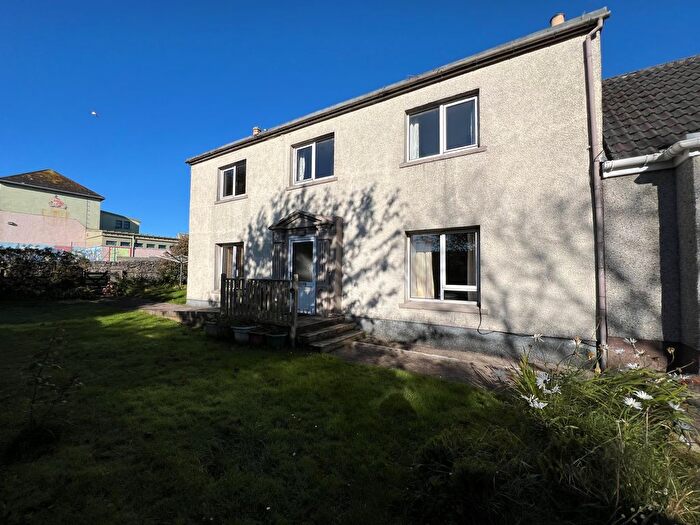
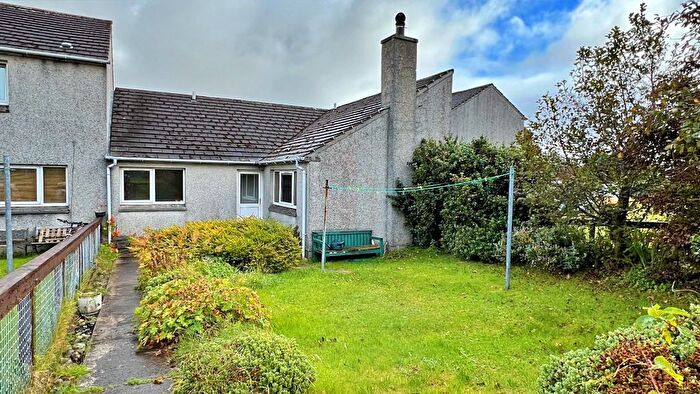
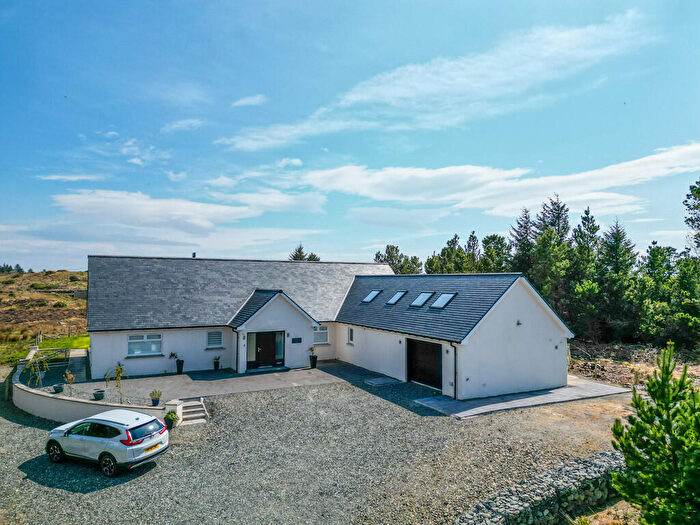
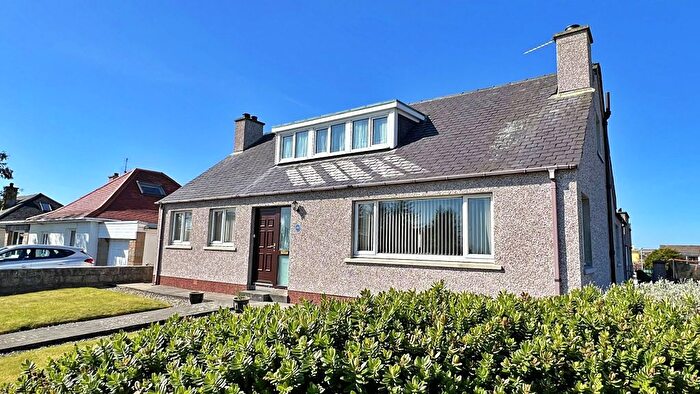
Properties for sale in Steòrnabhagh a Tuath
Previously listed properties in Steòrnabhagh a Tuath
Roads and Postcodes in Steòrnabhagh a Tuath
Navigate through our locations to find the location of your next house in Steòrnabhagh a Tuath, Isle Of Lewis for sale or to rent.
| Streets | Postcodes |
|---|---|
| Airidhean Ur | HS2 0BT |
| Allt Na Broige | HS2 0DX |
| Bennadrove Road | HS2 0DL |
| Creag Ruadh | HS2 0FS |
| Eitseal Way | HS2 0BR |
| Laxdale Court | HS2 0GS |
| Laxdale Lane | HS2 0DR |
| Macgregor Park | HS2 0EH |
| Maryhill | HS2 0DG HS2 0DJ |
| Memorial View | HS2 0EQ |
| Moor Cottages | HS2 0DE |
| Ravens Lane | HS2 0EG |
| Riverview | HS2 0GT |
| Yard | HS2 0EL |
| HS2 0DB HS2 0DD HS2 0DF HS2 0DH HS2 0DN HS2 0DP HS2 0DS HS2 0DT HS2 0DU HS2 0DW HS2 0DY HS2 0DZ HS2 0EA HS2 0EB HS2 0ED HS2 0EN HS2 0XP HS2 0XR HS2 0XS |
Transport near Steòrnabhagh a Tuath
-
Achnashellach Station
-
Strathcarron Station
-
Achnasheen Station
-
Attadale Station
-
Plockton Station
-
Duncraig Station
-
Duirinish Station
-
Stromeferry Station
-
Achanalt Station
-
Kyle Of Lochalsh Station
- FAQ
- Price Paid By Year
Frequently asked questions about Steòrnabhagh a Tuath
What is the average price for a property for sale in Steòrnabhagh a Tuath?
The average price for a property for sale in Steòrnabhagh a Tuath is £279,375. This amount is 78% higher than the average price in Isle Of Lewis. There are 164 property listings for sale in Steòrnabhagh a Tuath.
Which train stations are available in or near Steòrnabhagh a Tuath?
Some of the train stations available in or near Steòrnabhagh a Tuath are Achnashellach, Strathcarron and Achnasheen.
Property Price Paid in Steòrnabhagh a Tuath by Year
The average sold property price by year was:
| Year | Average Sold Price | Price Change |
Sold Properties
|
|---|---|---|---|
| 2022 | £279,375 | 35% |
8 Properties |
| 2021 | £181,436 | -8% |
31 Properties |
| 2020 | £195,700 | 27% |
16 Properties |
| 2019 | £143,636 | -11% |
11 Properties |
| 2018 | £159,590 | 31% |
11 Properties |
| 2017 | £109,615 | -22% |
8 Properties |
| 2016 | £134,055 | 16% |
18 Properties |
| 2015 | £112,812 | -13% |
25 Properties |
| 2014 | £127,128 | -4% |
12 Properties |
| 2013 | £132,223 | -9% |
17 Properties |
| 2012 | £143,800 | 8% |
10 Properties |
| 2011 | £132,522 | 5% |
14 Properties |
| 2010 | £125,708 | 46% |
12 Properties |
| 2009 | £68,167 | -49% |
12 Properties |
| 2008 | £101,874 | 33% |
23 Properties |
| 2007 | £68,211 | - |
19 Properties |
| 2006 | £68,222 | 11% |
27 Properties |
| 2005 | £60,905 | 22% |
22 Properties |
| 2004 | £47,665 | -48% |
23 Properties |
| 2003 | £70,725 | 32% |
6 Properties |
| 2002 | £47,920 | - |
3 Properties |

