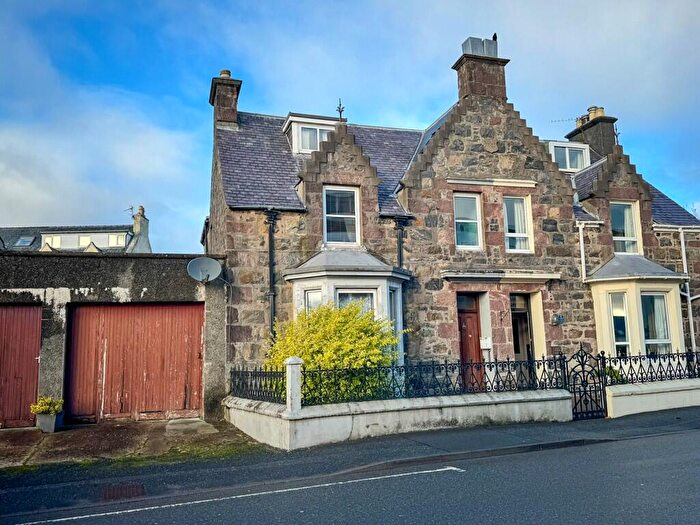
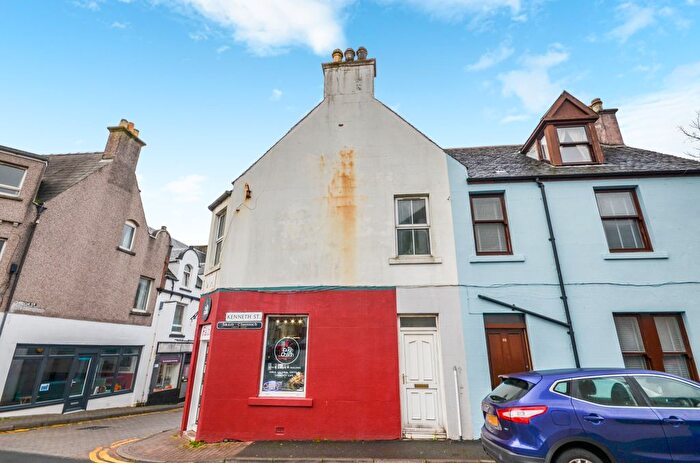
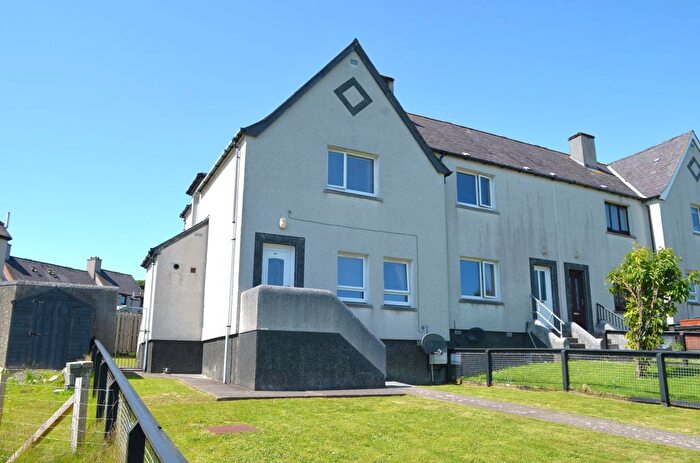
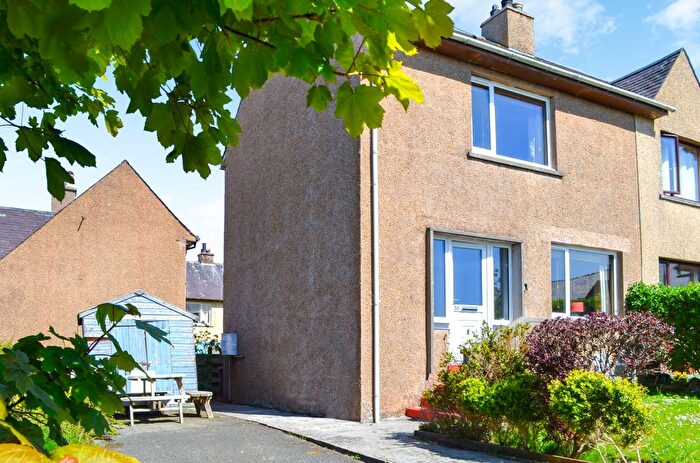
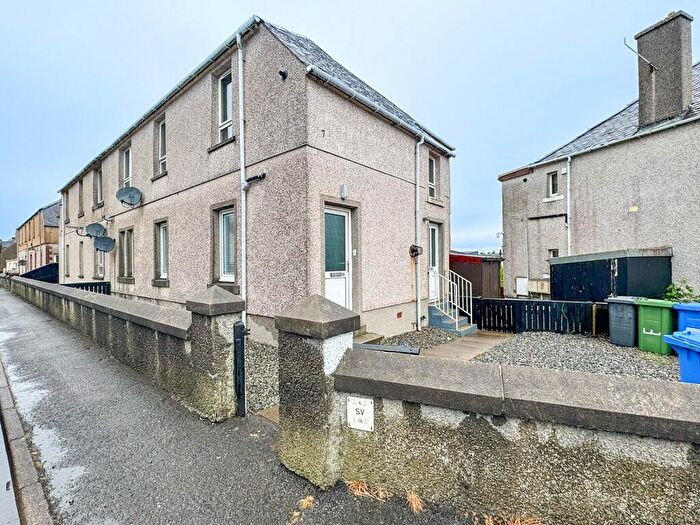
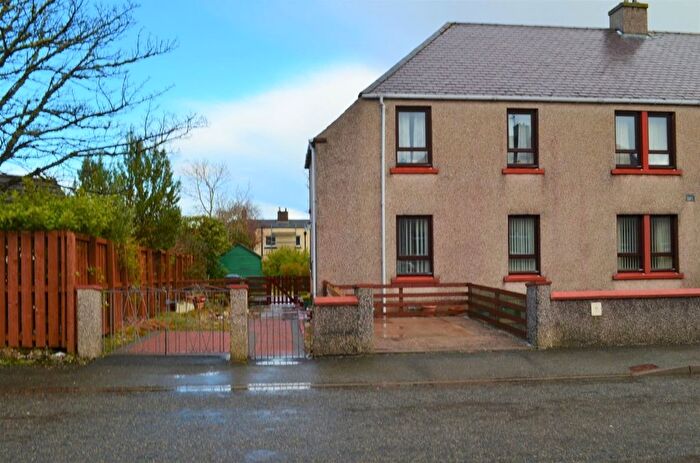
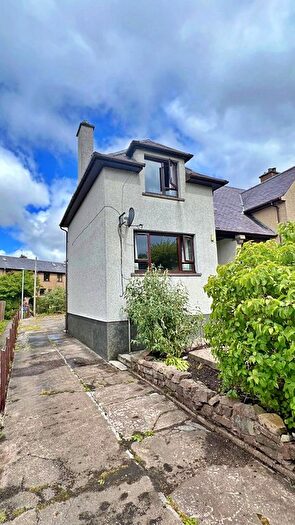
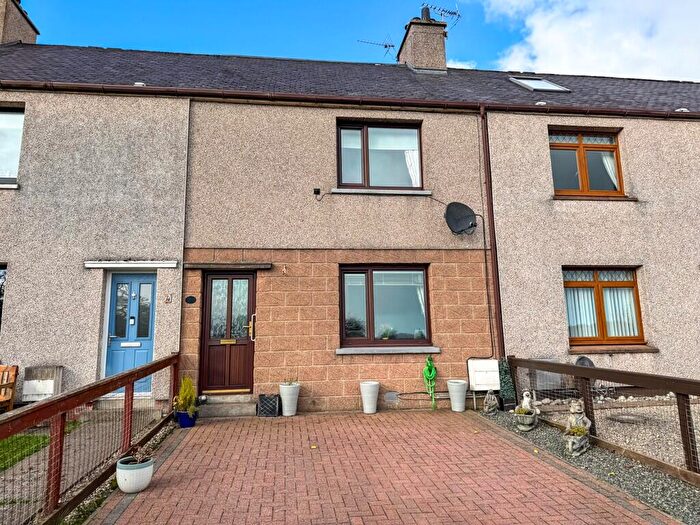
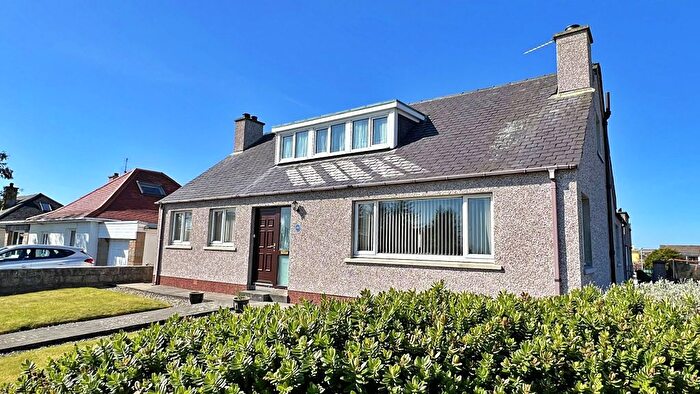
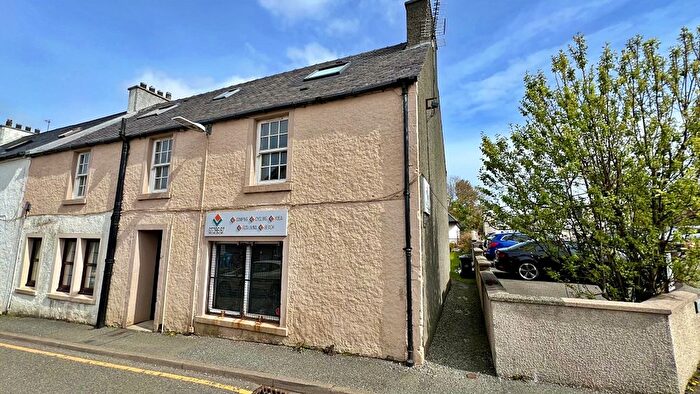
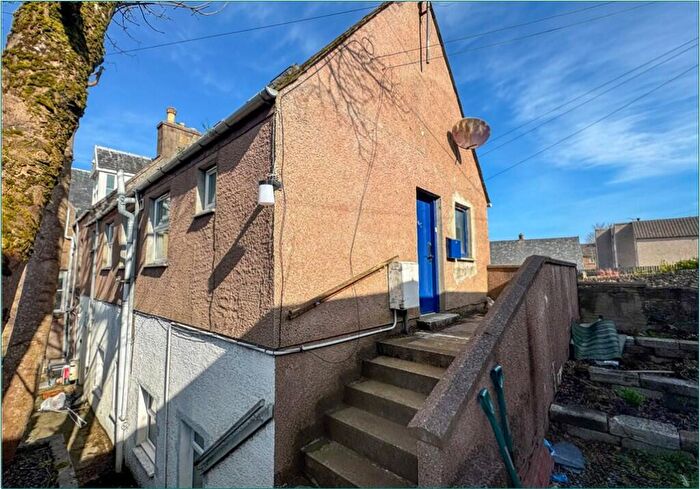
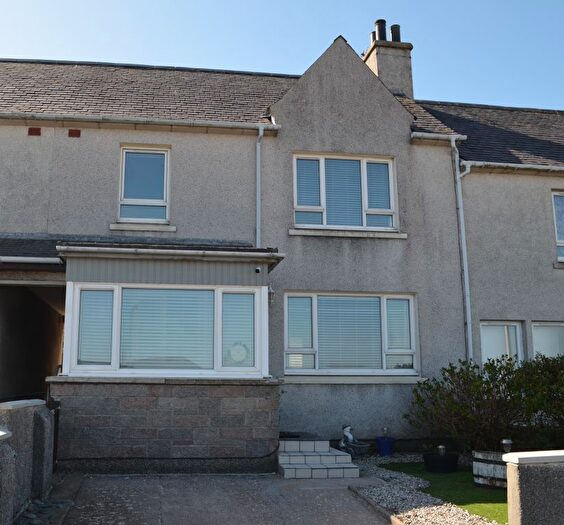
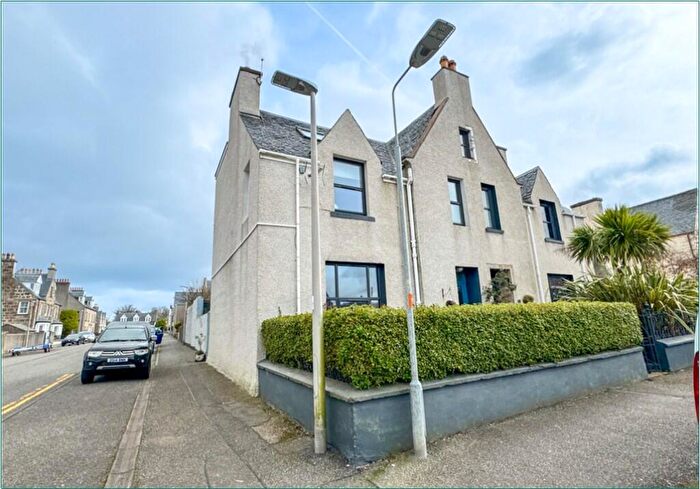
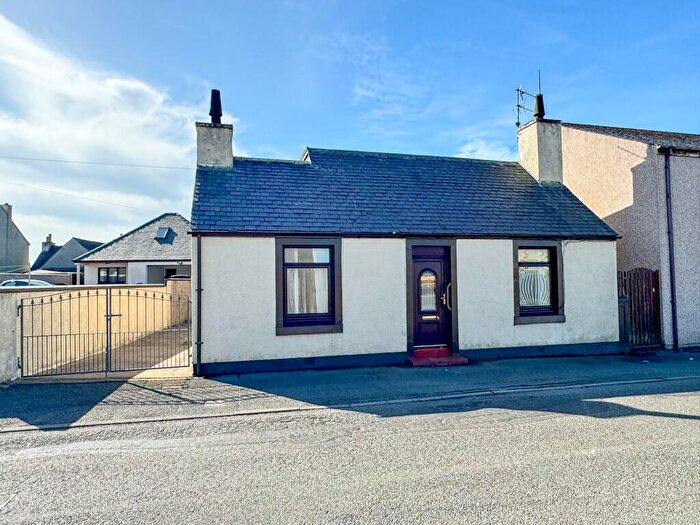
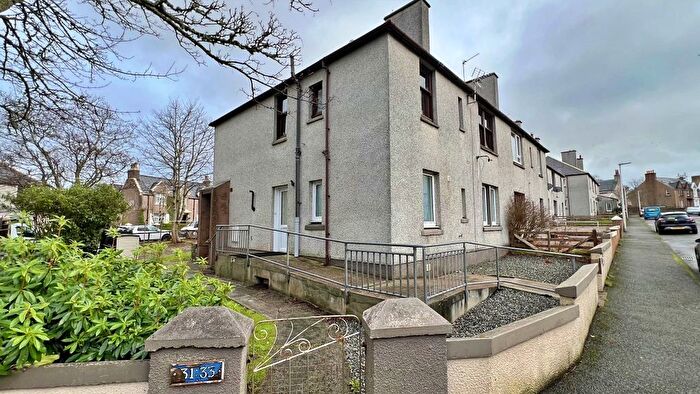
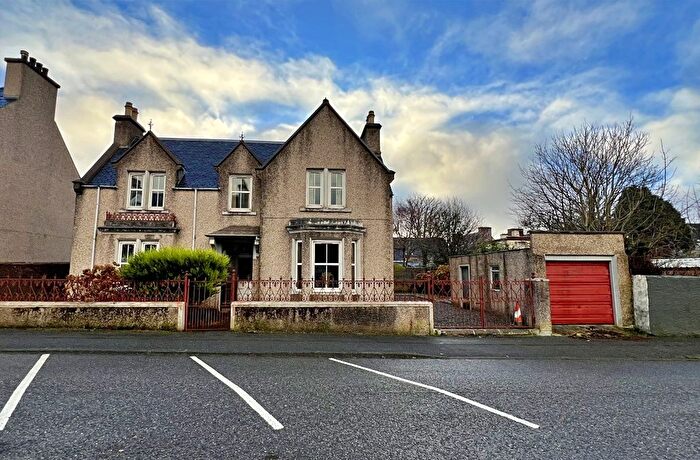
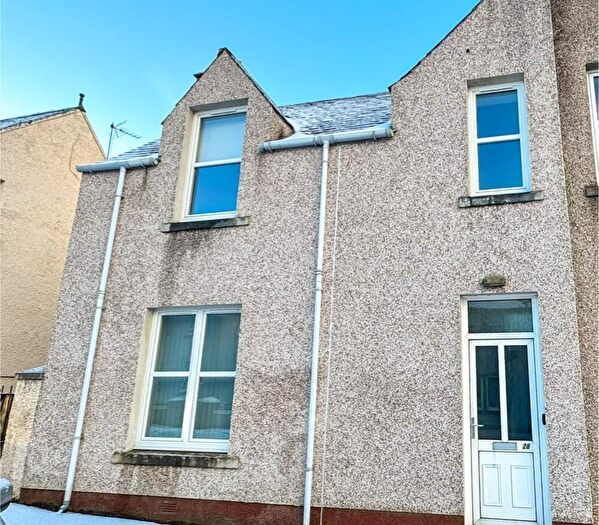
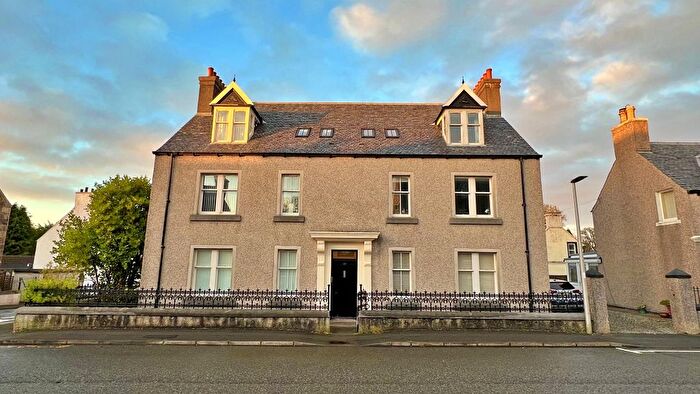
Houses for sale & to rent in Steòrnabhagh a Deas, Stornoway
House Prices in Steòrnabhagh a Deas
Properties in Steòrnabhagh a Deas have an average house price of £144,241.00 and had 57 Property Transactions within the last 3 years¹.
Steòrnabhagh a Deas is an area in Stornoway, Na h-Eileanan an Iar with 1,530 households², where the most expensive property was sold for £375,000.00.
Properties for sale in Steòrnabhagh a Deas
Previously listed properties in Steòrnabhagh a Deas
Roads and Postcodes in Steòrnabhagh a Deas
Navigate through our locations to find the location of your next house in Steòrnabhagh a Deas, Stornoway for sale or to rent.
Transport near Steòrnabhagh a Deas
-
Achnashellach Station
-
Strathcarron Station
-
Achnasheen Station
-
Attadale Station
-
Plockton Station
-
Duncraig Station
-
Duirinish Station
-
Stromeferry Station
-
Achanalt Station
-
Kyle Of Lochalsh Station
- FAQ
- Price Paid By Year
Frequently asked questions about Steòrnabhagh a Deas
What is the average price for a property for sale in Steòrnabhagh a Deas?
The average price for a property for sale in Steòrnabhagh a Deas is £144,241. This amount is 1% higher than the average price in Stornoway. There are 139 property listings for sale in Steòrnabhagh a Deas.
Which train stations are available in or near Steòrnabhagh a Deas?
Some of the train stations available in or near Steòrnabhagh a Deas are Achnashellach, Strathcarron and Achnasheen.
Property Price Paid in Steòrnabhagh a Deas by Year
The average sold property price by year was:
| Year | Average Sold Price | Price Change |
Sold Properties
|
|---|---|---|---|
| 2023 | £129,333 | -13% |
6 Properties |
| 2022 | £145,995 | 12% |
51 Properties |
| 2021 | £128,686 | 10% |
75 Properties |
| 2020 | £115,462 | -4% |
31 Properties |
| 2019 | £120,305 | 14% |
52 Properties |
| 2018 | £102,947 | -13% |
53 Properties |
| 2017 | £115,886 | 15% |
53 Properties |
| 2016 | £98,328 | 7% |
54 Properties |
| 2015 | £91,082 | -10% |
38 Properties |
| 2014 | £100,144 | -1% |
50 Properties |
| 2013 | £101,347 | -14% |
46 Properties |
| 2012 | £115,943 | 6% |
41 Properties |
| 2011 | £108,455 | -23% |
36 Properties |
| 2010 | £133,208 | 17% |
26 Properties |
| 2009 | £110,021 | -2% |
46 Properties |
| 2008 | £112,101 | -6% |
51 Properties |
| 2007 | £119,384 | 30% |
69 Properties |
| 2006 | £84,054 | -14% |
59 Properties |
| 2005 | £95,902 | 13% |
53 Properties |
| 2004 | £83,024 | 29% |
65 Properties |
| 2003 | £58,606 | -34% |
45 Properties |
| 2002 | £78,775 | 36% |
19 Properties |
| 2001 | £50,469 | - |
10 Properties |

