
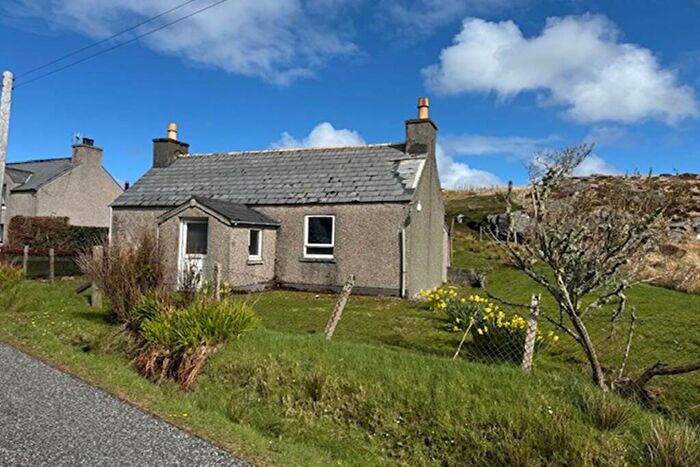
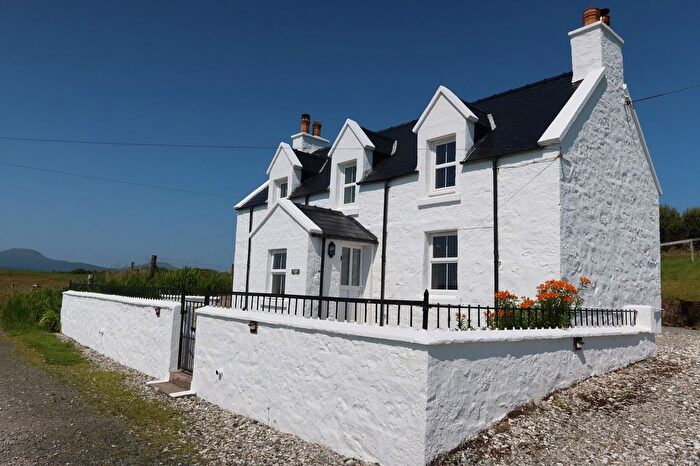
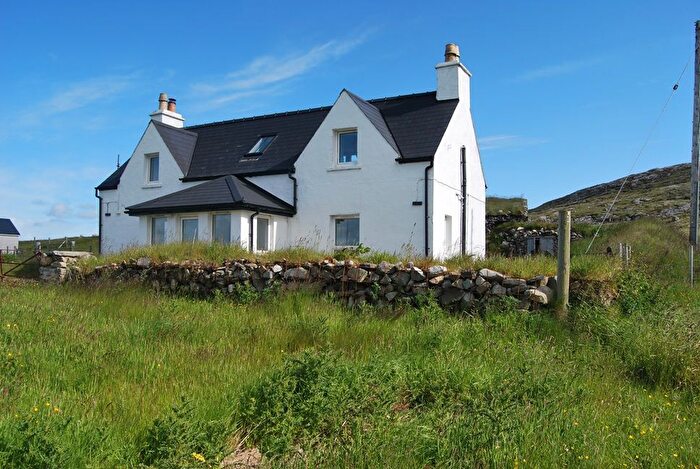
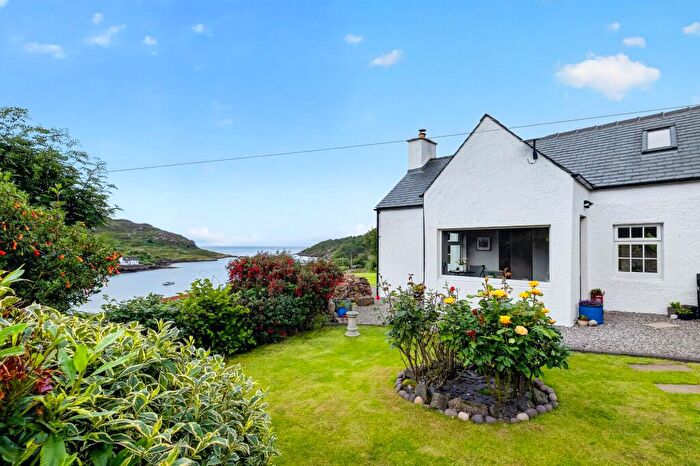
Houses for sale in Na h-Eileanan an Iar, Scotland
House Prices in Na h-Eileanan an Iar
Properties in Na h-Eileanan an Iar have
an average house price of
£150k
and had 333 Property Transactions
within the last 3 years.¹
Na h-Eileanan an Iar is a location in
Scotland with
12,563 households², where the most expensive property was sold for £390k.
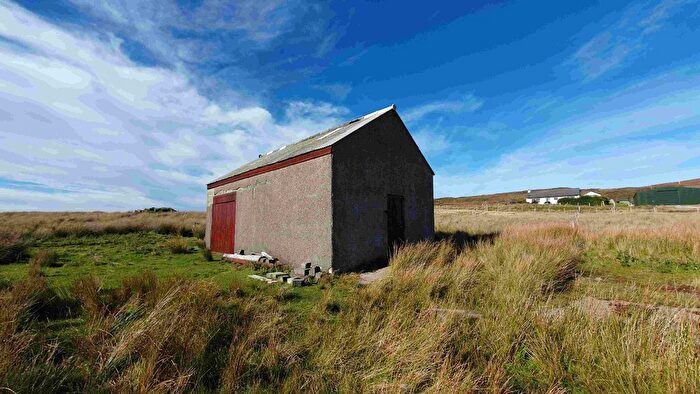
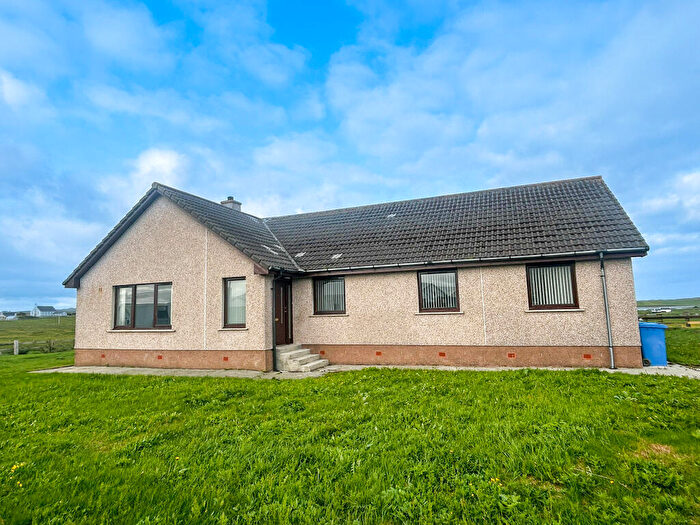
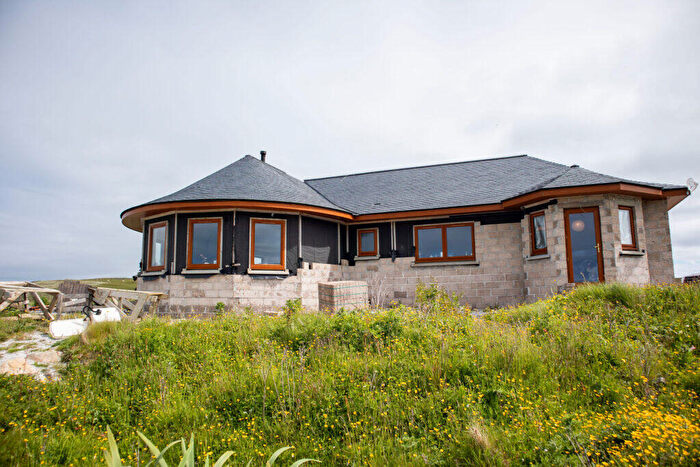
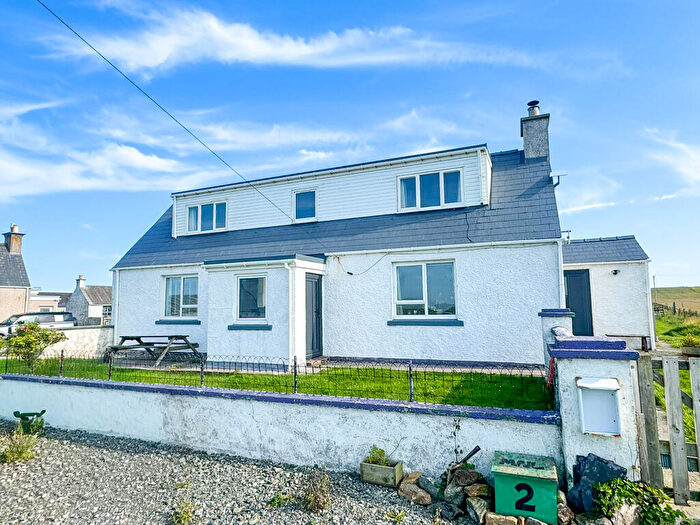
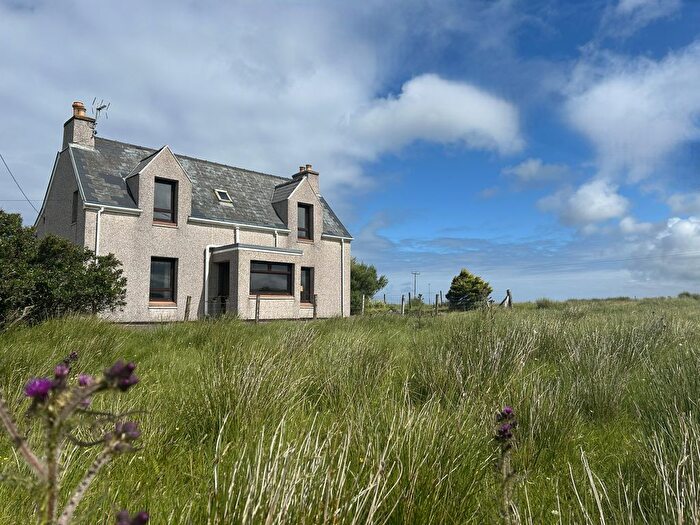
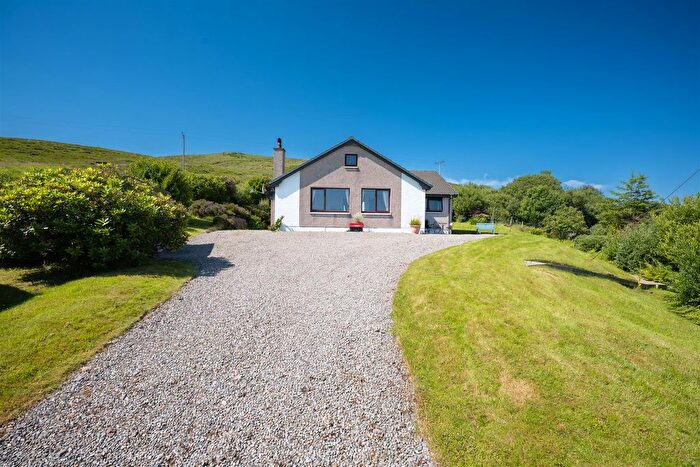
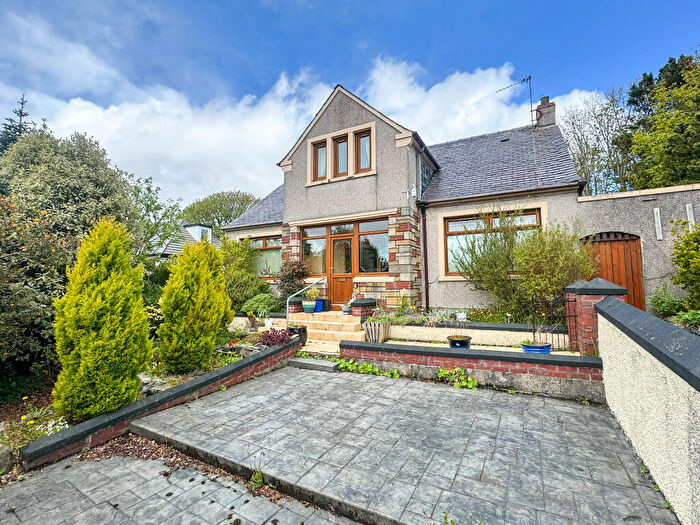
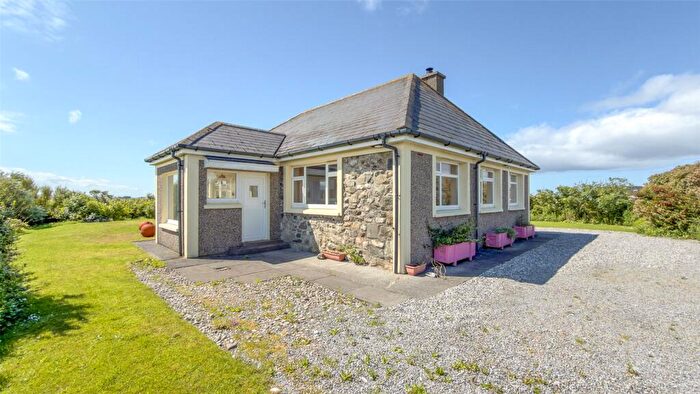
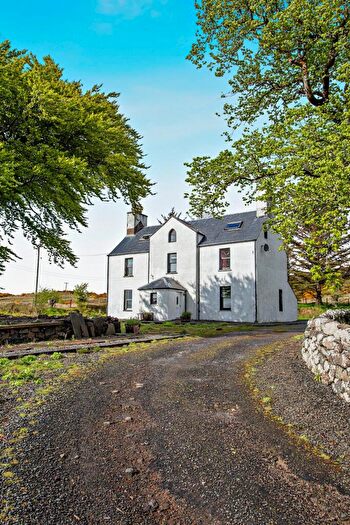
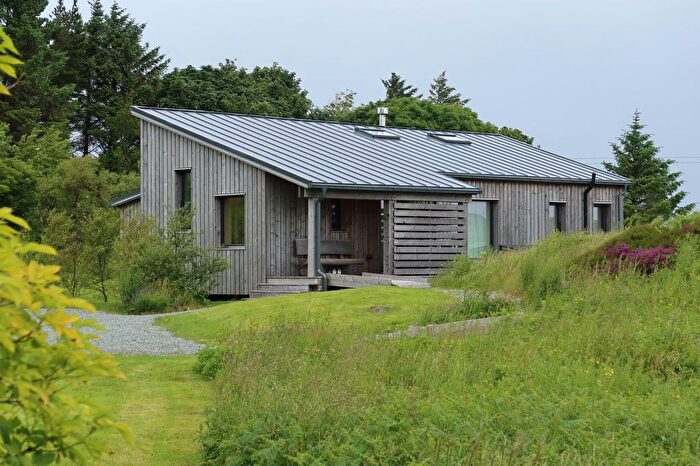
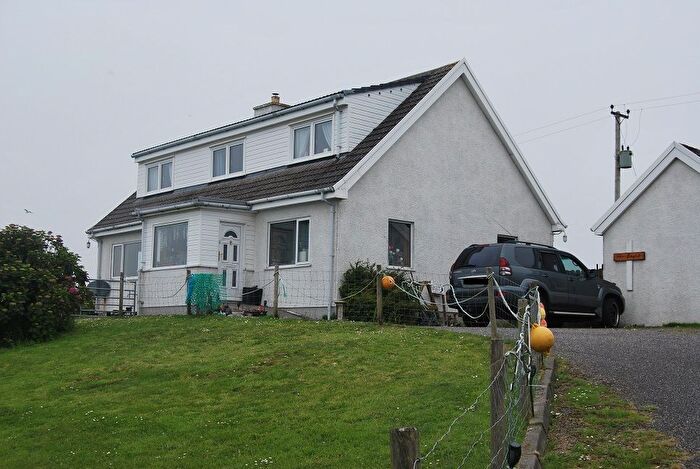
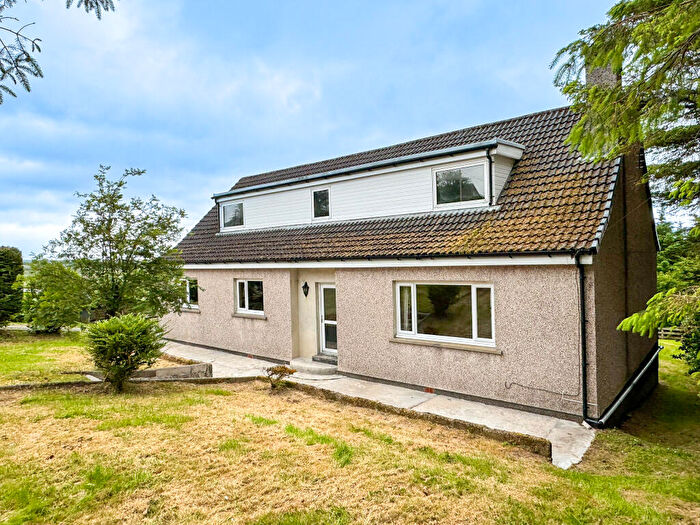
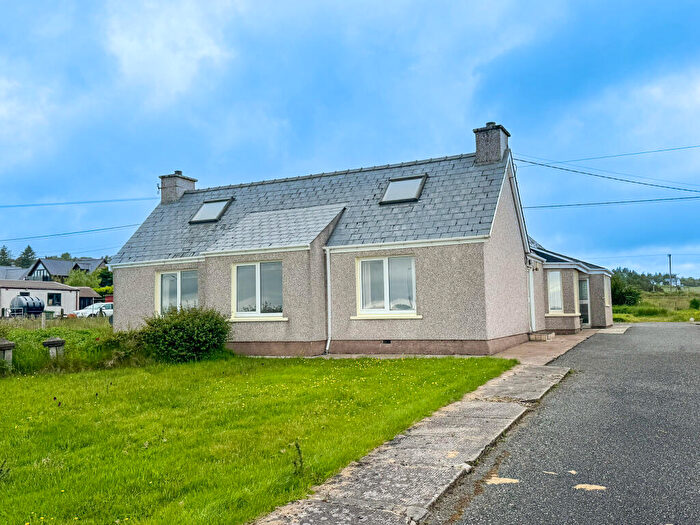
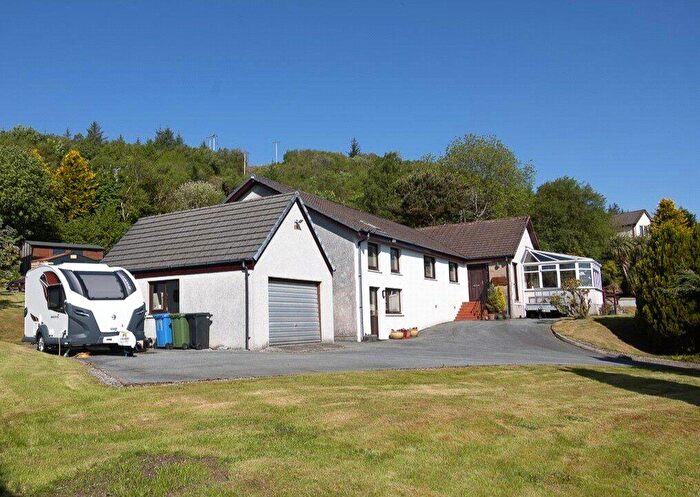
Properties for sale in Na h-Eileanan an Iar
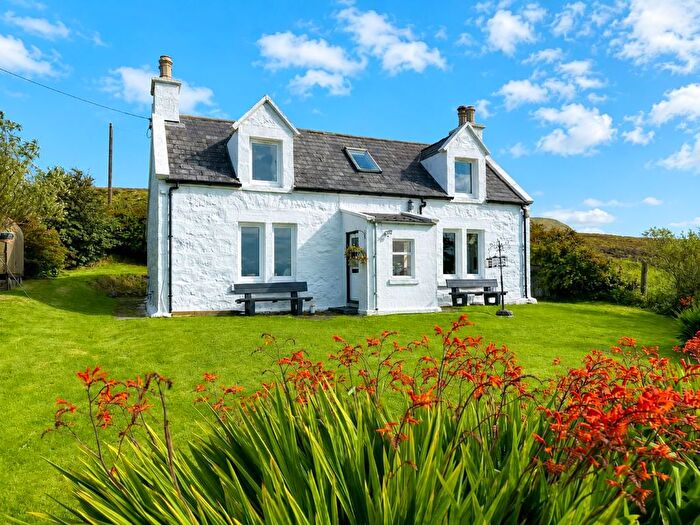
![]()
If you are looking to sell your house, let it out, or receive a property valuation, an expert can help you.
Click the button below to get started.


Towns in Na h-Eileanan an Iar
Navigate through our locations to find the location of your next house in Na h-Eileanan an Iar, Scotland for sale or to rent.
Property price trends in Na h-Eileanan an Iar
According to the latest Registers of Scotland data, the average home in Na h-Eileanan an Iar sold for £135,068 in 2026. That figure comes from a substantial record of 6,339 sales logged over the past 26 years.
Prices have fallen back over the last three years. Compared with 2023, when the typical sale came in around £150,385, that's a fall of roughly 10.2%.
Looking back five years, average prices are down about 4.4% since 2021, a drop of around £6,276 in cash terms.
Zoom out to the past decade for the fuller picture. Back in 2016, homes here averaged £105,367, so the typical sold price has climbed about 28.2% since then, roughly 2.5% a year. Stretch the view to fifteen years and that annual pace eases back to about 2%.
Frequently asked questions about Na h-Eileanan an Iar
What is the average price for a property for sale in Na h-Eileanan an Iar?
The average price for a property for sale in Na h-Eileanan an Iar is £150,067. This amount is 26% lower than the average price in Scotland. There are 1,982 property listings for sale in Na h-Eileanan an Iar.
What locations have the most expensive properties for sale in Na h-Eileanan an Iar?
The locations with the most expensive properties for sale in Na h-Eileanan an Iar are Isle Of North Uist at an average of £202,367, Isle Of Barra at an average of £159,300 and Isle Of Lewis at an average of £158,520.
What locations have the most affordable properties for sale in Na h-Eileanan an Iar?
The locations with the most affordable properties for sale in Na h-Eileanan an Iar are Isle Of Benbecula at an average of £133,861, Stornoway at an average of £135,411 and Isle Of Harris at an average of £142,041.
Which train stations are available in or near Na h-Eileanan an Iar?
Some of the train stations available in or near Na h-Eileanan an Iar are Plockton, Duirinish and Duncraig.
Property Price Paid in Na h-Eileanan an Iar by Year
The average sold property price by year was:
| Year | Average Sold Price | Price Change |
Sold Properties
|
|---|---|---|---|
| 2026 | £135,068 | -20% |
22 Properties |
| 2025 | £162,020 | 13% |
97 Properties |
| 2024 | £140,187 | -7% |
88 Properties |
| 2023 | £150,385 | -0,5% |
126 Properties |
| 2022 | £151,066 | 6% |
291 Properties |
| 2021 | £141,344 | 4% |
389 Properties |
| 2020 | £135,957 | 10% |
231 Properties |
| 2019 | £122,824 | 7% |
319 Properties |
| 2018 | £114,567 | 11% |
290 Properties |
| 2017 | £101,867 | -3% |
321 Properties |
Transport in Na h-Eileanan an Iar
Please see below transportation links in this area:
