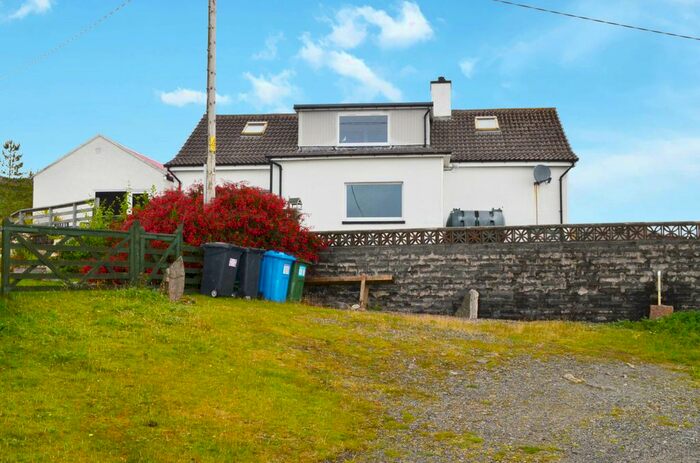
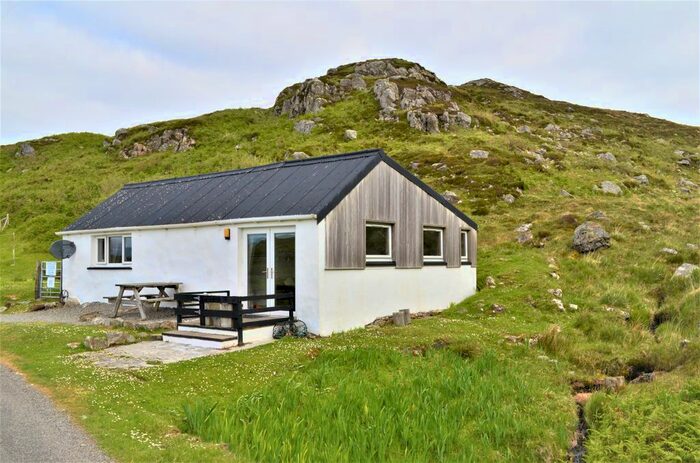
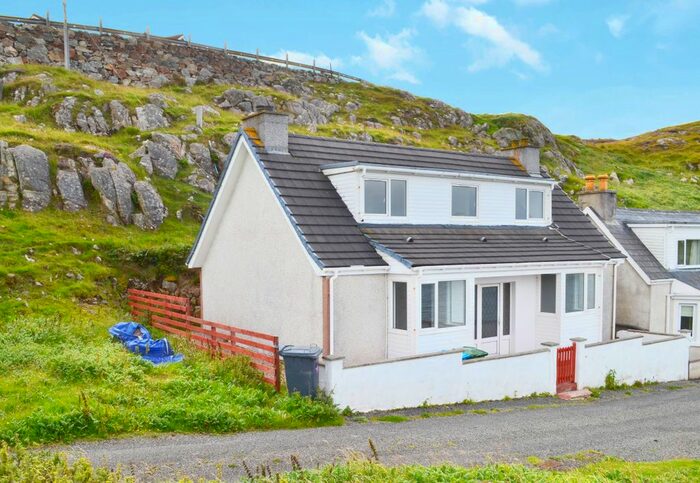
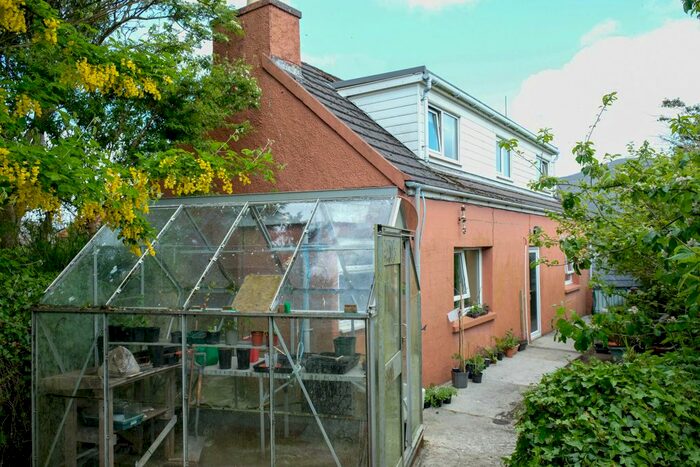
Houses for sale & to rent in Na Hearadh agus Ceann a Deas nan Loch, Isle Of Scalpay
House Prices in Na Hearadh agus Ceann a Deas nan Loch
Properties in Na Hearadh agus Ceann a Deas nan Loch have an average house price of £145,214.00 and had 7 Property Transactions within the last 3 years¹.
Na Hearadh agus Ceann a Deas nan Loch is an area in Isle Of Scalpay, Na h-Eileanan an Iar with 138 households², where the most expensive property was sold for £214,000.00.
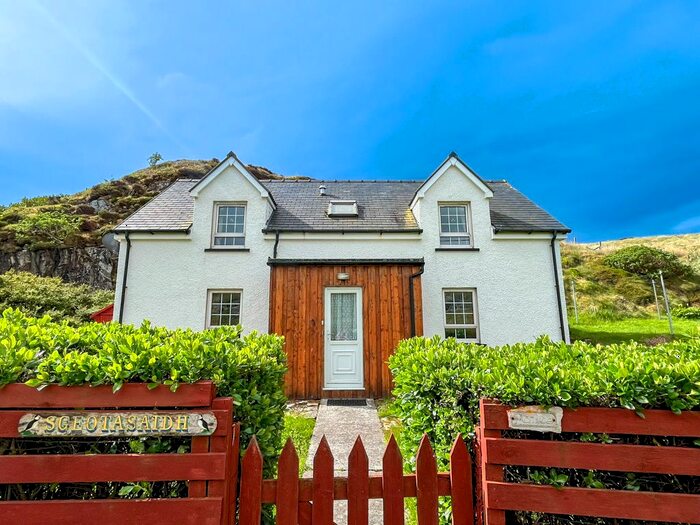
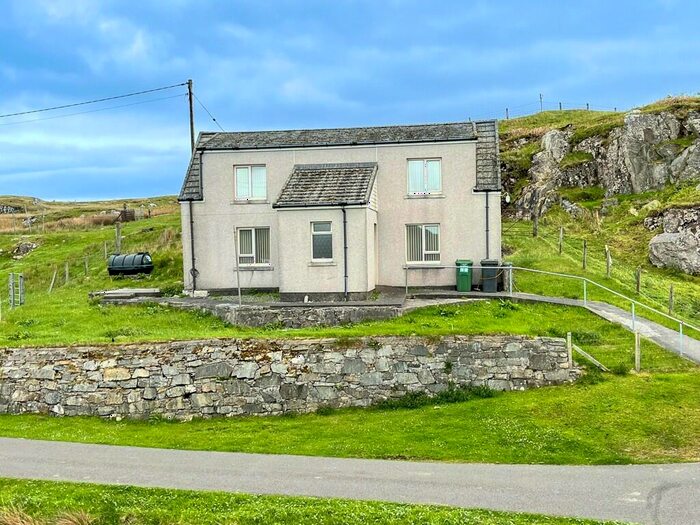
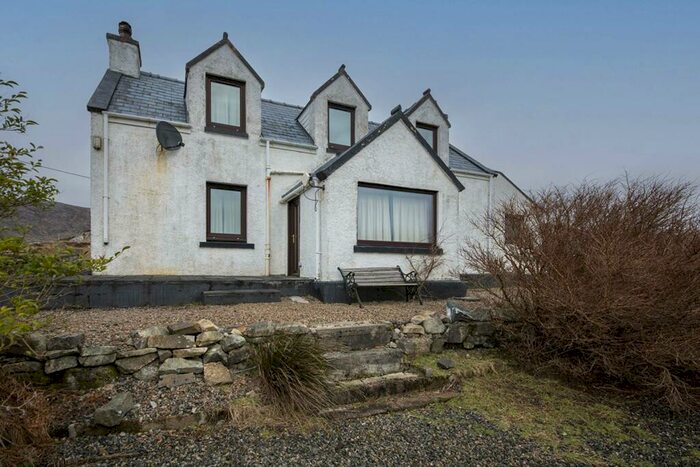
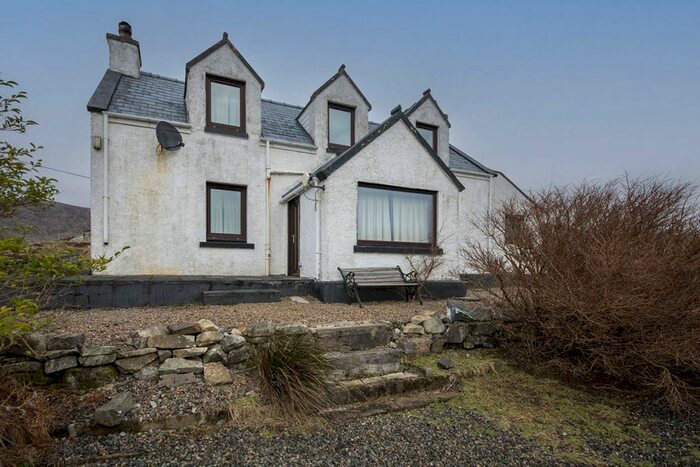
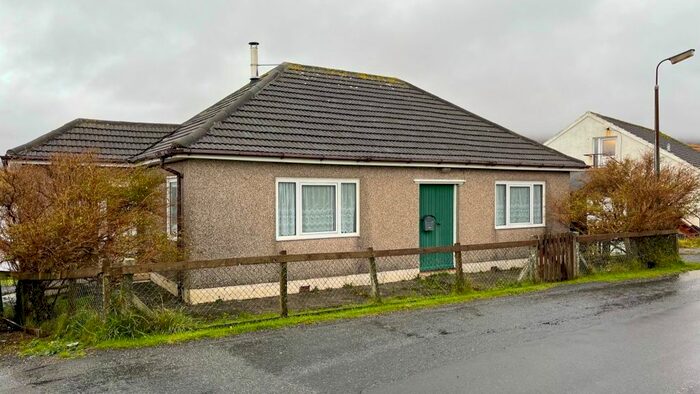
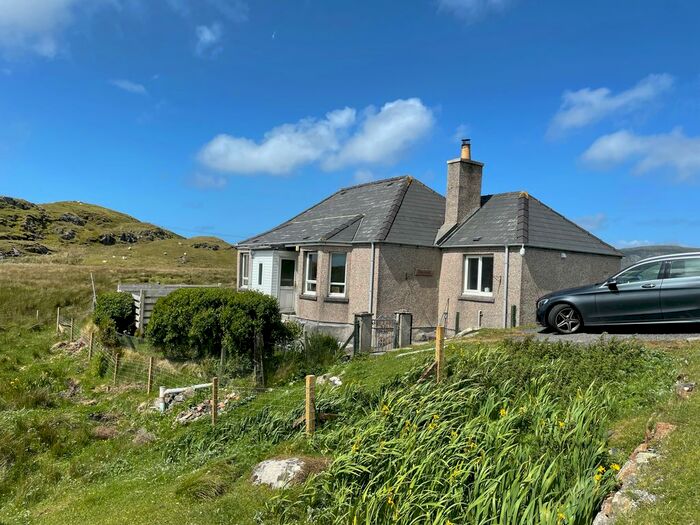
Properties for sale in Na Hearadh agus Ceann a Deas nan Loch
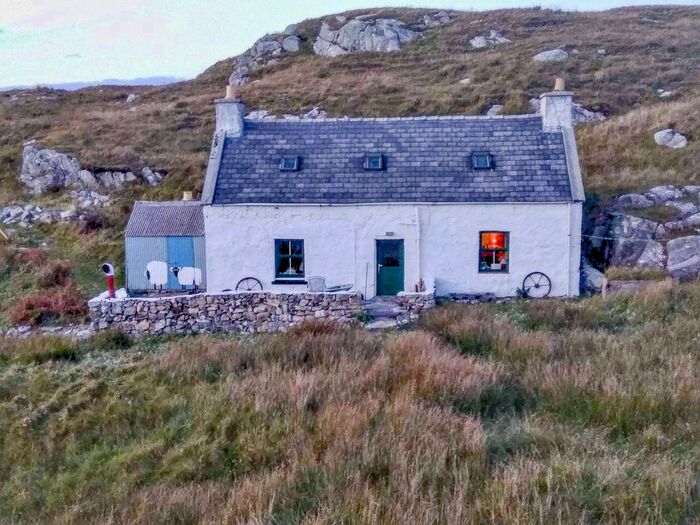
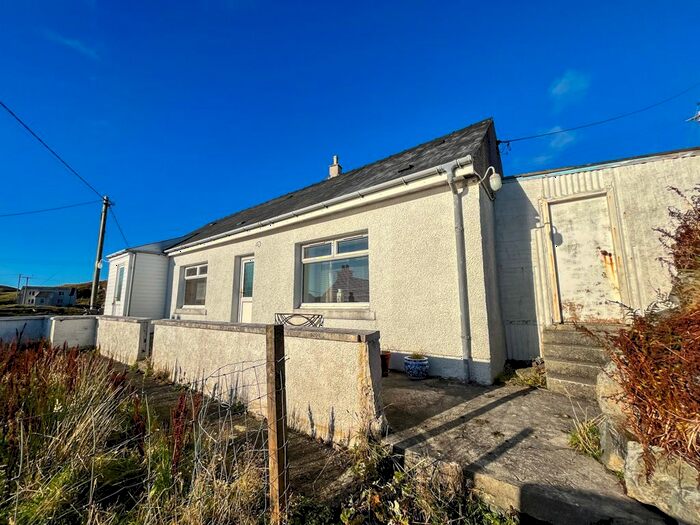
Previously listed properties in Na Hearadh agus Ceann a Deas nan Loch
Roads and Postcodes in Na Hearadh agus Ceann a Deas nan Loch
Navigate through our locations to find the location of your next house in Na Hearadh agus Ceann a Deas nan Loch, Isle Of Scalpay for sale or to rent.
| Streets | Postcodes |
|---|---|
| Cuddy Point | HS4 3YD |
| Outend | HS4 3YG |
| Parkview Terrace | HS4 3XX |
| Upcaw | HS4 3YA |
| HS4 3XU HS4 3XY HS4 3XZ HS4 3YB HS4 3YF HS4 3YZ |
Transport near Na Hearadh agus Ceann a Deas nan Loch
-
Plockton Station
-
Duirinish Station
-
Duncraig Station
-
Kyle Of Lochalsh Station
-
Stromeferry Station
-
Strathcarron Station
-
Attadale Station
-
Achnashellach Station
-
Achnasheen Station
-
Mallaig Station
- FAQ
- Price Paid By Year
Frequently asked questions about Na Hearadh agus Ceann a Deas nan Loch
What is the average price for a property for sale in Na Hearadh agus Ceann a Deas nan Loch?
The average price for a property for sale in Na Hearadh agus Ceann a Deas nan Loch is £145,214. There are 18 property listings for sale in Na Hearadh agus Ceann a Deas nan Loch.
Which train stations are available in or near Na Hearadh agus Ceann a Deas nan Loch?
Some of the train stations available in or near Na Hearadh agus Ceann a Deas nan Loch are Plockton, Duirinish and Duncraig.
Property Price Paid in Na Hearadh agus Ceann a Deas nan Loch by Year
The average sold property price by year was:
| Year | Average Sold Price | Price Change |
Sold Properties
|
|---|---|---|---|
| 2023 | £193,250 | 35% |
2 Properties |
| 2022 | £126,000 | 9% |
5 Properties |
| 2021 | £115,083 | -109% |
6 Properties |
| 2020 | £240,000 | 44% |
2 Properties |
| 2019 | £133,781 | 28% |
4 Properties |
| 2018 | £95,857 | - |
7 Properties |
| 2017 | £95,875 | 13% |
4 Properties |
| 2016 | £83,333 | -2% |
3 Properties |
| 2015 | £85,000 | 24% |
1 Property |
| 2014 | £64,330 | -66% |
5 Properties |
| 2013 | £106,967 | 7% |
7 Properties |
| 2012 | £100,000 | -8% |
1 Property |
| 2011 | £108,333 | 23% |
3 Properties |
| 2010 | £83,250 | 73% |
4 Properties |
| 2009 | £22,550 | -166% |
3 Properties |
| 2008 | £59,884 | 66% |
5 Properties |
| 2007 | £20,083 | -150% |
3 Properties |
| 2006 | £50,163 | 6% |
11 Properties |
| 2005 | £47,357 | 81% |
4 Properties |
| 2004 | £9,050 | -119% |
4 Properties |
| 2003 | £19,835 | -78% |
7 Properties |
| 2002 | £35,250 | - |
2 Properties |

