
Houses for sale & to rent in KA11 1BS, Lanfine Row, Irvine East, Irvine
House Prices in KA11 1BS, Lanfine Row, Irvine East
Properties in KA11 1BS have no sales history available within the last 3 years. KA11 1BS is a postcode in Lanfine Row located in Irvine East, an area in Irvine, North Ayrshire, with 7 households².
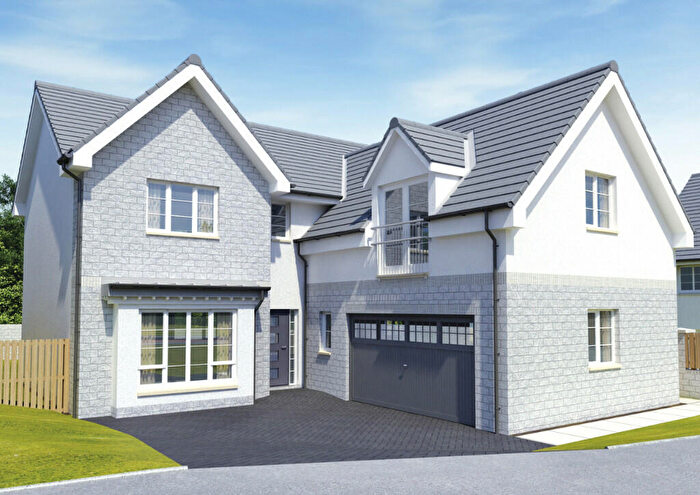
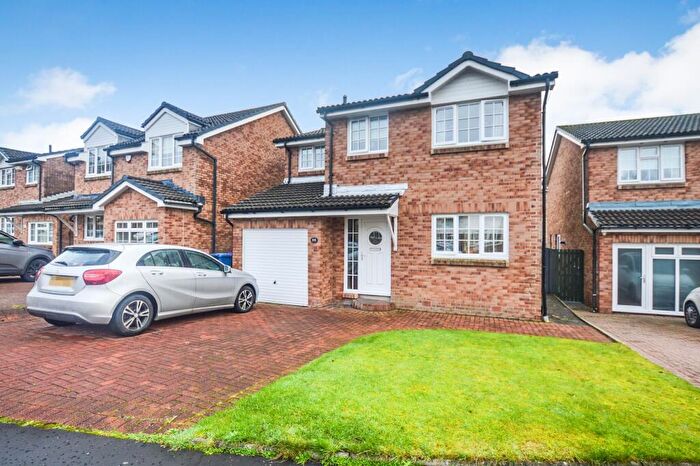
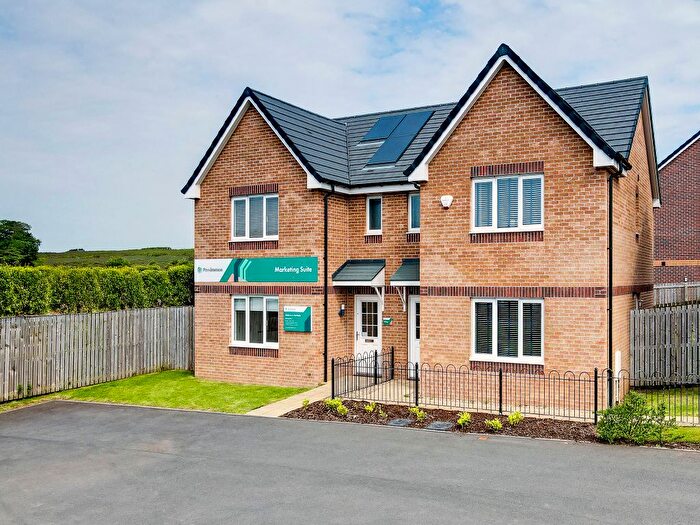
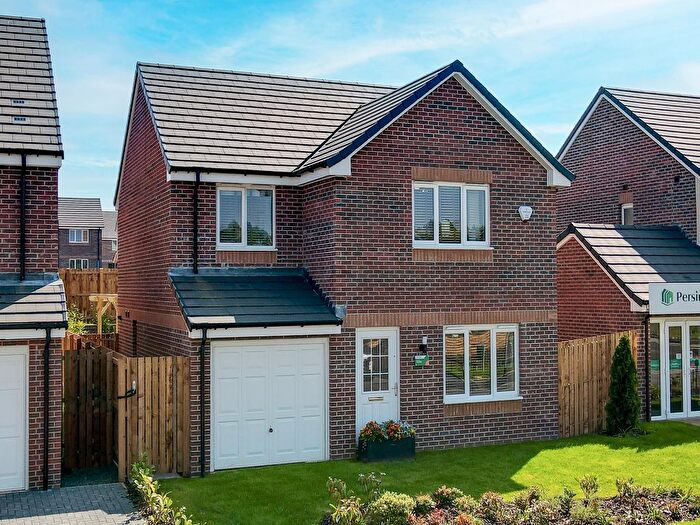
Properties for sale near KA11 1BS, Lanfine Row

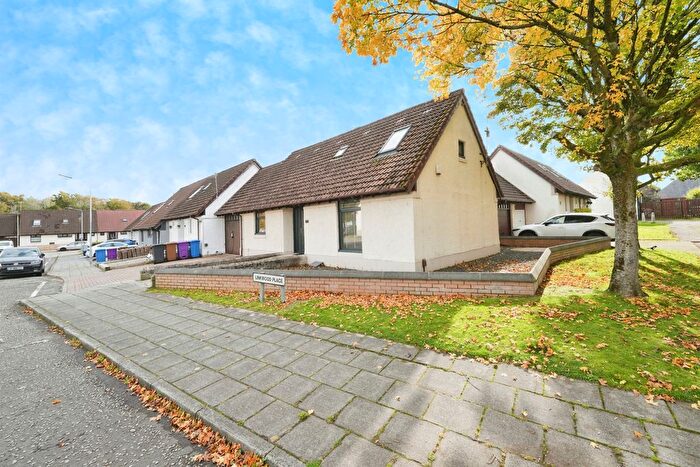
![]()
If you are looking to sell your house, let it out, or receive a property valuation, an expert can help you.
Click the button below to get started.


Price Paid in Lanfine Row, KA11 1BS, Irvine East
7 Lanfine Row, KA11 1BS, Irvine East Irvine
Property 7 has been sold 1 time. The last time it was sold was in 12/10/2017 and the sold price was £64,000.00.
This is a Property which was sold as an Established Building in 12/10/2017
| Date | Price | Classification |
|---|---|---|
| 12/10/2017 | £64,000.00 | Established Building |
2 Lanfine Row, KA11 1BS, Irvine East Irvine
Property 2 has been sold 1 time. The last time it was sold was in 06/05/2010 and the sold price was £96,000.00.
This is a Property which was sold as an Established Building in 06/05/2010
| Date | Price | Classification |
|---|---|---|
| 06/05/2010 | £96,000.00 | Established Building |
3 Lanfine Row, KA11 1BS, Irvine East Irvine
Property 3 has been sold 1 time. The last time it was sold was in 12/02/2004 and the sold price was £62,000.00.
This is a Property which was sold as an Established Building in 12/02/2004
| Date | Price | Classification |
|---|---|---|
| 12/02/2004 | £62,000.00 | Established Building |
6 Lanfine Row, KA11 1BS, Irvine East Irvine
Property 6 has been sold 1 time. The last time it was sold was in 11/03/2003 and the sold price was £24,600.00.
This is a Property which was sold as an Established Building in 11/03/2003
| Date | Price | Classification |
|---|---|---|
| 11/03/2003 | £24,600.00 | Established Building |
Transport near KA11 1BS, Lanfine Row

House price paid reports for KA11 1BS, Lanfine Row
Click on the buttons below to see price paid reports by year or property price:
- Price Paid By Year
Property Price Paid in KA11 1BS, Lanfine Row by Year
The average sold property price by year was:
| Year | Average Sold Price | Price Change |
Sold Properties
|
|---|---|---|---|
| 2017 | £64,000 | -50% |
1 Property |
| 2010 | £96,000 | 35% |
1 Property |
| 2004 | £62,000 | 60% |
1 Property |
| 2003 | £24,600 | - |
1 Property |