
Houses for sale & to rent in KA11 1RW, Chestnut Gardens, Irvine East, Irvine
House Prices in KA11 1RW, Chestnut Gardens, Irvine East
Properties in KA11 1RW have an average house price of £128,831.00 and had 3 Property Transactions within the last 3 years.¹ KA11 1RW is a postcode in Chestnut Gardens located in Irvine East, an area in Irvine, North Ayrshire, with 7 households², where the most expensive property was sold for £136,000.00.
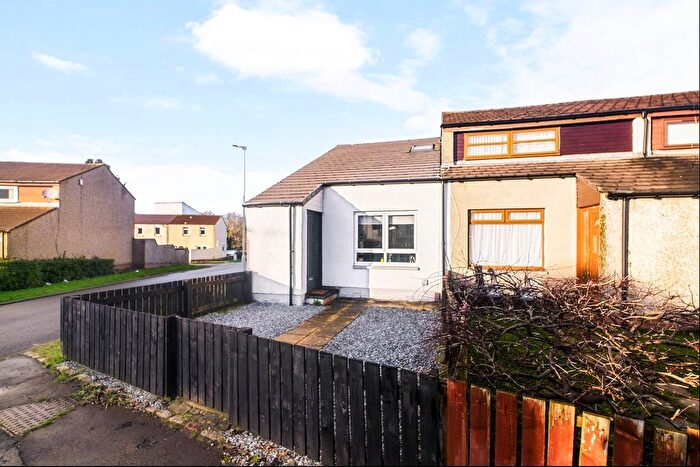
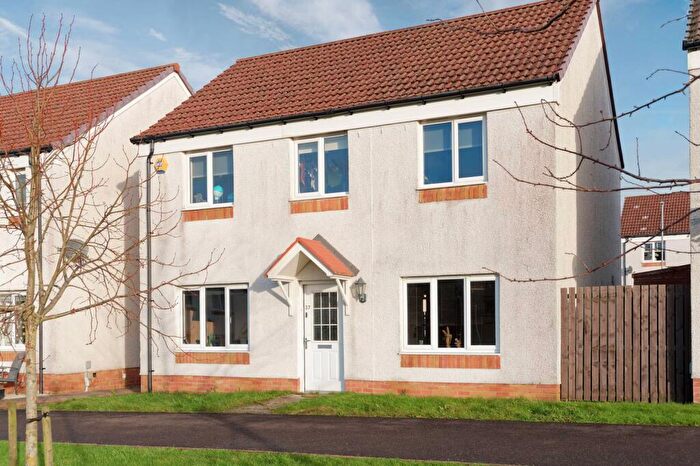
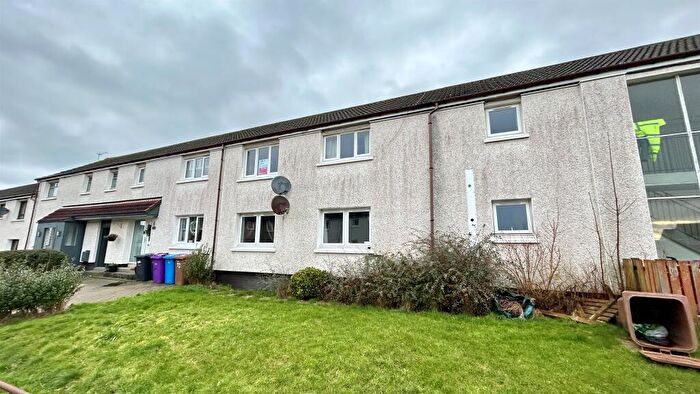
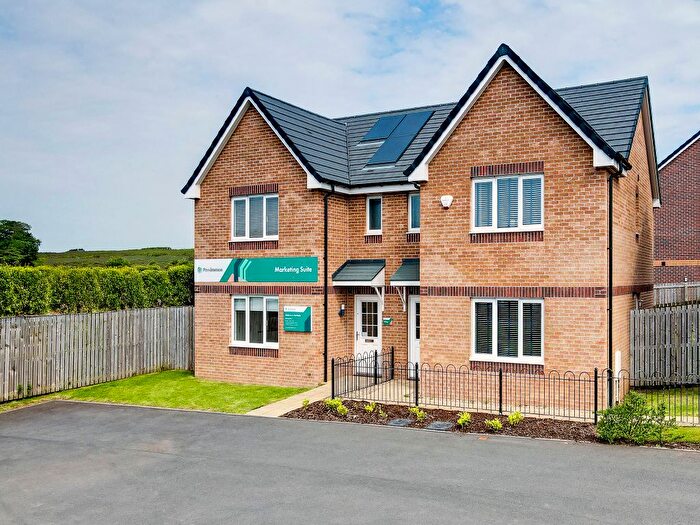
Properties for sale near KA11 1RW, Chestnut Gardens
![]()
If you are looking to sell your house, let it out, or receive a property valuation, an expert can help you.
Click the button below to get started.

Price Paid in Chestnut Gardens, KA11 1RW, Irvine East
3 Chestnut Gardens, KA11 1RW, Irvine East Irvine
Property 3 has been sold 3 times. The last time it was sold was in 21/02/2023 and the sold price was £120,495.00.
This is a Property which was sold as an Established Building in 21/02/2023
| Date | Price | Classification |
|---|---|---|
| 21/02/2023 | £120,495.00 | Established Building |
| 01/09/2020 | £90,000.00 | Established Building |
| 02/08/2018 | £80,000.00 | Established Building |
4 Chestnut Gardens, KA11 1RW, Irvine East Irvine
Property 4 has been sold 4 times. The last time it was sold was in 20/10/2022 and the sold price was £136,000.00.
This is a Property which was sold as an Established Building in 20/10/2022
| Date | Price | Classification |
|---|---|---|
| 20/10/2022 | £136,000.00 | Established Building |
| 02/03/2017 | £120,000.00 | Established Building |
| 12/12/2007 | £132,000.00 | Established Building |
| 12/03/2004 | £90,000.00 | Established Building |
2 Chestnut Gardens, KA11 1RW, Irvine East Irvine
Property 2 has been sold 2 times. The last time it was sold was in 18/07/2022 and the sold price was £130,000.00.
This is a Property which was sold as an Established Building in 18/07/2022
| Date | Price | Classification |
|---|---|---|
| 18/07/2022 | £130,000.00 | Established Building |
| 19/02/2019 | £117,500.00 | Established Building |
5 Chestnut Gardens, KA11 1RW, Irvine East Irvine
Property 5 has been sold 3 times. The last time it was sold was in 17/01/2020 and the sold price was £190,000.00.
This is a Property which was sold as an Established Building in 17/01/2020
| Date | Price | Classification |
|---|---|---|
| 17/01/2020 | £190,000.00 | Established Building |
| 25/09/2019 | £200,000.00 | Established Building |
| 05/12/2013 | £162,000.00 | Established Building |
1 Chestnut Gardens, KA11 1RW, Irvine East Irvine
Property 1 has been sold 2 times. The last time it was sold was in 09/10/2017 and the sold price was £107,000.00.
This is a Property which was sold as an Established Building in 09/10/2017
| Date | Price | Classification |
|---|---|---|
| 09/10/2017 | £107,000.00 | Established Building |
| 09/05/2012 | £85,000.00 | Established Building |
7 Chestnut Gardens, KA11 1RW, Irvine East Irvine
Property 7 has been sold 3 times. The last time it was sold was in 21/01/2016 and the sold price was £129,000.00.
This is a Property which was sold as an Established Building in 21/01/2016
| Date | Price | Classification |
|---|---|---|
| 21/01/2016 | £129,000.00 | Established Building |
| 28/06/2011 | £122,500.00 | Established Building |
| 14/12/2007 | £140,000.00 | Established Building |
6 Chestnut Gardens, KA11 1RW, Irvine East Irvine
Property 6 has been sold 2 times. The last time it was sold was in 15/08/2007 and the sold price was £141,000.00.
This is a Property which was sold as an Established Building in 15/08/2007
| Date | Price | Classification |
|---|---|---|
| 15/08/2007 | £141,000.00 | Established Building |
| 11/05/2006 | £125,000.00 | Established Building |
Transport near KA11 1RW, Chestnut Gardens

House price paid reports for KA11 1RW, Chestnut Gardens
Click on the buttons below to see price paid reports by year or property price:
- Price Paid By Year
Property Price Paid in KA11 1RW, Chestnut Gardens by Year
The average sold property price by year was:
| Year | Average Sold Price | Price Change |
Sold Properties
|
|---|---|---|---|
| 2023 | £120,495 | -10% |
1 Property |
| 2022 | £133,000 | -5% |
2 Properties |
| 2020 | £140,000 | -13% |
2 Properties |
| 2019 | £158,750 | 50% |
2 Properties |
| 2018 | £80,000 | -42% |
1 Property |
| 2017 | £113,500 | -14% |
2 Properties |
| 2016 | £129,000 | -26% |
1 Property |
| 2013 | £162,000 | 48% |
1 Property |
| 2012 | £85,000 | -44% |
1 Property |
| 2011 | £122,500 | -12% |
1 Property |
| 2007 | £137,666 | 9% |
3 Properties |
| 2006 | £125,000 | 28% |
1 Property |
| 2004 | £90,000 | - |
1 Property |