
Houses for sale & to rent in Kilwinning, North Ayrshire
House Prices in Kilwinning
Properties in Kilwinning have an average house price of £140k and had 417 Property Transactions within the last 3 years.¹
Kilwinning is an area in North Ayrshire with 7,330 households², where the most expensive property was sold for £670k.
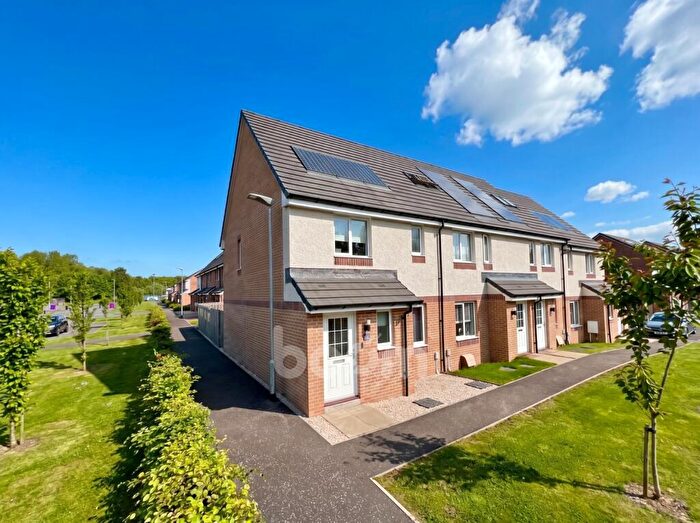
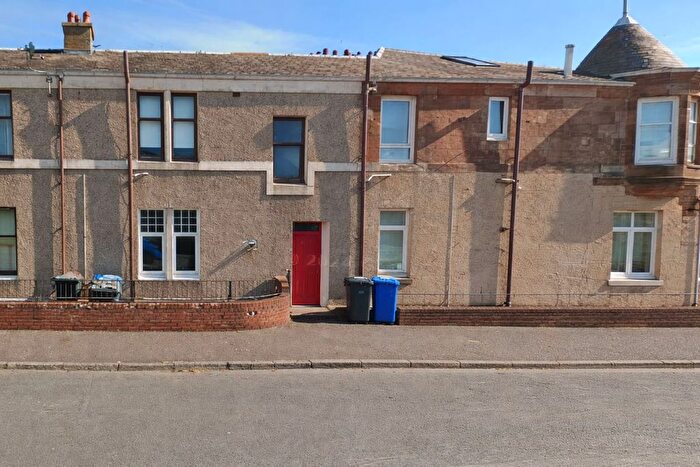
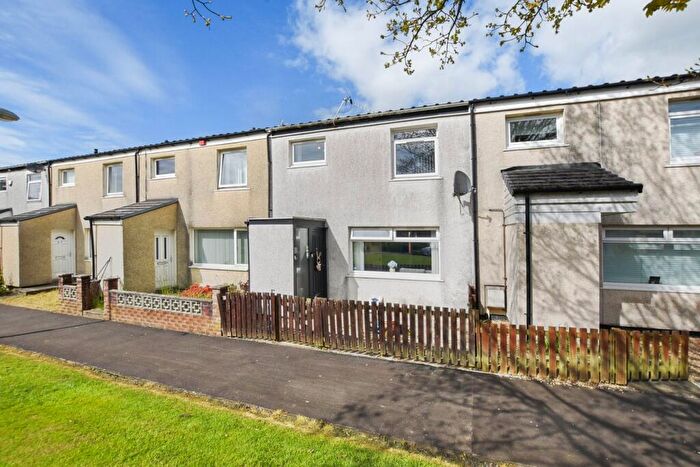
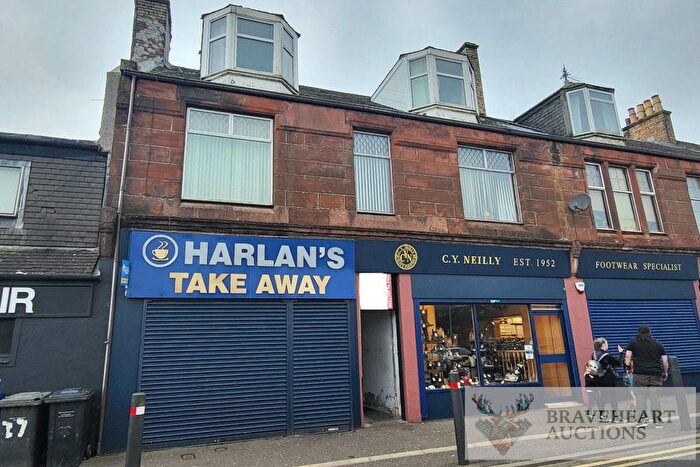
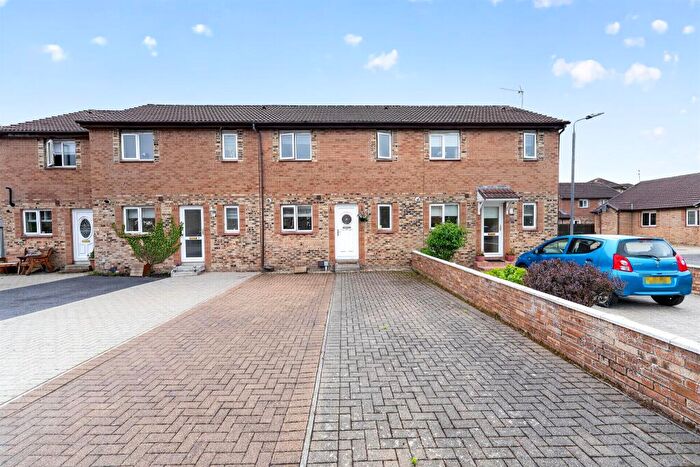
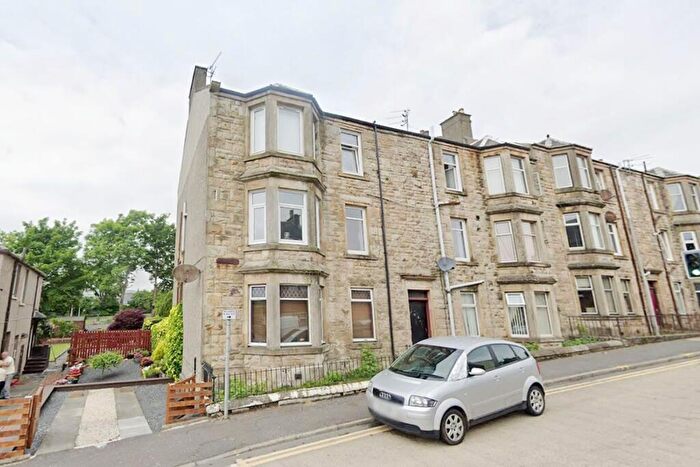
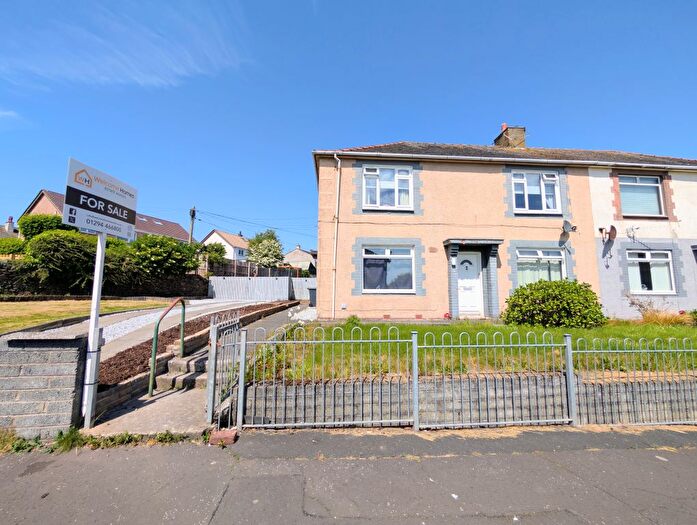
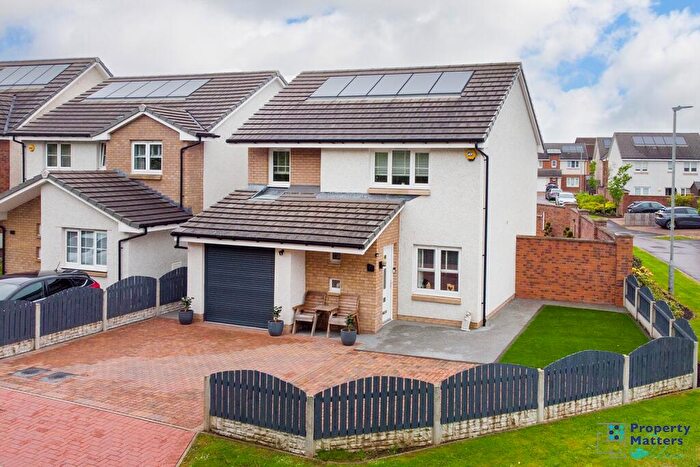
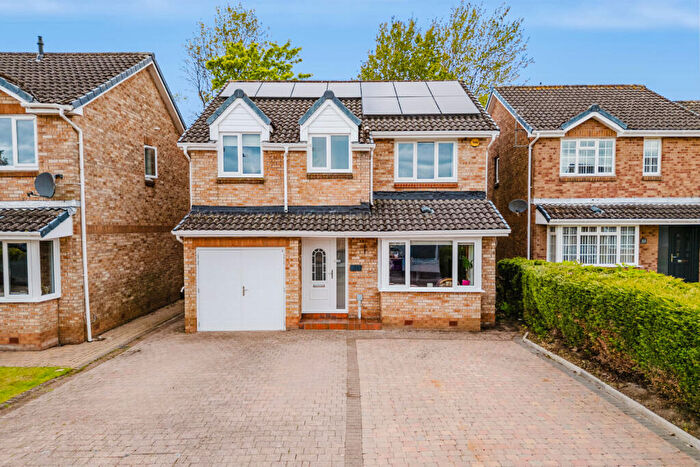
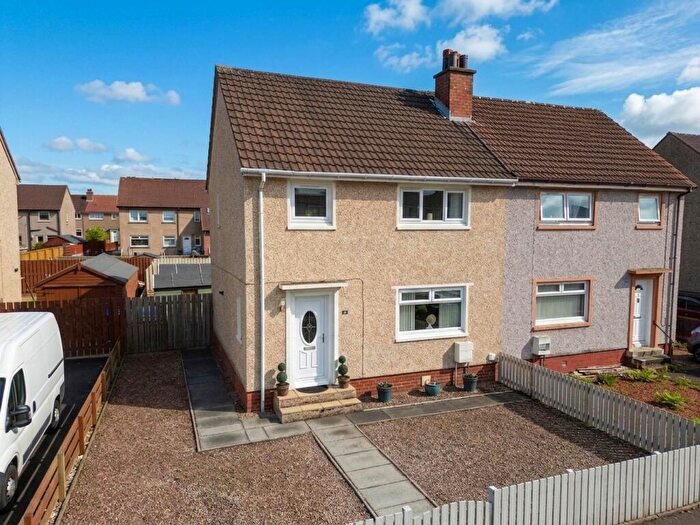
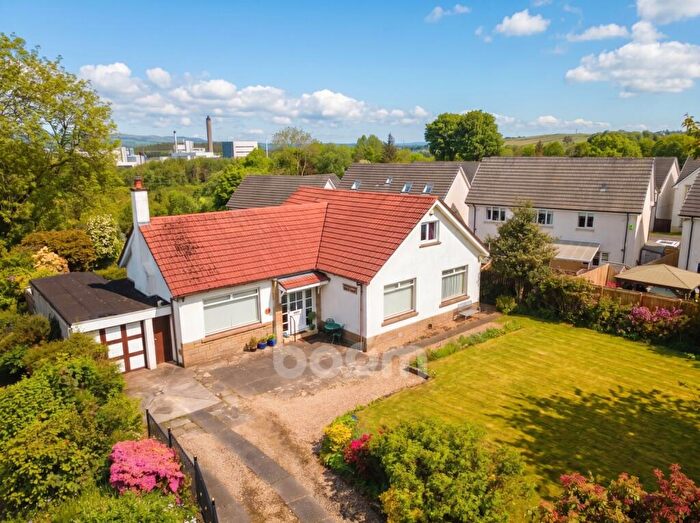
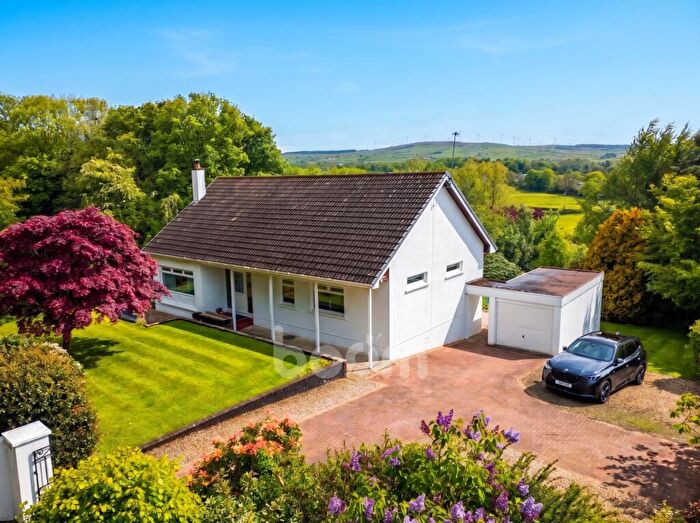
Properties for sale in Kilwinning
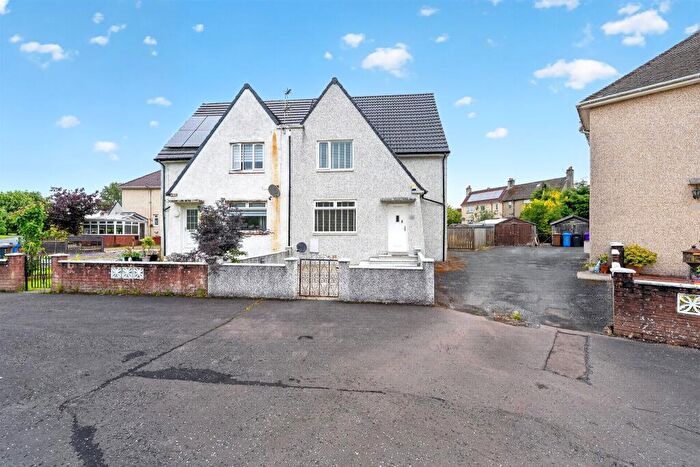
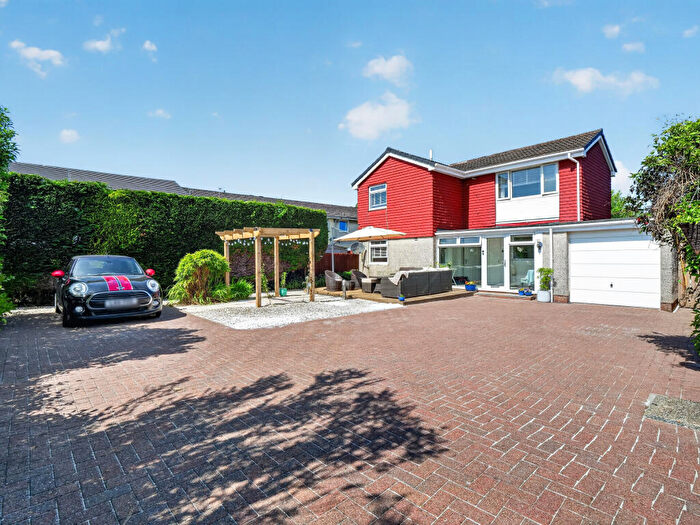
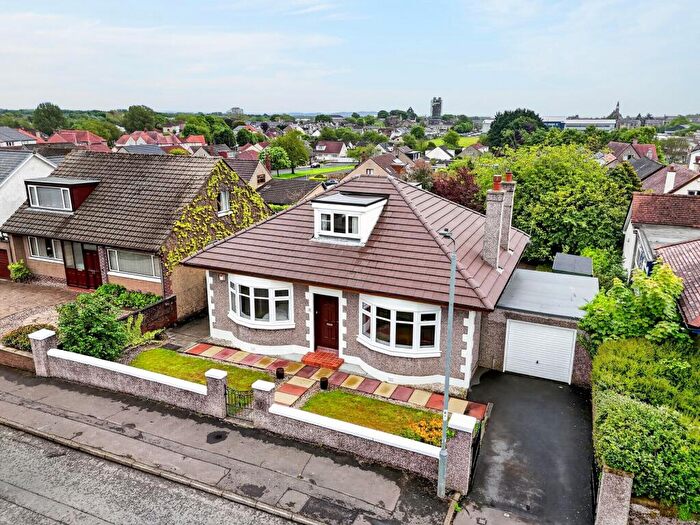
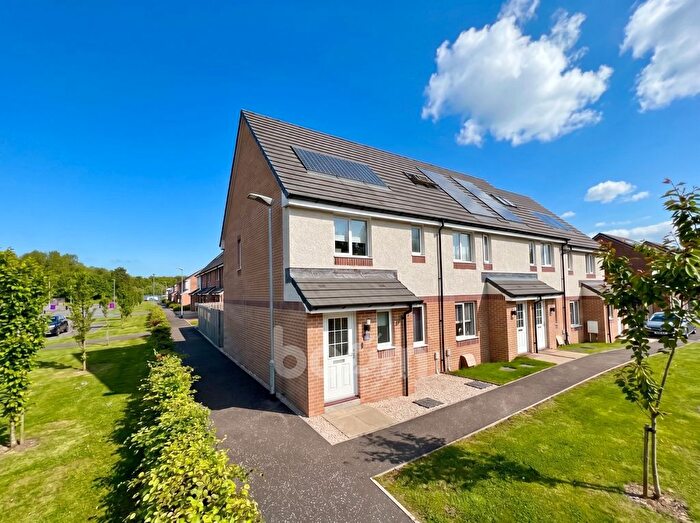
![]()
If you are looking to sell your house, let it out, or receive a property valuation, an expert can help you.
Click the button below to get started.


Neighbourhoods in Kilwinning
Navigate through our locations to find the location of your next house in Kilwinning, North Ayrshire for sale or to rent.
Transport in Kilwinning
Please see below transportation links in this area:
-
 Kilwinning Station
 -
Stevenston Station
-
Irvine Station
-
Dalry Station
-
Saltcoats Station
-
Ardrossan South Beach Station
-
Ardrossan Town Station
-
Ardrossan Harbour Station
- FAQ
- Price Paid By Year
Frequently asked questions about Kilwinning
What is the average price for a property for sale in Kilwinning?
The average price for a property for sale in Kilwinning is £140,443. This amount is 2% lower than the average price in North Ayrshire. There are 3,480 property listings for sale in Kilwinning.
Which train stations are available in or near Kilwinning?
Some of the train stations available in or near Kilwinning are Kilwinning, Stevenston and Irvine.
Property Price Paid in Kilwinning by Year
The average sold property price by year was:
| Year | Average Sold Price | Price Change |
Sold Properties
|
|---|---|---|---|
| 2025 | £148,920 | 5% |
149 Properties |
| 2024 | £141,349 | 8% |
133 Properties |
| 2023 | £130,195 | -7% |
135 Properties |
| 2022 | £139,380 | 7% |
253 Properties |
| 2021 | £129,803 | 10% |
285 Properties |
| 2020 | £116,446 | 1% |
202 Properties |
| 2019 | £115,219 | 7% |
246 Properties |
| 2018 | £106,969 | 3% |
194 Properties |
| 2017 | £103,713 | 1% |
200 Properties |
| 2016 | £103,162 | -21% |
265 Properties |
| 2015 | £125,284 | 6% |
252 Properties |
| 2014 | £118,026 | 17% |
231 Properties |
| 2013 | £98,475 | -3% |
196 Properties |
| 2012 | £101,053 | -17% |
236 Properties |
| 2011 | £118,131 | -9% |
165 Properties |
| 2010 | £129,261 | 10% |
218 Properties |
| 2009 | £116,214 | 7% |
155 Properties |
| 2008 | £107,880 | - |
240 Properties |
| 2007 | £107,849 | 13% |
425 Properties |
| 2006 | £93,447 | 4% |
484 Properties |
| 2005 | £89,963 | 13% |
465 Properties |
| 2004 | £78,091 | 16% |
362 Properties |
| 2003 | £65,880 | -3% |
400 Properties |
| 2002 | £68,020 | 14% |
452 Properties |
| 2001 | £58,658 | - |
40 Properties |